Trump has been President for 1 year and fighting against Biden and the Democrats economic misery.
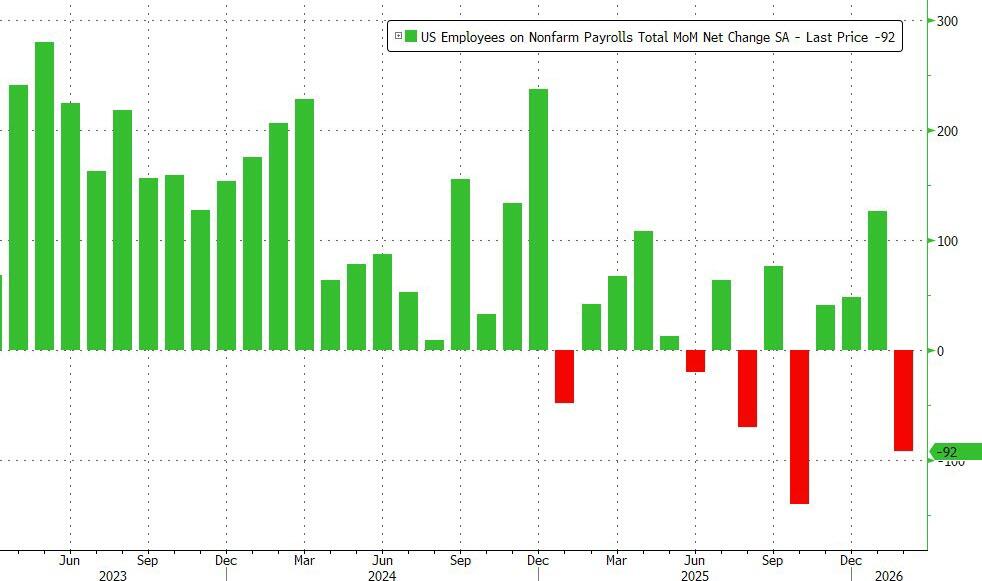
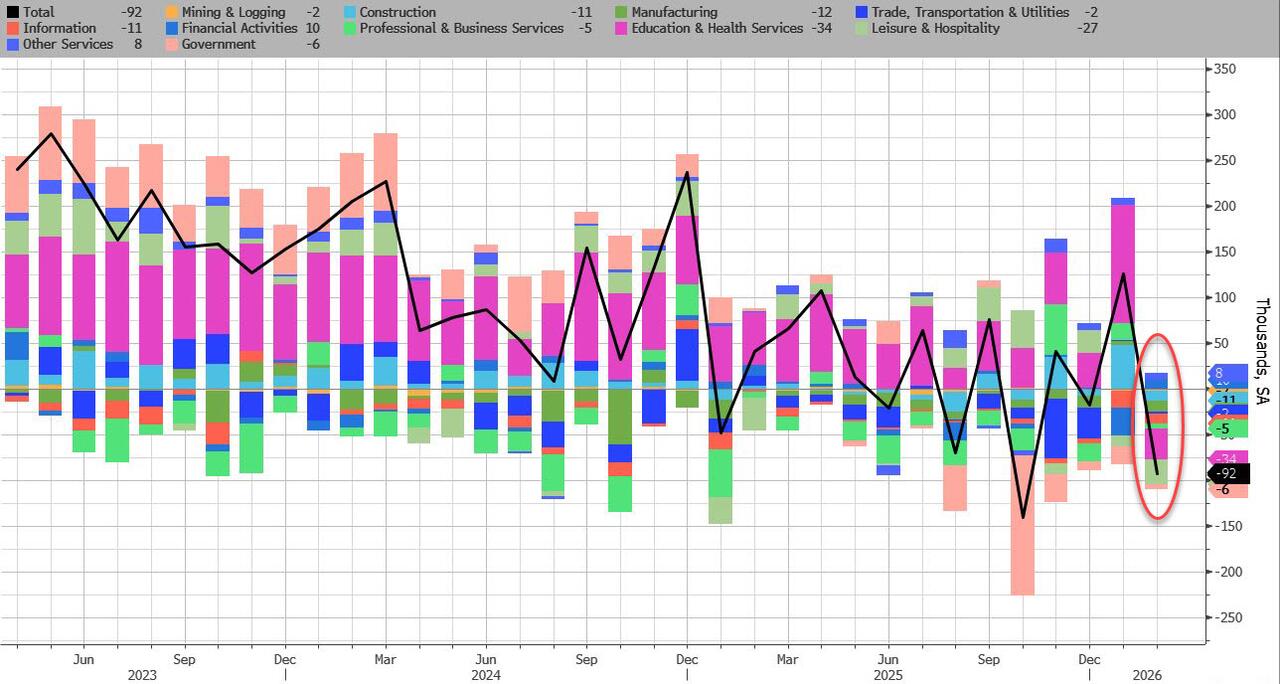
In February, the US lost 92,000 jobs, a huge drop from the downward revised 126K in January, and the second worst print since 2020 (only October’s shock -140K was worse), and this time, the massive drop can’t be dismissed as a one-time drop in government payrolls. The number of private payrolls dropped by 86K, also a huge miss to estimates of a 60K increase.
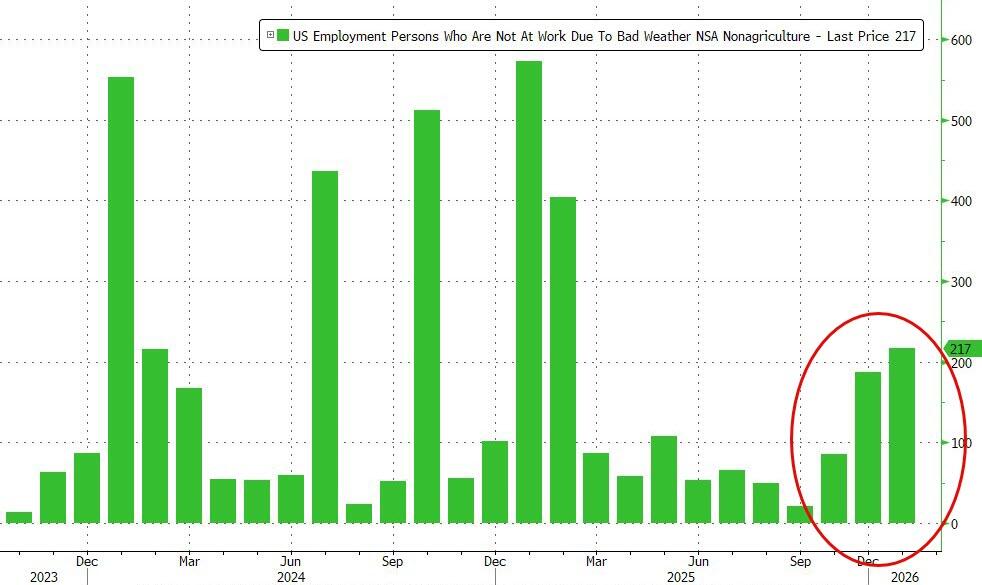
One potential mitigating factor: the number of people who were unable to work due to weather surged to 228K in February, well above last year’s level 167K, due to the powerful winter storms hitting the US.
The number of long-term unemployed (those jobless for 27 weeks or more) changed little at 1.9 million in February but is up from 1.5 million a year earlier. The long-term unemployed accounted for 25.3 percent of all unemployed people in February.
The number of people employed part time for economic reasons decreased by 477,000 to 4.4 million in February. These individuals would have preferred full-time employment but were working part time because their hours had been reduced or they were unable to find full-time jobs.
The number of people not in the labor force who currently want a job changed little in February at 6.0 million. These individuals were not counted as unemployed because they were not actively looking for work during the 4 weeks preceding the survey or were unavailable to take a job.
Among those not in the labor force who wanted a job, the number of people marginally attached to the labor force changed little at 1.6 million in February. These individuals wanted and were available for work and had looked for a job sometime in the prior 12 months but had not looked for work in the 4 weeks preceding the survey. The number of discouraged workers, a subset of the marginally attached who believed that no jobs were available for them, decreased by 109,000 in February to 366,000.
Turning to the establishment survey, which unveiled the shocking February drop, the BLS reported a broad-based decline, driven by striking employment workers:
Employment in health care decreased in February, reflecting strike activity. Employment in information and federal government continued to trend down. Payroll employment changed little on net in 2025.
Health care employment declined by 28,000 in February, following a large increase in January (+77,000). Offices of physicians lost 37,000 jobs in February, primarily due to strike activity. Hospitals added 12,000 jobs. Over the prior 12 months, health care had added an average of 36,000 jobs per month.
Employment in information continued to trend down in February (-11,000). The industry had lost an average of 5,000 jobs per month over the prior 12 months.
In February, federal government employment continued to decline (-10,000). Since reaching a peak in October 2024, federal government employment is down by 330,000, or 11.0 percent.
Employment in social assistance continued its upward trend in February (+9,000), driven by individual and family services (+12,000).
Transportation and warehousing employment changed little in February (-11,000). A job loss in couriers and messengers (-17,000) was partially offset by a gain in air transportation (+5,000). Employment in transportation and warehousing has declined by 157,000, or 2.4 percent, since reaching a peak in February 2025.
Employment showed little change over the month in other major industries, including mining, quarrying, and oil and gas extraction; construction; manufacturing; wholesale trade; retail trade; financial activities; professional and business services; leisure and hospitality; and other services.
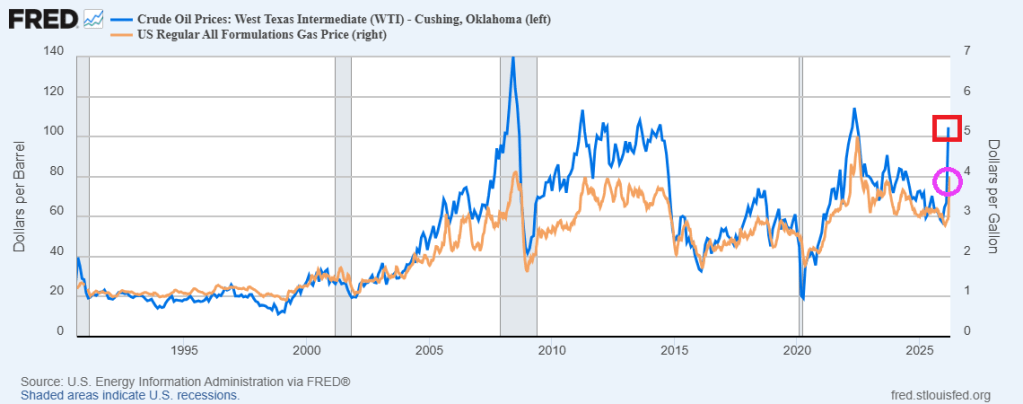
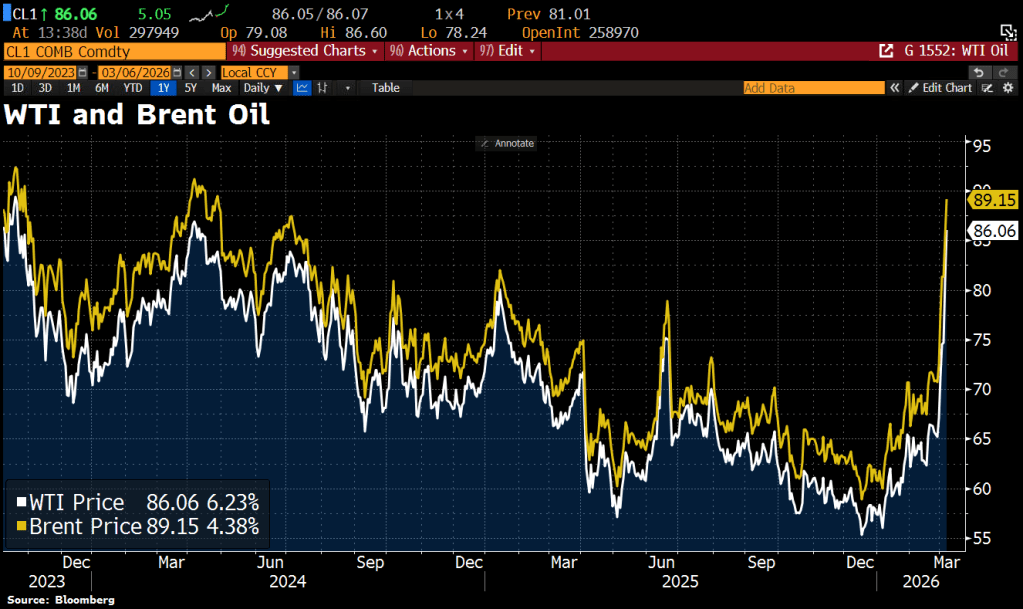
Switching to oil, we see the West Texas Intermediate and Brent Oil prices soaring on the attacks on Iran.
The US is the expensive tower of power … but it should be cheap. Getting rid of coal power was idiotic and The Left’s fear of nuclear power is laughable.
Europe’s fertilizer plants, steel mills, and chemical manufacturers were the first to succumb. Massive paper mills, soybean processors, and electronics factories in Asia went dark. Now soaring natural gas and electricity prices are starting to hit the US industrial complex.
On June 22, 600 workers at the second-largest aluminum mill in America, accounting for 20% of US supply, learned they were losing their jobs because the plant can’t afford an electricity tab that’s tripled in a matter of months. Century Aluminum Co. says it’ll idle the Hawesville, Kentucky, mill for as long as a year, taking out the biggest of its three US sites. A shutdown like this can take a month as workers carefully swirl the molten metal into storage so it doesn’t solidify in pipes and vessels and turn the entire facility into a useless brick. Restarting takes another six to nine months. For this reason, owners don’t halt operations unless they’ve exhausted all other options.
At least two steel mills have begun suspending some operations to cut energy costs, according to one industry executive, who asked not to be identified because the information isn’t public. In May, a group of factories across the US Midwest warned federal energy regulators that some were on the verge of closing for the summer or longer because of what they described as “unjust and unreasonable” electricity costs. They asked to be wholly absolved of some power fees—a request that, if granted, would be unprecedented.
Michael Harris, whose firm Unified Energy Services LLC buys fuel for industrial clients, says costs have risen so high that some are having to put millions of dollars of credit on the line to secure power and gas contracts. “That can be devastating for a corporation,’’ he says. “I don’t see any scenario, absent explosions at US LNG facilities’’ that trap supplies at home, in which gas prices are headed lower in the long term.
EIA Average Electricity Cost Cents
EIA cost data chart by Mish
EIA Cost Data January 2021 vs May 2022
Residential: 12.69 to 14.92
Commercial: 10.31 to 12.14
Industrial: 6.39 to 8.35
Transportation: 9.61 to 10.79
All: 10.36 to 12.09
Those prices are through May 2022. Much electrical energy comes from natural gas.
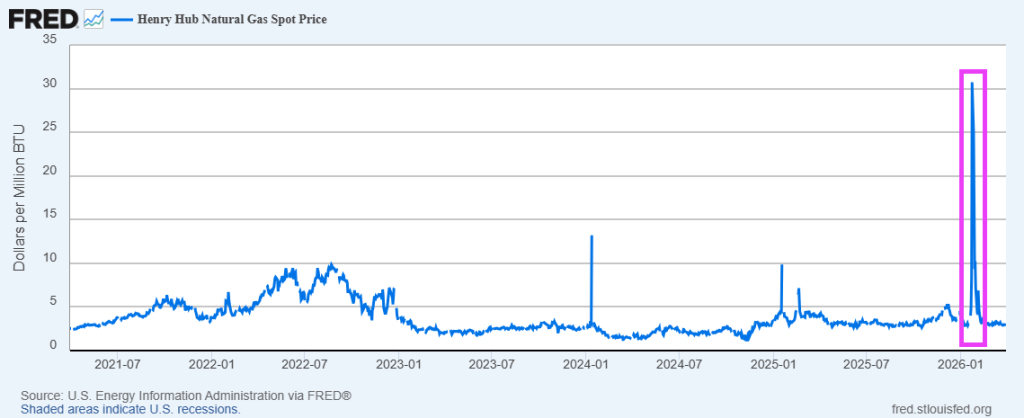
US Natural Gas Futures
US Natural Gas Futures courtesy of Trading Economics
US gas prices fluctuated wildly in June and July. I suspect the average price is 7.33 or so for both months. Things are decidedly worse in Europe.
EU Natural Gas Price
US Natural Gas Futures courtesy of Trading Economics
From 25 or even 50 to 200 is one hell of a leap. It’s somewhere between 300% and 700% depending on your starting point vs 100% or so for the US.
Let’s now check the latest PPI data for a look at where things are and more importantly headed.
PPI Electrical Power Index 2020-Present
PPI data from the BLS, chart by Mish
From pre-pandemic to January of 2021, the PPI electrical power index was flat. It has since surged on a relatively steady pace.
From May to July the index went from 231 to 238. That tacks on another three percentage points since the EIA report.
PPI Electrical Power Index 1991-Present
PPI data from the BLS, chart by Mish
Long Term Trend
The long-term trend does not exactly look pretty.
And as Bloomberg noted, Century Aluminum Co. says it’ll idle the Hawesville, Kentucky, mill for as long as a year, taking out the biggest of its three US sites.
The beer industry uses more than 41 billion aluminum cans annually, according to a Beer Institute letter to the White House dated July 1.
“These tariffs reverberate throughout the supply chain, raising production costs for aluminum end-users and ultimately impacting consumer prices,” according to the letter signed by the CEOs of Anheuser-Busch, Molson Coors, Constellation Brands Inc.’s beer division, and Heineken USA.
This letter to the president comes amid the worst inflation in more than 40 years and just months after aluminum touched a multi-decade high. Prices for the metal have since eased significantly.
Whatever victory beer makers and drinkers may have with aluminum prices may not last with US aluminum plants shutting down.
Then again, the cure for everything is likely to be a huge recession.
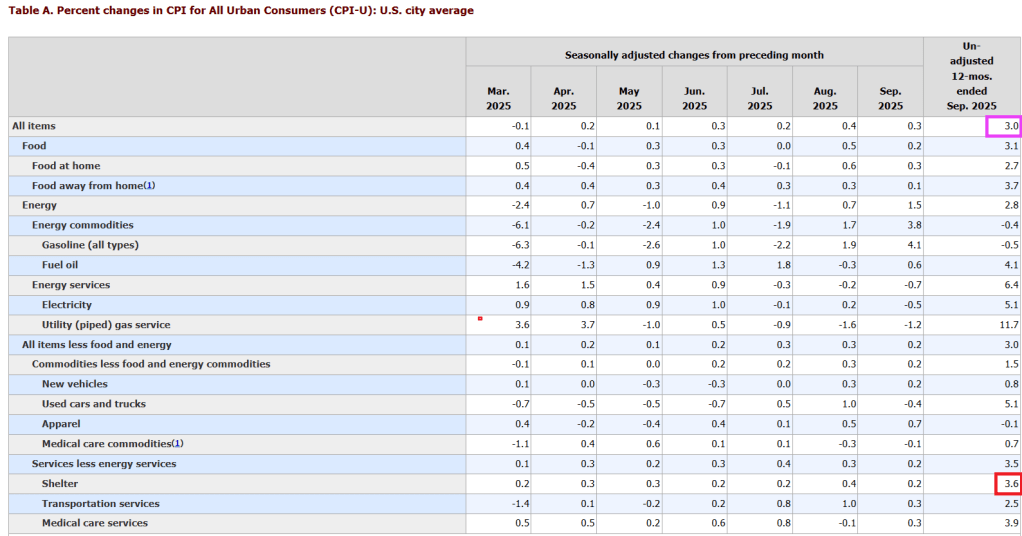
Zero Consumer Inflation
I am pleased to report there was no consumer inflation in July.
The CPI report resulted in a nonsensical Twitter debate on the meaning of zero. For the record, assuming you believe the numbers, there was indeed zero inflation month-over-month.
The accurate rebuttal is: One month? So what?
Moreover, zero is not as good as it looks. All of it was due to a 7.7 percent decline in the price of gasoline. And year-over-year inflation was a hot 8.5 percent.
Meanwhile, rent and food keep rising and the price of rent will be sticky. Gasoline is more dependent on recession and global supply chains.
The above reports and this one industrial costs puts a spotlight on the silliness of the Fed’s focus on consumer inflation as if that’s all that matters.
The Fed has blown three consecutive bubbles trying to produce two percent consumer inflation while openly promoting raging bubbles in assets and missing the boat entirely on industrial matters.
On Tuesday, it was announced that Presidential candidate Kamala Harris would be supporting President Joe Biden’s tax proposals for 2025, which include a 44.6% capital gains rate and a 25% tax on unrealized gains.
Having used up all of the rest of the batshit, insane, counterintuitive economic dirty tricks left in the “we’ll literally do anything but cut spending” bag, the Biden administration began pushing this tax idea in April 2024 when I first wrote about it. Unrealized gains taxation could be the most destructive idea for our country since prohibition, I joked at the time.
As part of its budget proposal for the 2025 fiscal year, the Biden administration was trying to raise an addition $4.3 trillion over 10 years in the worst way possible: imposing a minimum tax equal to 25 percent of a taxpayer’s taxable income and unrealized capital gains less the sum of their regular tax, for taxpayers with wealth over $100 million.
Biden/Harris pushes taxes way beyond the revenue maximing point, down to the point of deminishing revenues and economic growth. Here is the Laffer Curve.
Putting aside the fact that this high-risk idea only amounts to a pittance, $430 billion per year, the introduction of taxing unrealized gains could be one of the worst slippery slopes we ever dare to roll our country’s economy down.
We could save $1 trillion just by not sending $100 billion a year to other nations for starters.
A tax on unrealized capital gains means that individuals are penalized for owning appreciating assets, regardless of whether they have realized any actual income from selling them.
If you purchased a stock for $100 this year, for example, and it increased to $110 next year, you would pay the assigned tax rate on the $10 capital gain. You didn’t sell the asset, so you don’t realize the $10 appreciation, but must pay the tax regardless.
Taxing unrealized capital gains contradicts the basic principles of fairness and property rights essential for a free and prosperous society. Taxation, if we’re going to have it on income, should be based on actual income earned, not on paper gains that may never materialize.
mplementing such a tax not only deeply infringes upon personal liberty and private property rights — but I can’t help but think about how it also sets a destructive wrecking ball rolling down a slippery slope for the first time in our nation’s history.
And, given the precarious state of our nation’s finances, it doesn’t seem like the best time to start spitballing about new risky ideas that may or may not catch on only because they sound like they are addressing the problem of a widening wealth gap that Federal Reserve policies created and continue to exacerbate to begin with.
If the administration really wanted to address the problem of wealth inequality, it would be setting its sights on the central bank that sacrificed price stability so it could spray trillions of dollars in “stimulus” toward financial assets, while cutting American families paltry checks of just $600, during COVID. When I did the math during COVID, the total amount spent to bail out the country.
Why do we trust any Democrat politiician? I certainly don’t!
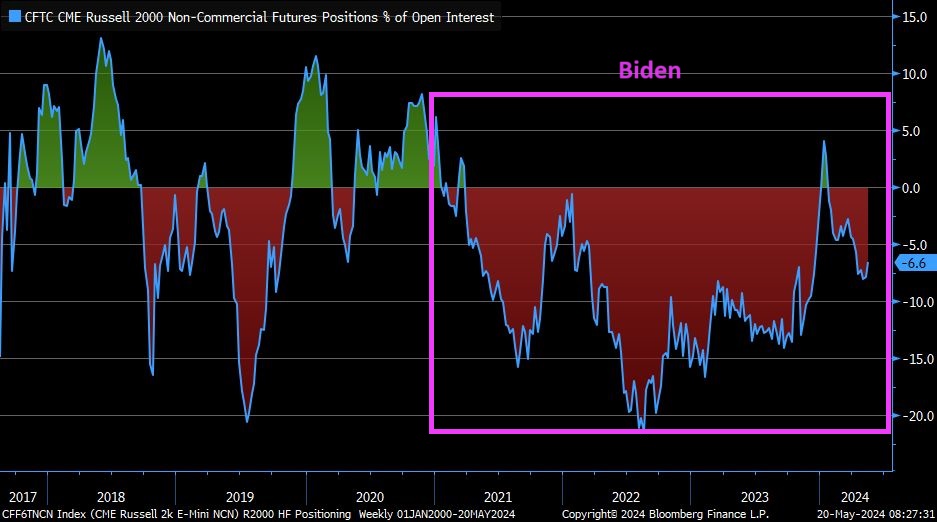
Taxing unrealized gains would risk mass sale of US assets and therRich fleeing.
Here is a chart of Non-commerciak net positions for US Treasuries, currently showing more bailing out of Treasury positions. Has the world sours on DC’s fiscal train wreck and The Fed?
Of course, budget deficits are a disaster with Biden/Congress spending like drunken sailors in port and showing no signs of letting up. The good news? At least a court struck down Biden’s illegal cancelation of student debt (a desperate attempt to win votes). That would have spiked the budget deficit.
As I pointed out yesterday, the UNFUNDED entitlements promised by the Federal government are now larger than that total national assets (business, household). In other words, if the US liquidated ALL assets, they couldn’t pay off the UNFUNDED entitlements. And good luck taking away the entitlements!
I learn something new everyday. Like Biden yesterday claimed has was VP during Covid (uhm, Covid was in 2020 and Biden left the office of VP in 2017). But nothing gets in the way of Biden and a good story! Like his whopper that he inherited 9% inflation from Trump (even CNN fact-checked this whopper and found it was false. It was only 1.4%!)
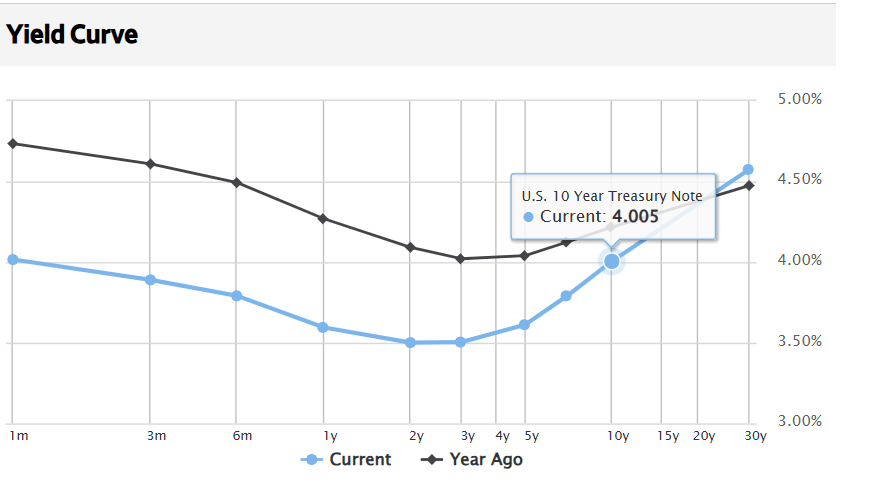
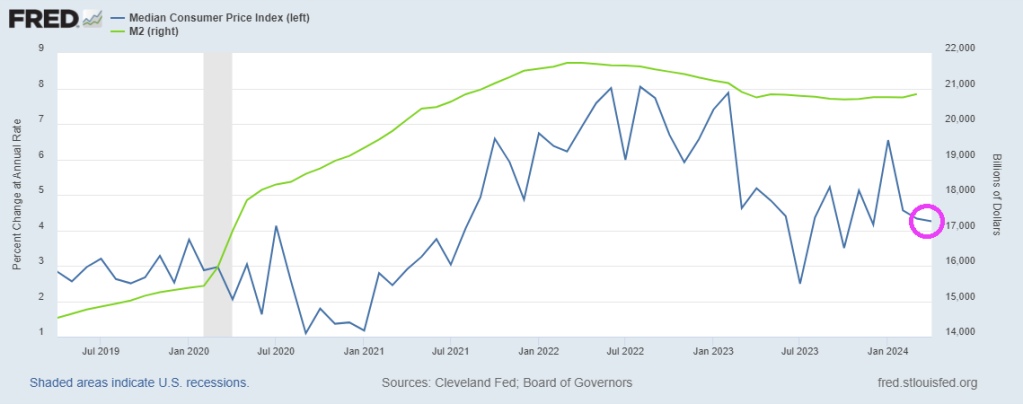
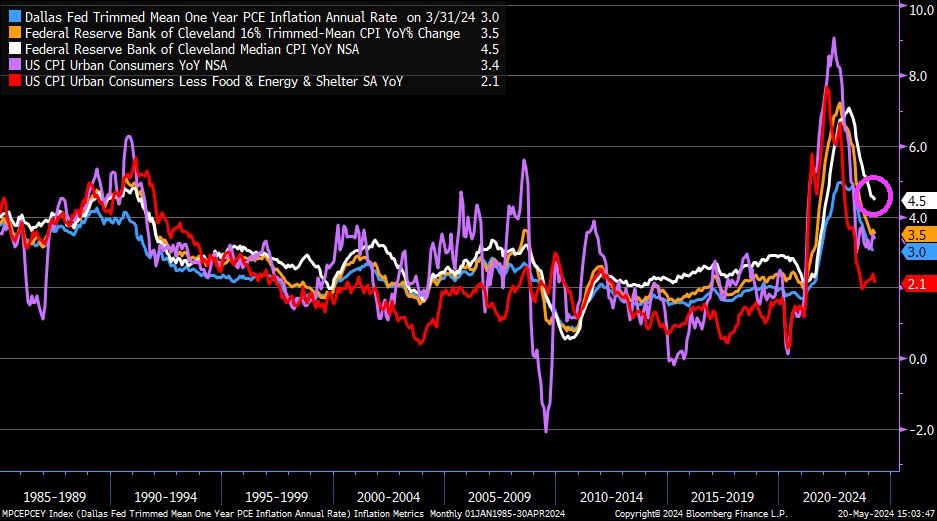
But inflation is still at 4.5%, according to the Cleveland Federal Reserve.
Now, there are many measures of inflation to choose from, from Core CPI of 2.1% YoY to Cleveland Fed’s Median CPI of 4.5%.
Mortgage applications increased 0.5 percent from one week earlier, according to data from the Mortgage Bankers Association’s (MBA) Weekly Mortgage Applications Survey for the week ending May 10, 2024.
The Market Composite Index, a measure of mortgage loan application volume, increased 0.5 percent on a seasonally adjusted basis from one week earlier. On an unadjusted basis, the Index increased 0.3 percent compared with the previous week. The seasonally adjusted Purchase Index decreased 2 percent from one week earlier. The unadjusted Purchase Index decreased 2 percent compared with the previous week and was 14 percent lower than the same week one year ago.
The Refinance Index increased 5 percent from the previous week and was 7 percent higher than the same week one year ago.
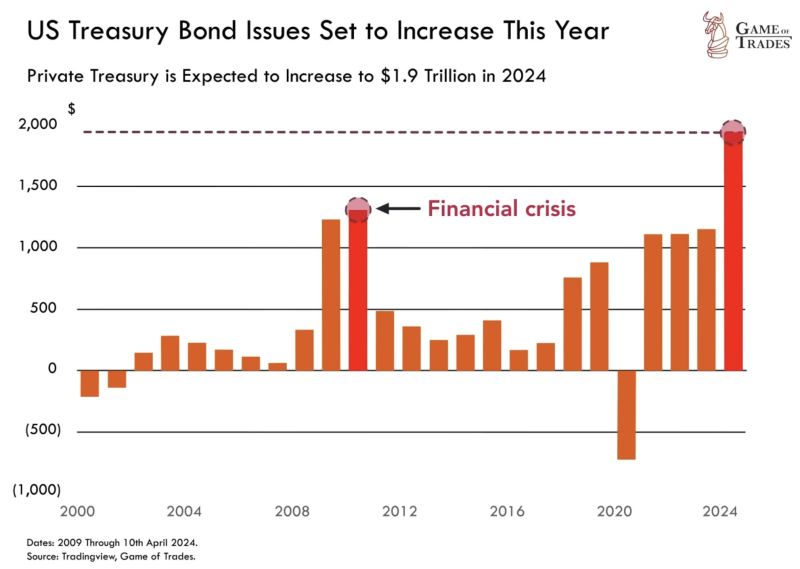
Joe Biden could barely eat his dinner at the White House Correspondents’ Dinner. And we think he is calling the shots in The White House?? Oh well. Perhaps it is Treasury Secretary Janet Yellen or Klaus Schwab of the World Economic Forum.
In any case, Treasury bond issuance in 2024 is expected to hit $1.9 TRILLION. Surpassing levels seen even during the 2008 financial crisis.
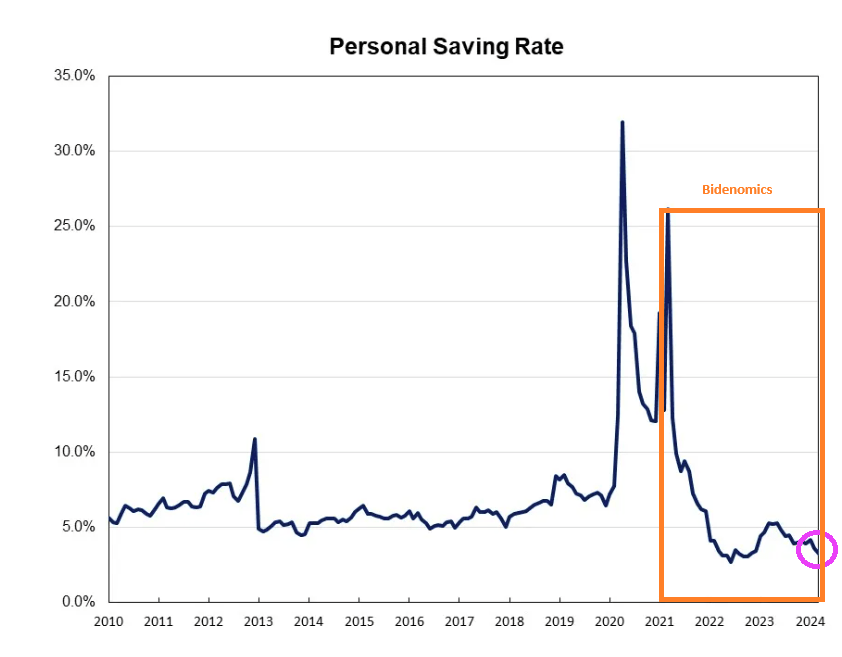
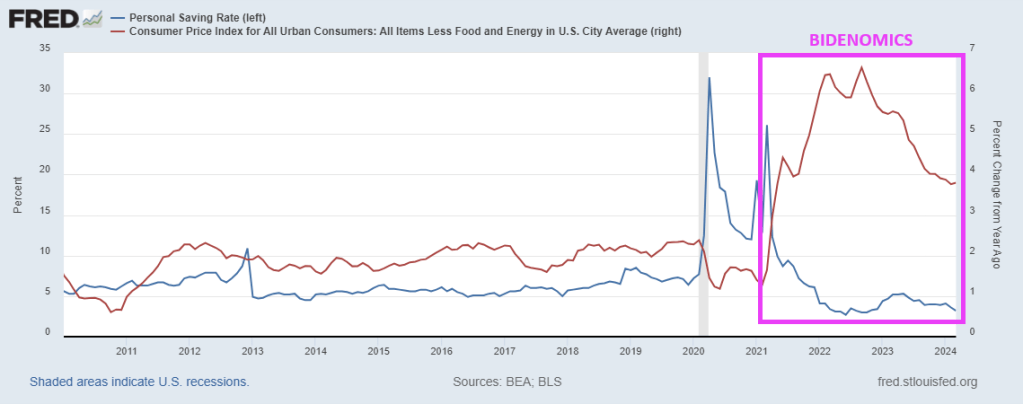
And with inflation, the US personal saving rate is near the lowest level since Obama (2010).
And with the core inflation rate still higher than anytime since 2010, households are paying more for … everything depleting their savings.
With Biden and Congress spending like drunken sailors on shore leave, and no end in sight, this will eventually explode. Ukraine, foreign aid, no border security, virtually no money for Maui fire, E. Palestine Ohio is still a wreck, etc. They always have money for someone else. And if Trump is elected in November, watch CNN and MSNBC and Biden/Congress blame Trump.
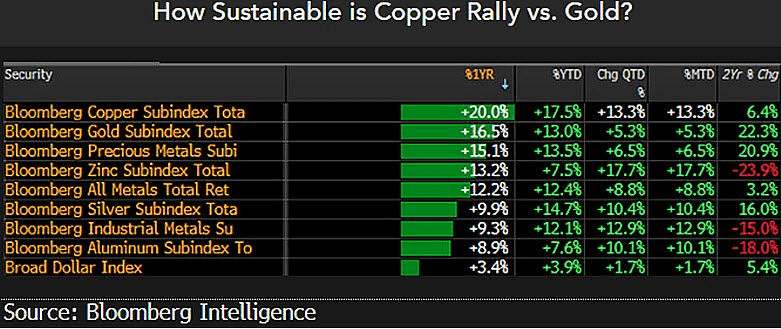
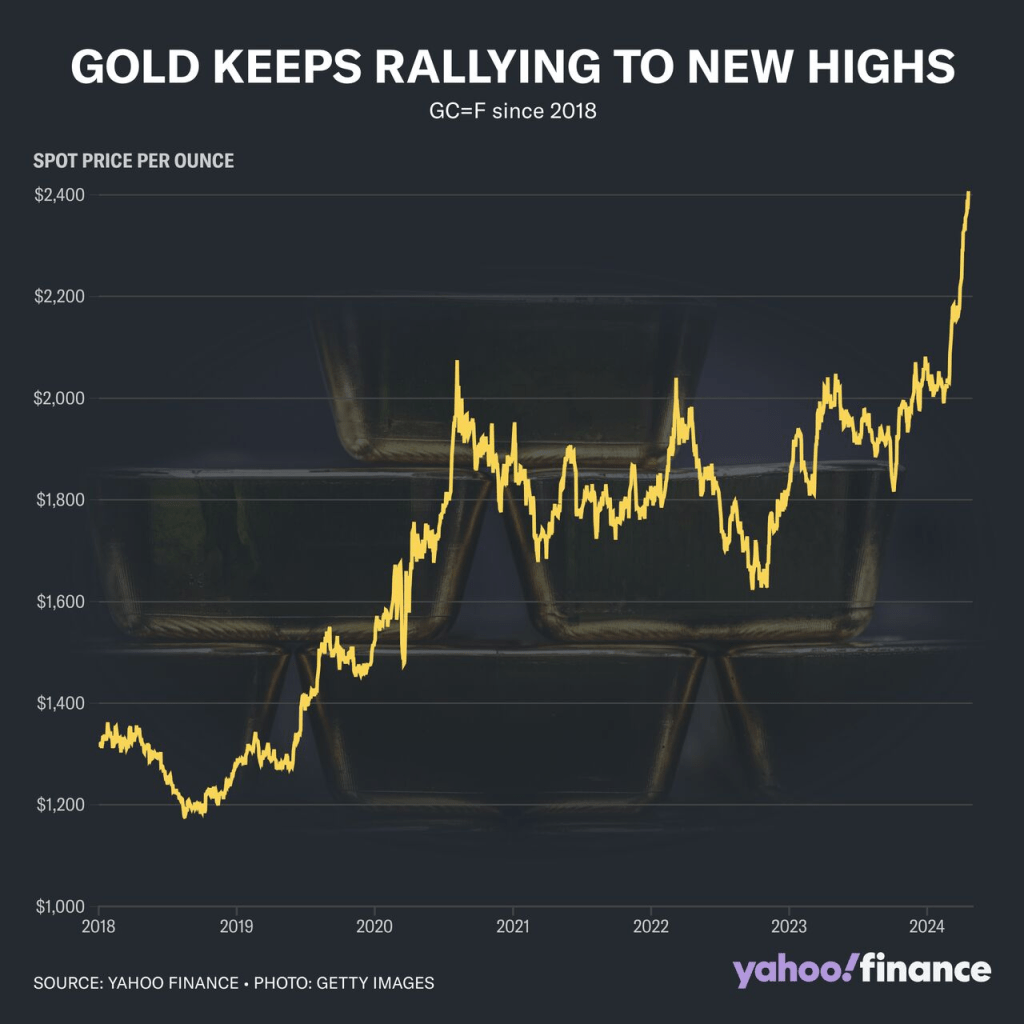
Commodities are a way to protect yourself against the government and their insane spending and debt.
My point? Gold keeps rising!
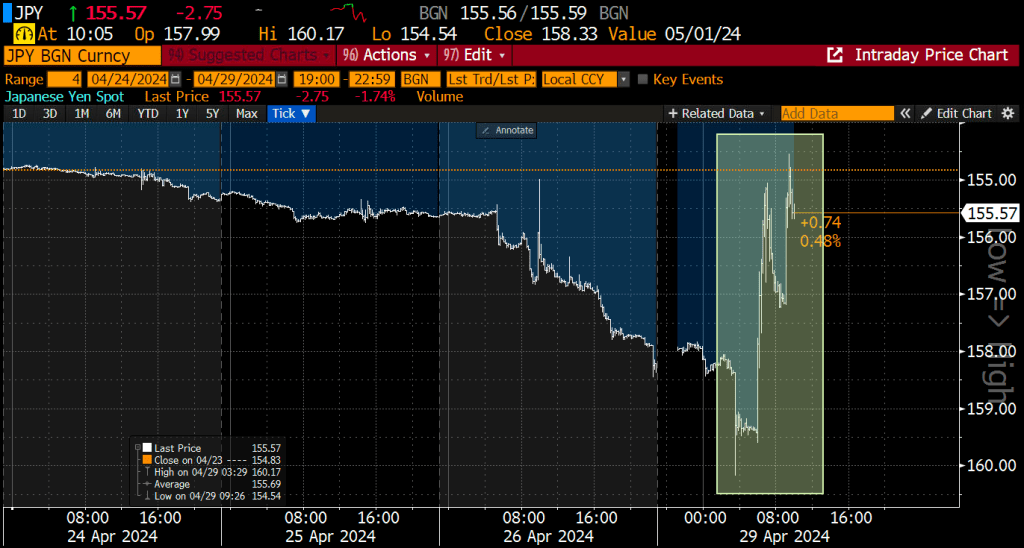
The leading foreign holder of US debt is Japan, which is following the insane path as the US and resembles a banana republic.
Former Fed chair under Obama and current Treasury Secretary Janet Yellen under Biden is Doctor Wonderful. NOT!!
I don’t know what Biden thinks is so funny. Maybe it is because House “Majority” Leader Mike Johnson (RINO-LA) gave Biden and Schumer everything they wanted (Ukraine, Israel funding but nada for security our borders). Life is good when you are stupid and mean-spiritied like Joe Biden!
Biden is so vain: capped teeth, hair plugs, constant tan, face lifts, etc.


You must be logged in to post a comment.