The National Association of Home Builders Market Index slipped into darkness … that is, dropped below 50 to 49 in August as The Federal Reserve continues to tighten its uber-loose monetary policy, resulting in rising mortgage rates.
Note the plunge in the NAHB market index as mortgage rates began rising.
The 2020 Covid outbreak led to a massive (and generally awful) reaction. There were economic shutdowns that caused extensive damage (particularly to small firms), but it was the massive overreaction by The Federal government in terms of Covid relief and The Federal Reserve’s expansion of the money supply that caused considerable damage.
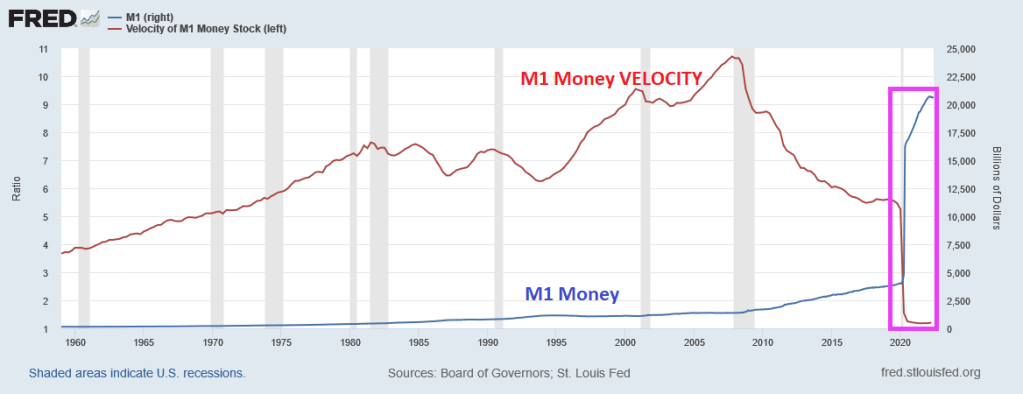
One truly horrific chart is that of M1 Money and M1 Money Velocity (M1/GDP). M1 Money surged with Covid driving M1 Money Velocity down to levels never seem before.
The broader measure of money, M2, isn’t as dramatic, but we also see that M2 Money VELOCITY has plunged to levels never seen before.
What does low money velocity indicate? Simply put, The Fed is printing trillions of dollars, but GDP isn’t moving much. But that won’t stop Congress from spending (and using The Fed to buy its debt).
So, here we sit. This morning, the US Treasury yield curve (10Y-2Y) remains inverted. This AM, the curve inverted another -.591 basis points to -42.725, a sign of impending recession.
Yes, we are living through Jay Powell’s famous chili episode where money velocity is near historic lows and we have an inverted yield curve.
BTW, congratulations to Will Zalatoris (aka, Happy Gilmore’s caddy) for his first PGA Tour victory at the FedEx St. Jude Championship!
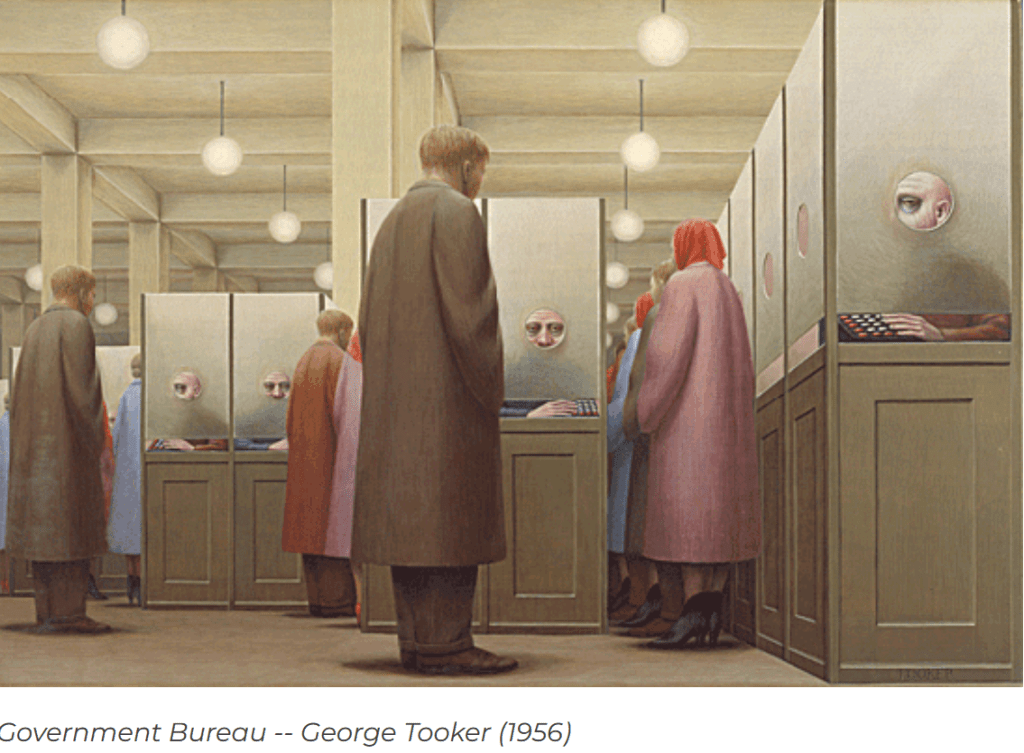
Only in today’s Kafkaesque (having a nightmarishly complex, bizarre, or illogical quality) Federal government would Biden, Schumer and Pelosi cheer about passing a bill hilariously called “The Inflation Reduction Act” that not only will NOT reduce inflation, but also raises taxes on most Americans.
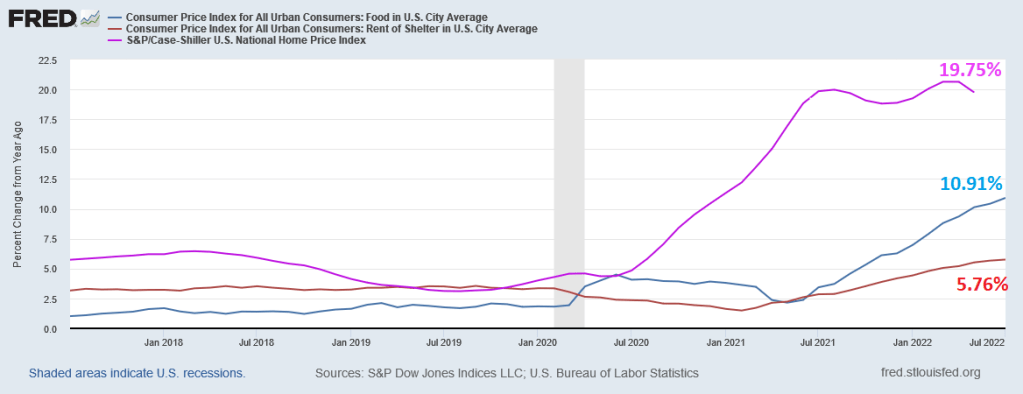
In terms of the inflation tax on the middle class and low-wage workers, we see that FOOD inflation was 10.91% YoY in July and the BLS’s low-ball estimate of “rent” at 5.76% YoY. Odd, since home price growth is 19.75% YoY.
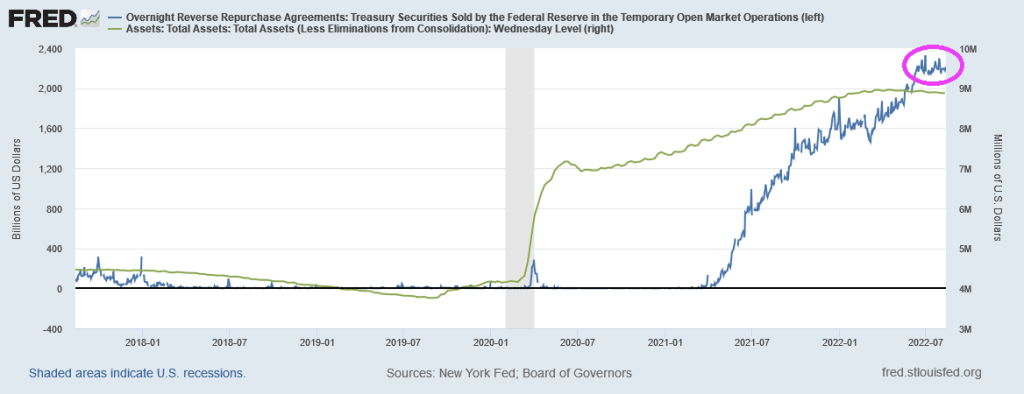
The Fed’s monstrous balance sheet is still near $9 TRILLION (over stimulus) and The Fed’s Overnight Repo Facility remains near $2 TRILLION.
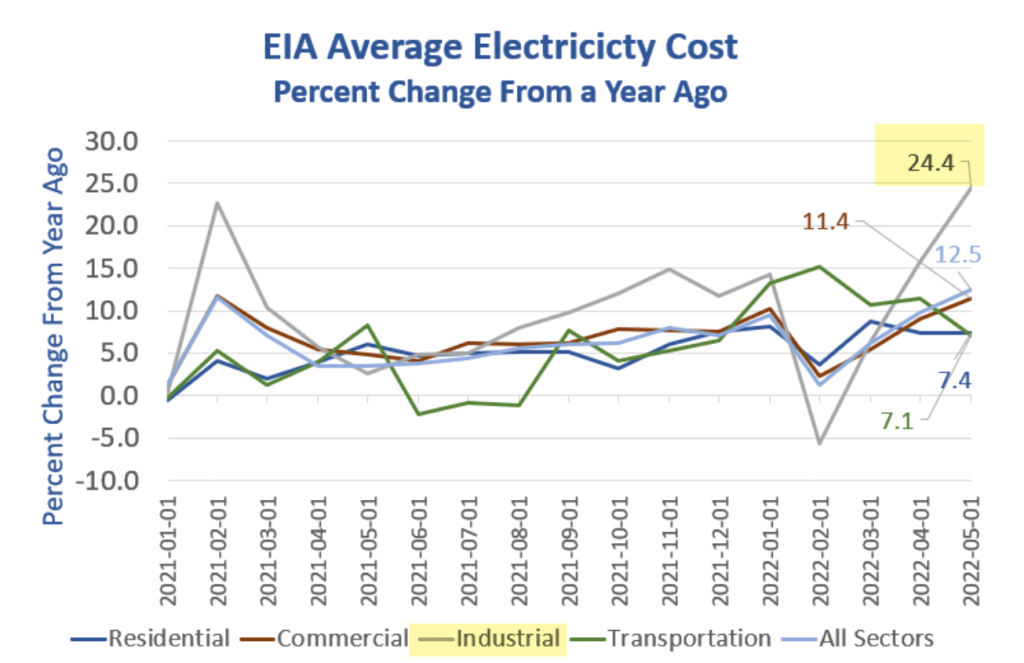
Industrial electricity costs (to be passed on to consumers in the form of higher prices) is up 24.4% YoY. Residential electricity cost is up “only” 7.4% YoY. (Source: Mish GEA)
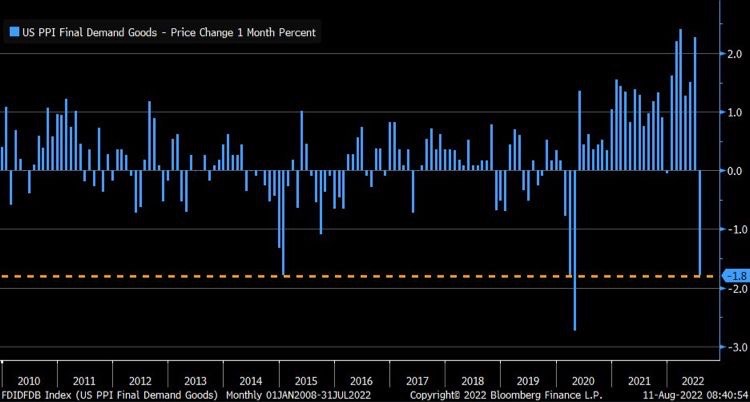
Somehow I doubt if Biden, Harris and Jean-Pierre (Biden’s Press Secretary) will go on the talk show circuit talking about the Producer Price Index Final Demand at 9.8% YoY, meaning that inflation is still raging.
But the curious thing about the PPI Final Demand numbers. While lower than June’s reading of 11.3% YoY, it also coincides with declining gasoline prices and declining growth in M2 Money stock. Which is still growing at 5.9% YoY. The probability of recession is rising (even though technically the US is in recession after 2 consecutive quarters of negative GDP growth.
Here is the more striking chart.
So is the US “improving” on prices because of brilliant Biden strategies (I just laughed at my own “bon mot”)? Or are prices (PPI, gasoline) slowing because of declining demand as the US slips into recession?
Lawrence Summers was once again in the news saying that the way to cool inflation is to raises taxes (and cool demand). Only a true Statist would say something like that. Larry, how about Biden and Congress stop spending so much money that is helping to fuel inflation?
One Washington DC types would rest their hopes on cooling inflation by having the US slip into recession AND raises taxes.
Agency mortgage-backed securities (MBS) prices started to degrade as The Federal Reserve started to try to combat inflation caused by Biden’s energy policies and rampant Federal spending. That is, under June when the implied Fed O/N rate (red line) cooled and the 30-year mortgage rate (blue line) has come down a little.
In terms of duration risk, the FNCL 3% MBS duration has risen with anticipated Fed tightening.
So, further Fed tightening will result in greater MBS losses AND rising duration risk.
The US July inflation report remains hot, hot, hot! While mortgage purchase and refinancing applications are not, not, not.
The US consumer price index rose 8.5% in July. And real average weekly growth remains burned by horrid inflation, at -3.6% YoY.
Source of inflation?
Headline inflation above estimates in 14 of last 16 months.
Data from the Mortgage Bankers Association’s (MBA) Weekly Mortgage Applications Survey for the week ending August 5, 2022 revealed that … the Refinance Index increased 4 percent from the previous week and was 82 percent lower than the same week one year ago. The seasonally adjusted Purchase Index decreased 1 percent from one week earlier. The unadjusted Purchase Index decreased 2 percent compared with the previous week and was 19 percent lower than the same week one year ago.
We are seeing a slowing of the US economy. For example, the JOLTs (job openings) numbers are out for June and they are down -5.5% from May. And from April to May, JOLTs declined -3.2% MoM. That is a clear slowing trend.
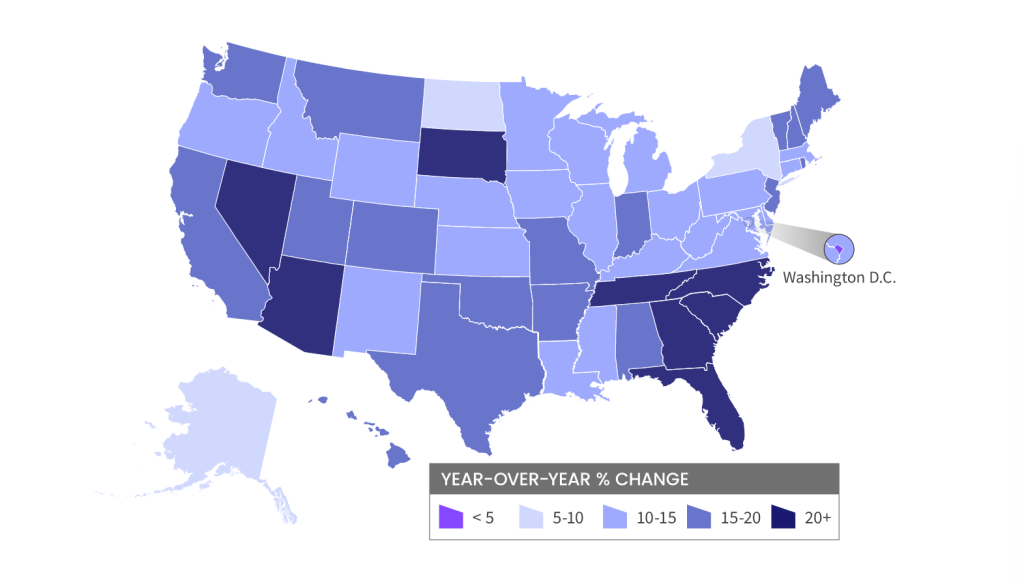
And on the housing front, the CoreLogic HPI Forecast indicates that home prices will increase on a month-over-month basis by 0.6% from June 2022 to July 2022 and on a year-over-year basis by 4.3% from June 2022 to June 2023. But rose +18.3% YoY in June. Also a clear cooling trend.
And its “Escape From Blue States” (perhaps a new Kurt Russell movie), with home prices rising fastest in red states (primarily The South). And contiguous migration from California to Nevada and Arizona.
The Fed Funds Futures market is pricing in rate hikes until the March 2023 FOMC meetings. After all, Prince Imhotep (aka, Minneapolis Fed’s Neel Kashkari) is screaming for more rate hikes to fight inflation … caused by 1) loose monetary policies since late 2008 and 2) insane Federal government spending.
Let’s see if “Mr. Freeze” (aka, Jerome Powell) relents on Fed rate increases before the March 2023 FOMC meeting.
The US is short on supply of housing for a myriad of reasons (high costs, Not-in-my-backyard (NIMBY) local zoning laws, etc), but The Fed’s cranking up interest rates isn’t helping.
US housing starts, a measure of supply, declined -6.3% YoY in June as The Fed cranked up rates.
1-unit (aka, single family detached) starts dropped -8.05% MoM in June while 5+ unit (aka, multifamily) starts rose 15% MoM.
1-unit permits dropped -8% MoM in June while 5+ unit starts were up 13% MoM.
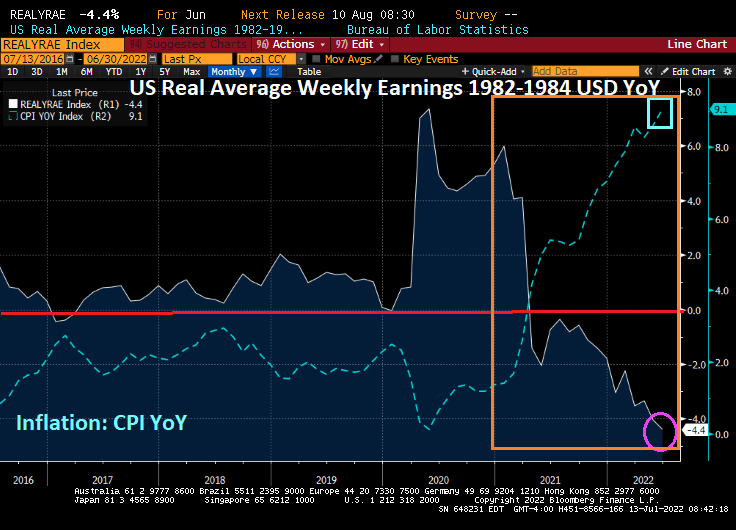
The reason? REAL weekly earnings growth declined -4.4% YoY in June thanks to Bidenflation.


You must be logged in to post a comment.