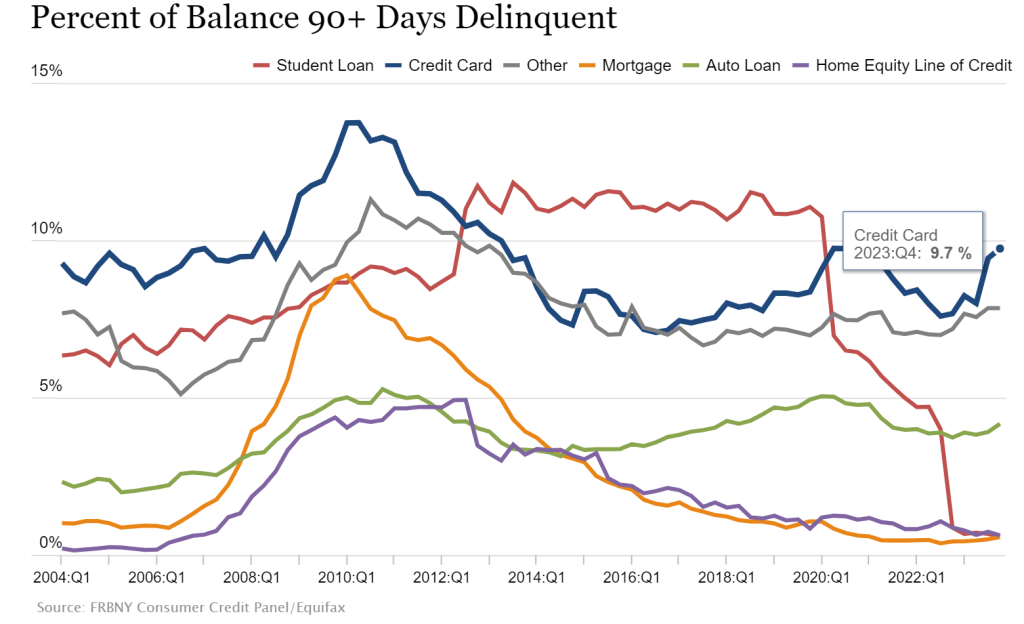
Credit card delinquecies (90+ days) rose to almost 10% in Q4 2023.
Credit card delinquencies surged more than 50% in 2023 as total consumer debt swelled to $17.5 trillion, the New York Federal Reserve reported Tuesday.
Debt that has transitioned into “serious delinquency,” or 90 days or more past due, increased across multiple categories during the year, but none more so than credit cards.
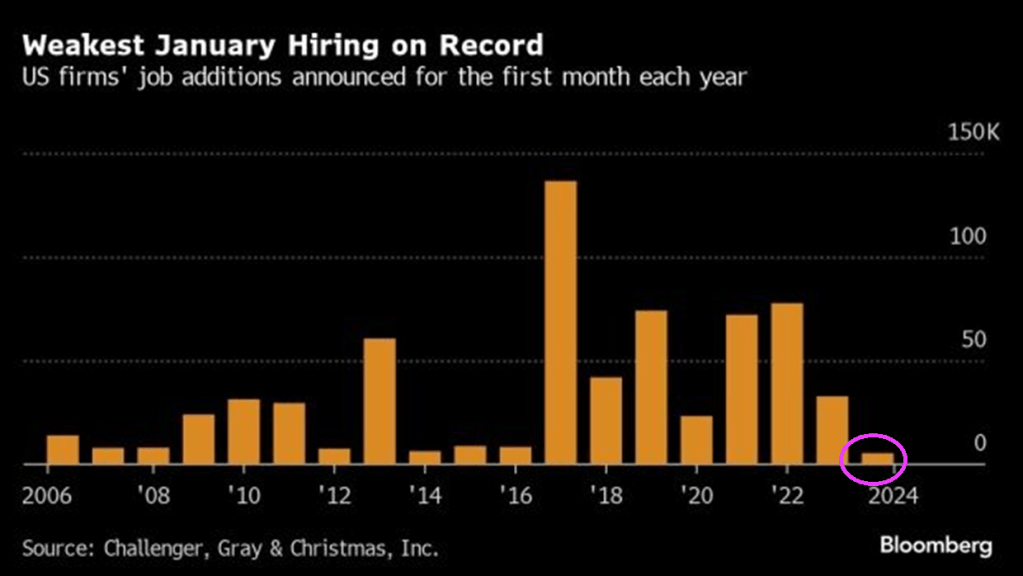
Rising credit card delinquencies combined with the worst job additions in January on record.
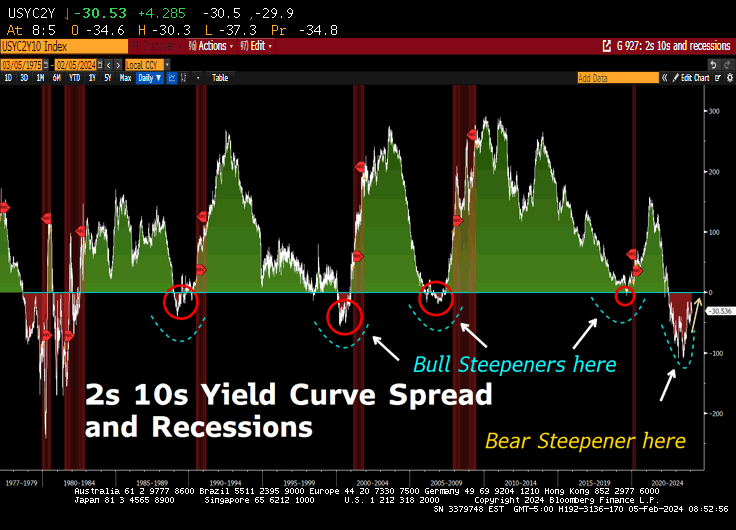
But at least the 10Y-2Y US Treasury yield curve is ALMOST flat (h
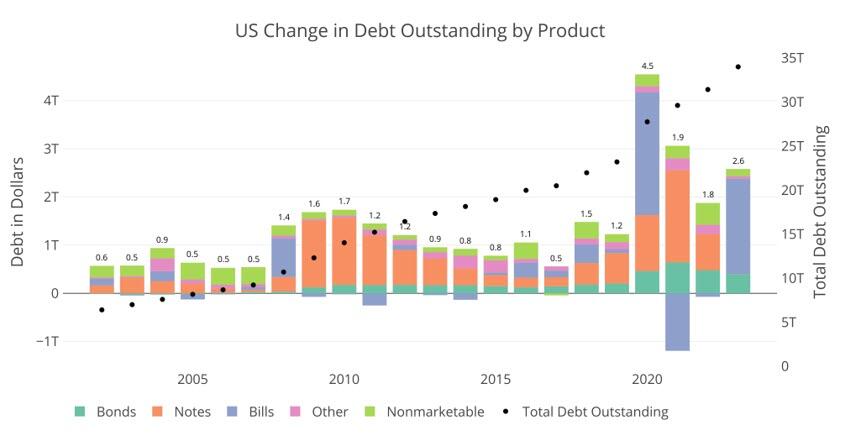
The only other times Bills were used as a primary funding source was in 2008 during the Great Financial Crisis and 2020 during Covid. Neither year came close to 77% of total new debt issuance. These were also emergency times, and specifically in 2021, almost half the short-term debt was retired in favor of Notes and Bonds to undo the 2020 Bill issuance.
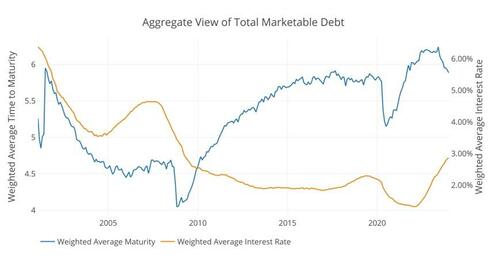
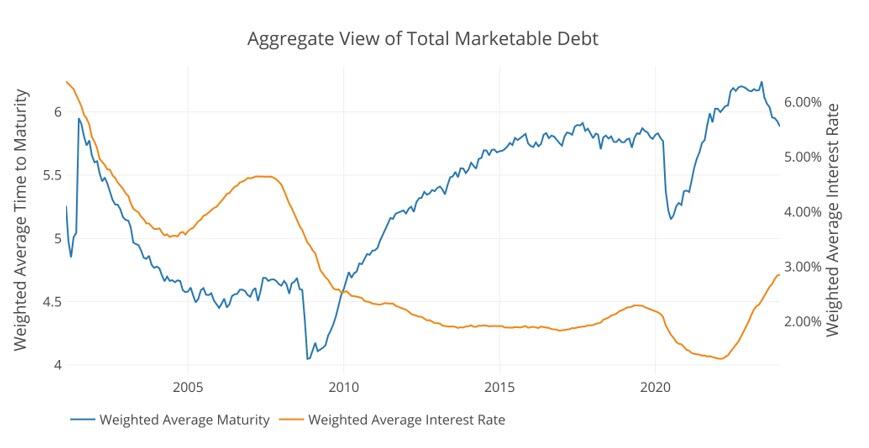
The Treasury has spent nearly two decades trying to extend the maturity of the debt. This can be seen in the blue line below that shows the average debt maturity. When the short term debt is issued in such a way, it drives down the average maturity, which causes the Treasury to have to roll-over more debt in shorter time periods. So why has the Treasury all of a sudden gone entirely to short-term debt in non-emergency times? The answer lies in the orange line, so let’s dig in.
Figure: 2 Weighted Averages
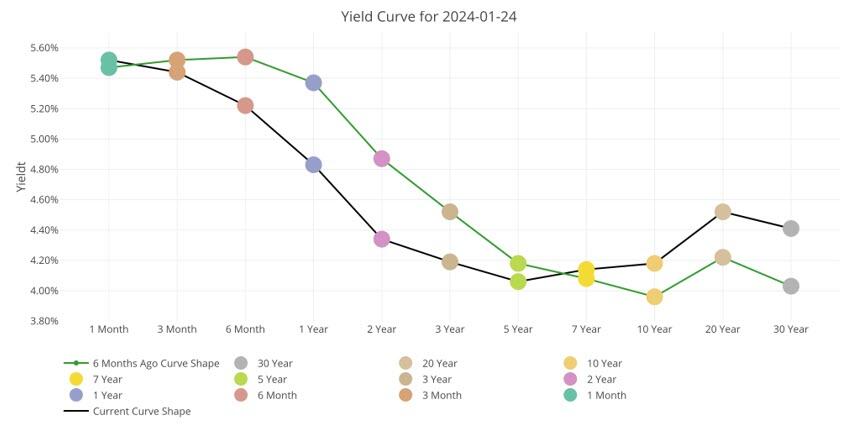
First, it is important to understand the interest rates the Treasury is facing. The chart below shows the current yield curve as it stands today and 6 months ago. As you can see, short-term rates are a full 1%-1.5% higher than medium-term. What?!? Didn’t we just see that the Treasury has specifically targeted short-term debt?
Why are they paying more than they have to? Had the Treasury financed the $2T with Notes, they would have saved $30B in interest this year alone!
Figure: 3 Tracking Yield Curve Inversion
So, why have they done this? Well, there are two potential possibilities.
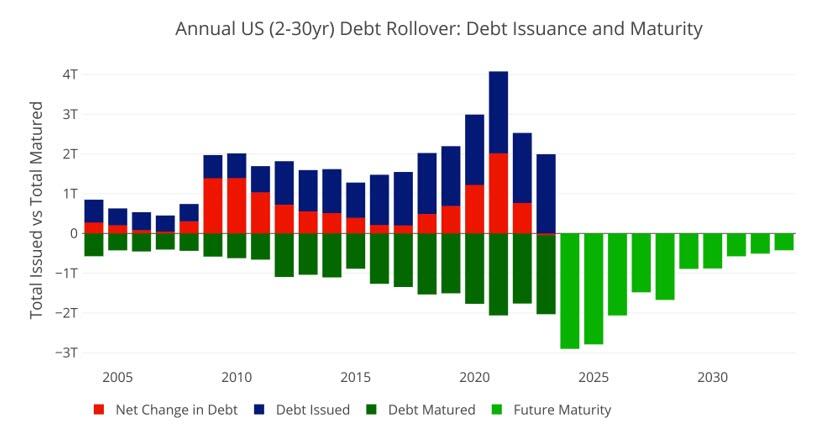
First, they may be nervous about the market’s ability to handle so much medium-term debt. The market typically digests short-term debt very easily, but it can become saturated with medium-term debt. The chart below shows the amount of medium-term debt that rolled over last year. This is not new issuance; this is debt maturing that needs to be rolled over.
As shown, nearly $2T rolled over last year. This means, had the Treasury issued Notes instead of Bills, the Market would have had to absorb a whopping $4T in new medium-term debt like they did in 2020. The difference this year is that back in 2020 the Fed bought nearly all of that debt, putting a floor under the market.
Compounding this problem further is that this year is set to be a record year in terms of debt rollover. Nearly $2.9T in Notes need to be rolled over.
Figure: 4 Treasury Rollover
Still, even with that massive amount of debt issuance, there must be more to the story. Why would Yellen specifically pay $30B more in interest just because she is concerned the about the volume of debt issuance. As Figure 1 above shows, this has never been a concern in the past except in emergency situations. Furthermore, why not issue at least some new debt as medium-term.
This lends to a second, and more probable conclusion. Long-term rates are set to fall in the very near term. The Treasury did not want to lock in for 2-7 years at 4% if it knows rates will fall. It will pay a premium ($30B this year), if it means it can lock in lower rates for longer and save the money on the back end.
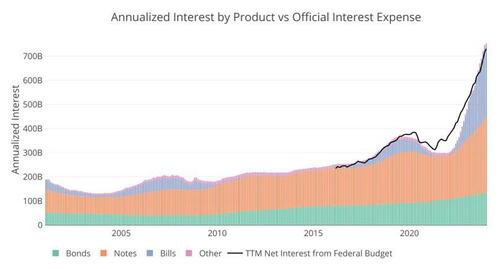
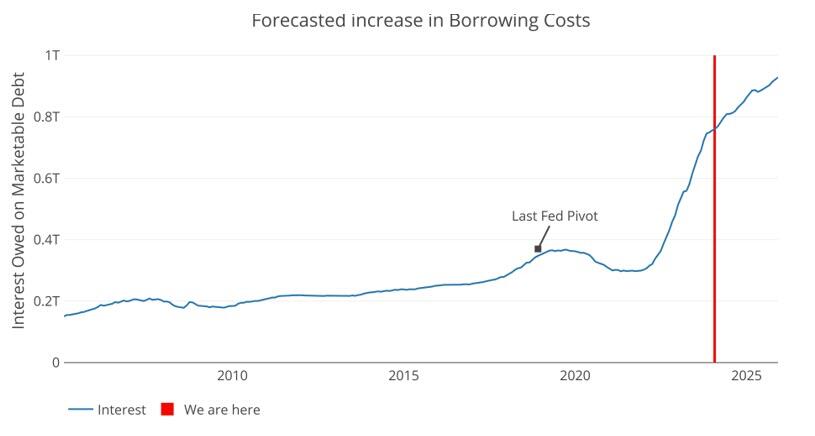
So, why are long-term rates, going to fall? Because they have to… the chart below shows the current interest owed on the national debt annualized. It’s not a pretty picture, and you can see how the interest from Bills has absolutely ballooned.
Figure: 5 Net Interest Expense
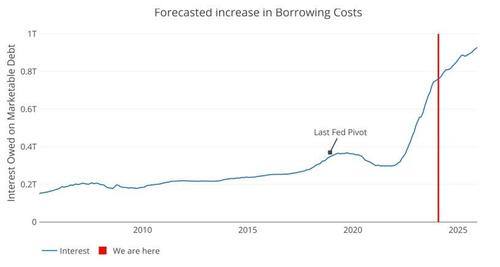
The Fed has come out with their dot plot that shows a calm glide path down. Well, we can take the debt maturity and push it forward at the projected rate of the Fed. Even given the current proposed 6 rate cuts, and getting back to 3.5% by early 2025, the trajectory for interest expense is not looking good.
Given current projections by the Fed, the Treasury will owe over $900B on interest by 2025. That is a debt death spiral. The Fed had to pivot back in 2018 when interest expense neared $400B. Next year, the cost will be more than double that!
Figure: 6 Projected Net Interest Expense
There is a potential third option. It’s an election year. Maybe Yellen is doing everything and anything to keep the financial system running smoothly. She has decided that the Treasury market must remain 100% stable and wants to take no chances. Thus, she issues tons of short-term debt, costing the tax payer an extra $30B this year and decides it’s a problem to be fixed at a later date.
While this would be wildly irresponsible and corrupt, the real argument against possibility 3 is the same as possibility 1, the market should be able to ingest at least some medium-term debt. This means the only logical conclusion is that she knows rates are coming down hard and fast. How does she know? Well, she used to be the head of the Fed.
There is no doubt, everyone in Washington can do the simple math above and recognize the Fed cannot take a glide path down. The only option is for rates to come down. Yellen just bet $2T on that outcome.
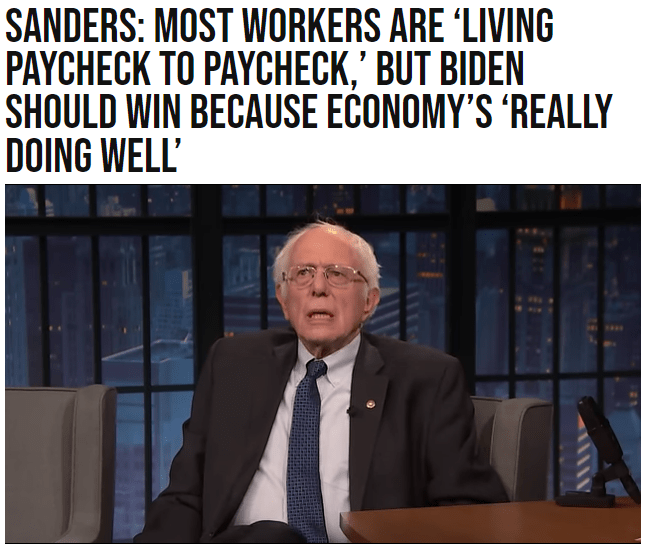
Joe, are you kidding about the sizzling economy? Karine Jean Pierre is also guilty of comedy or gross propaganda.
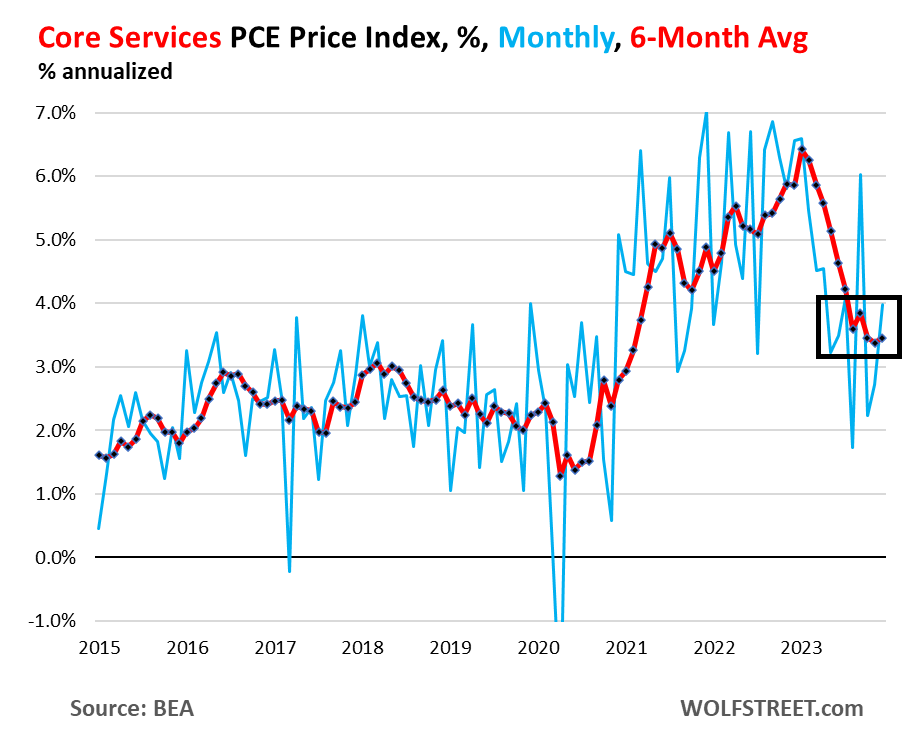
So right up front – and the Fed has been talking about this, though no one listens: The “core services” PCE price index has gotten stuck at 3.5% over the past six months annualized, and accelerated to 4.0% month-to-month annualized in December, with housing inflation stuck at about 6.7% over the past six months annualized, and with other core services components still red-hot.
The core services PCE price index rose by 0.33% in December from November, the second acceleration in a row, according to data from the Bureau of Economic Analysis today. This amounts to an increase of 4.0% annualized (blue).
The six-month moving average, which irons out the huge ups and downs of the month-to-month data, accelerated to 3.5%, and has been in this range since August, after the sharp deceleration in early 2023 (red).
Core services is where consumers spend the majority of their money, and they matter. Which is why Fed governors have said in near unison that they’re in no hurry to cut rates, but have taken a wait-and-see approach, with an eye on core services. And if it goes away, fine.
But on the surface, the PCE price index looks encouraging, and this has been the trend for months, with the overall PCE price index at +2.6% year-over-year in December, the lowest since March 2021; and with the core PCE price index at +2.9% year-over-year, also the lowest since March 2021, and aiming for the Fed’s 2% target.
The factors for the year-over-year cooling in these inflation measures have been the same for months: plunging energy prices, sharply dropping prices of durable goods after the huge spike in 2020 and 2021, cooling food inflation (with prices still rising from very high levels, but slowly), and favorable “base effects” when compared to a year ago.
But energy prices don’t plunge forever, so that will go away; durable goods prices don’t drop sharply forever either, though they can drop for a while longer to unwind some more of the price spike they’d been through in 2020 and 2021; and the base effects are going to get timed out this year, when the base of the year-over-year comparisons become the lower inflation figures of 2023.
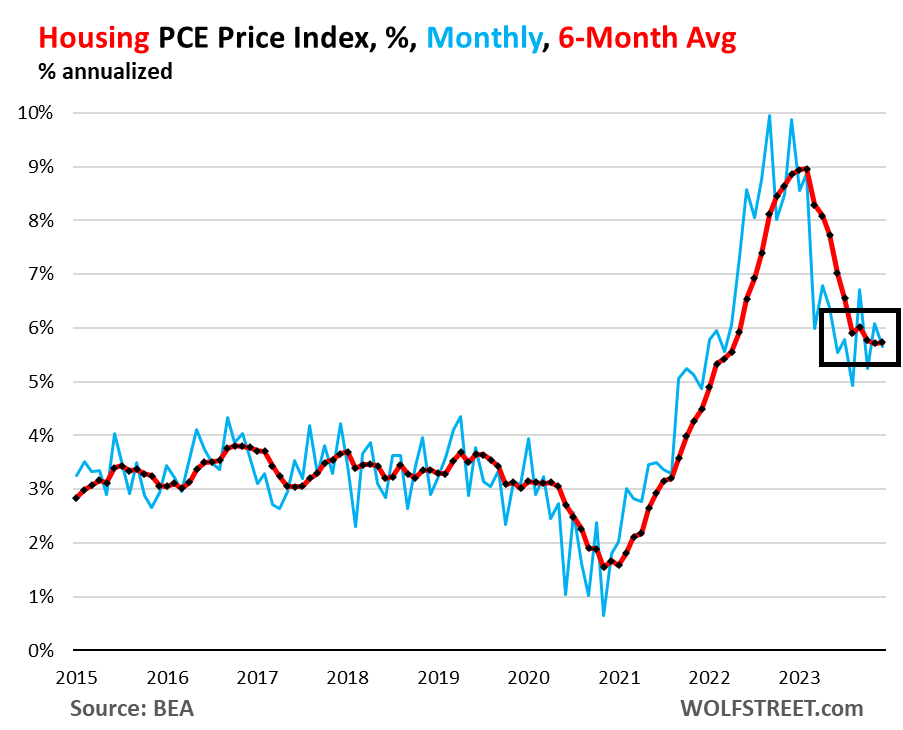
Housing inflation, still red hot and not cooling anymore. The PCE price index for housing rose by 0.46% in December from November and has been in this range since March, after the sharp slowdown early in 2023. This amounts to 5.7% annualized (blue in the chart below).
The housing index is broad-based and includes factors for rent in tenant-occupied dwellings; imputed rent for owner-occupied housing, group housing, and rental value of farm dwellings. It’s the largest component of core services.
The six-month moving average annualized, which shows the more recent trends, also rose by 5.7% in December, and has been in the same range since August (red).
So it looks like the PCE price index for housing has gotten stuck at 5.7%. This stubborn inflation in housing is a blow to theories trotted out for 18 months that housing was lagging, and that we know it will go away as an issue, etc., etc. The increases are less hot than they had been, but remain hot and have become persistent.
The major categories of core services in the PCE price index, as a six-month average of month-to-month changes, annualized:
Core services, major categories, 6-month average, annualized
Housing
5.7%
Description and chart above
Non-energy utilities
2.5%
Water, sewer, trash
Health care
2.5%
Physicians, outpatient, hospital, nursing care, dental, etc.
Transportation services
6.1%
Auto repair & maintenance, auto leasing & rentals, public transportation, airfares, etc.
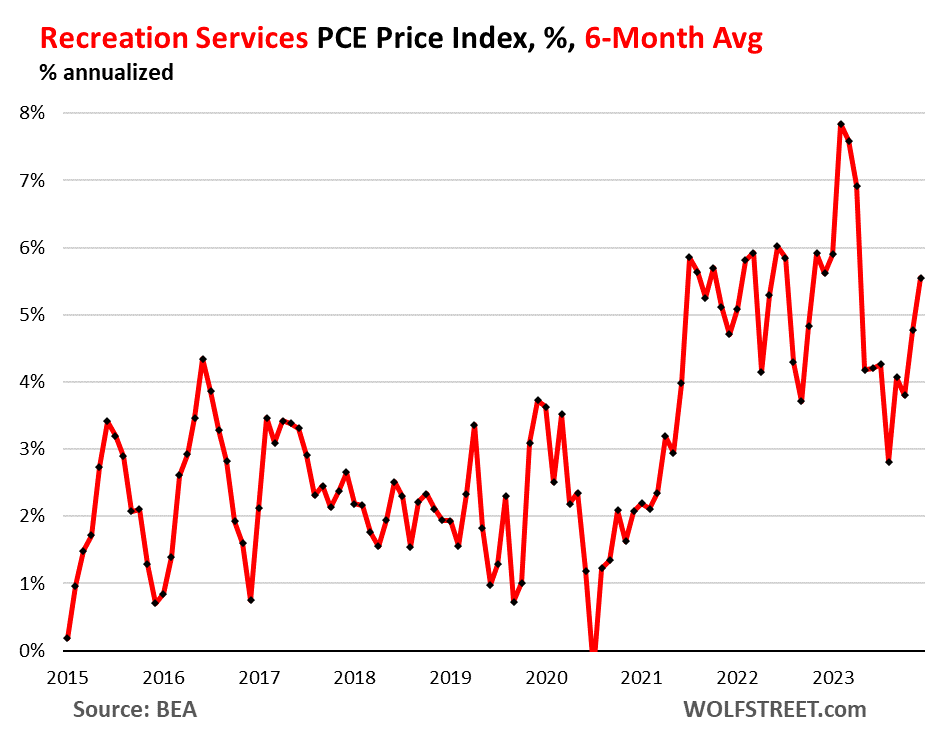
Recreation services
5.6%
Concerts, sports, movies, gambling, streaming, vet services, package tours, etc.
Food services, accommodation
2.8%
Meals & drinks at restaurants, bars, schools, cafeterias, etc.; accommodation at hotels, motels, schools, etc.
Financial services
3.5%
Fees & commissions at banks, brokers, funds, portfolio management, etc.
Insurance
2.8%
Insurance of all kinds, including health insurance
Other services
0.1%
Collection of other services
Inflation in Transportation services and Recreation services is accelerating on the basis of the 6-month moving average, with the PCE price index for Transportation services rising by 6.1%, and the index for Recreation services rising by 5.6%:
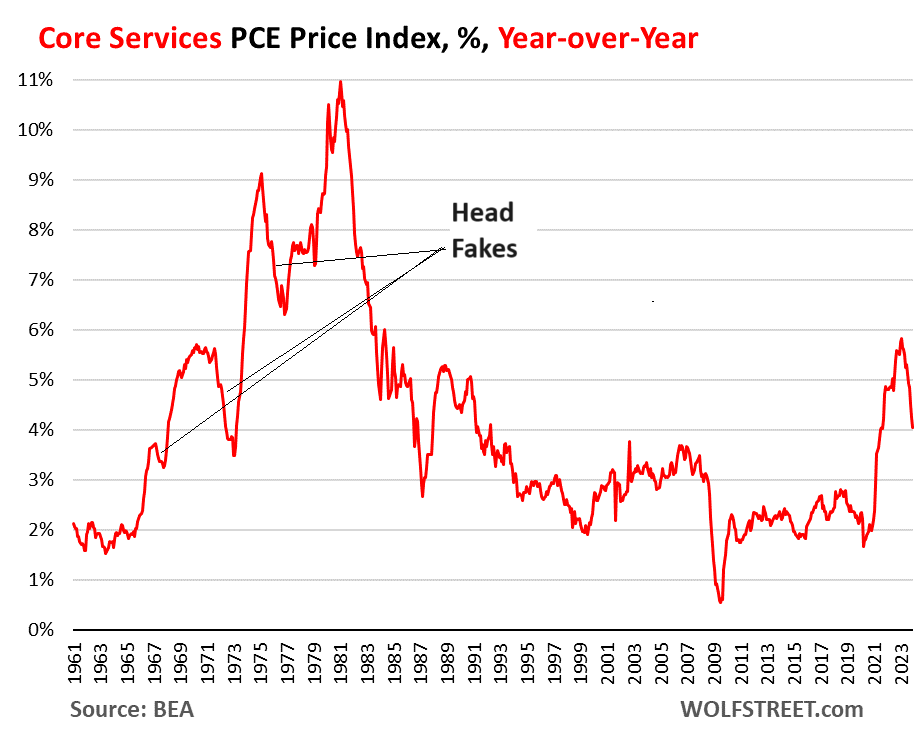
The head-fakes last time.
Inflation in services turns out to be tough to beat, and it can dish up big head-fakes. Last time we had this type of surge of inflation, so that was in the 1970s and 1980s, we thought repeatedly that we had inflation licked, only to find out that we’d fallen for an inflation head-fake. There were three head-fakes in core services on the way to the peak of 11% in 1981:
But Democrats are desperate to stay in power and rake in billons of dollars. Their strategy? Nobody But Joe. Well, except maybe Mike Obama.
Americans are addicted to gov. And government is addicted to spending (and creating more debt).
Let’s look at wage growth for government apparatchiks relative to private sector workers. While wage growth overall was modest, it is government wage growth that is driving it – now at a record high!
Source: Bloomberg
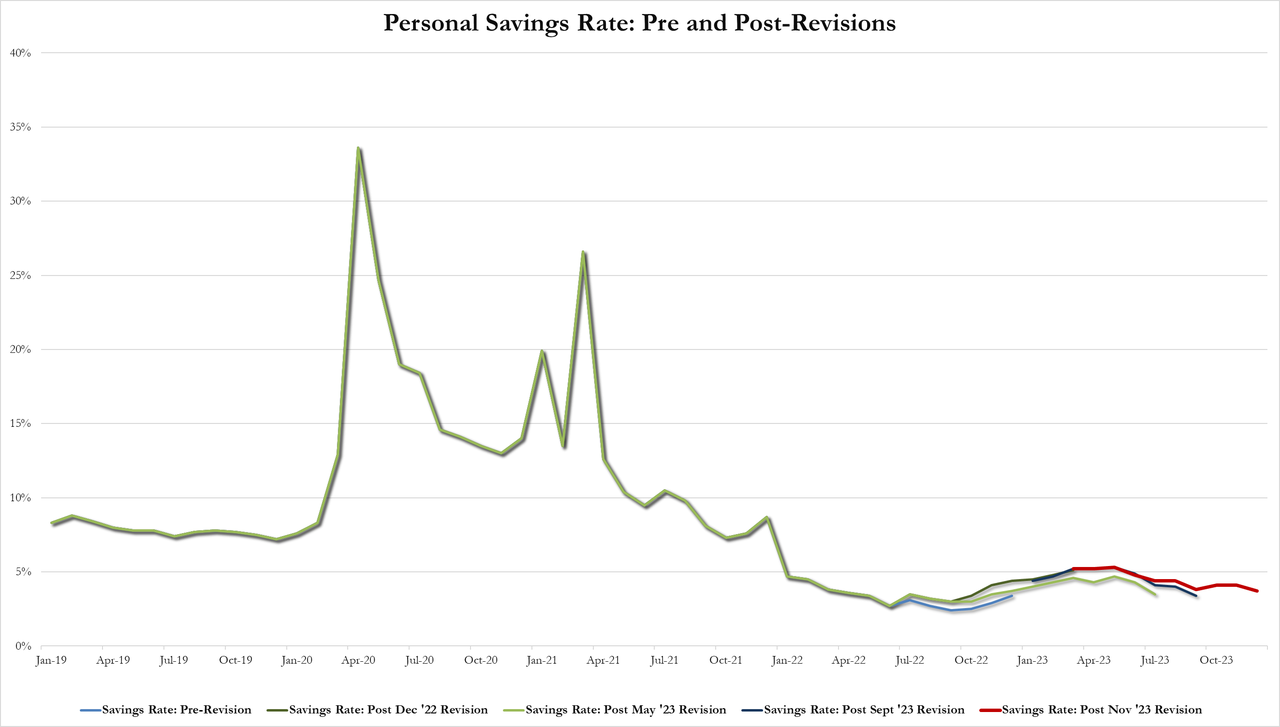
And on the back of that, the savings rate tumbled from 4.1% of DPI to 3.7%…
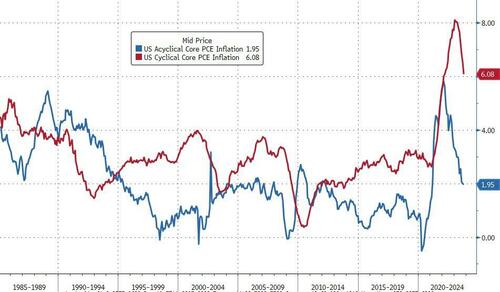
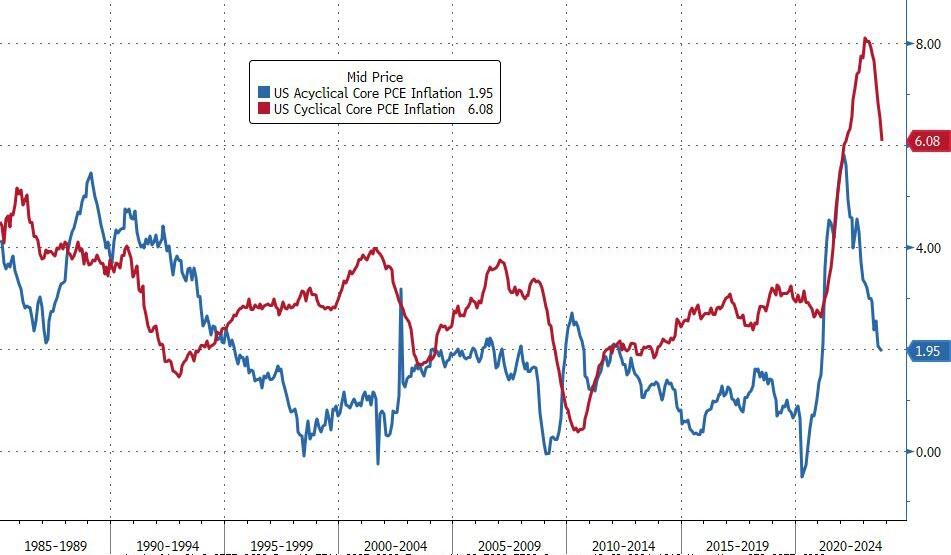
The vast majority of the reduction in inflation has been ‘cyclical’. Acyclical Core PCE inflation remains extremely high, although it has fallen from its highs.
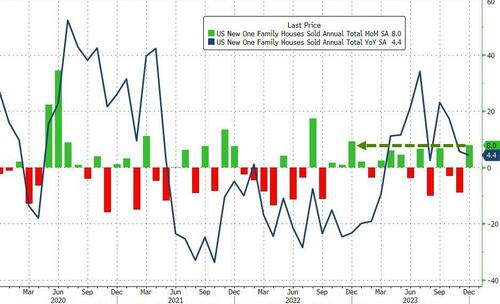
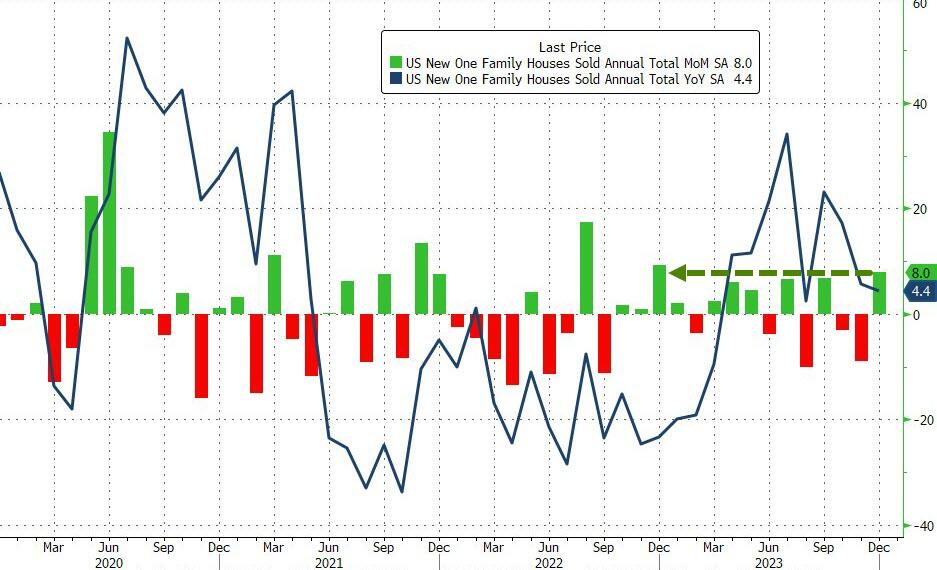
New home sales disappointed in December, rising just 8% MoM (vs 10% exp) but that is still the biggest MoM jump since last December.
Source: Bloomberg
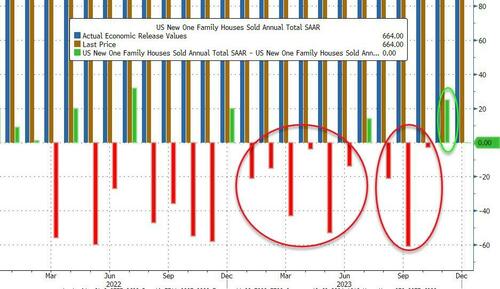
Of course, having pointed out the dramatic series of downward revisions to this data series this year, November’s 12.2% plunge was revised up to a 8.0% drop
Source: Bloomberg
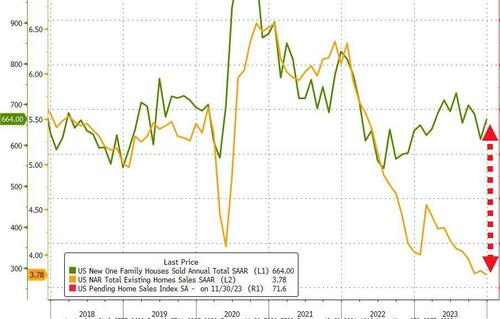
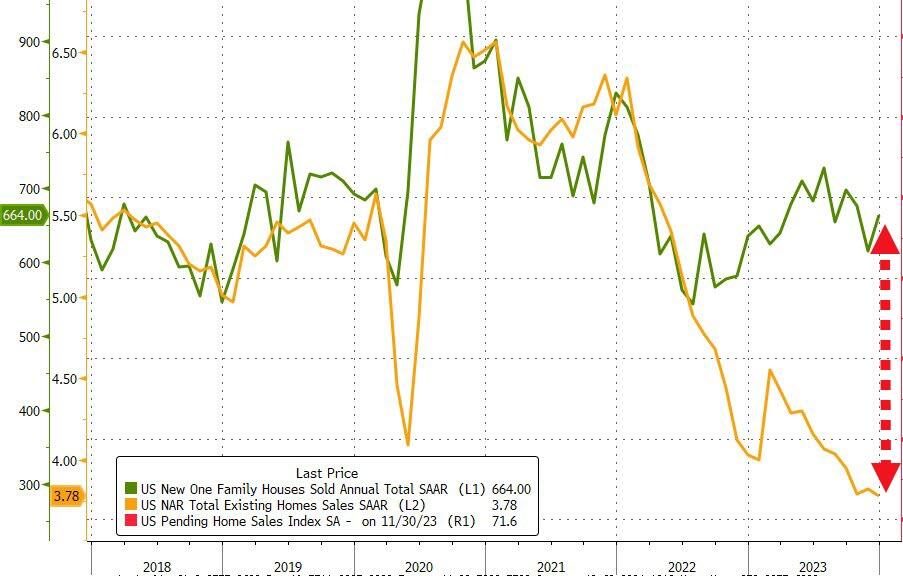
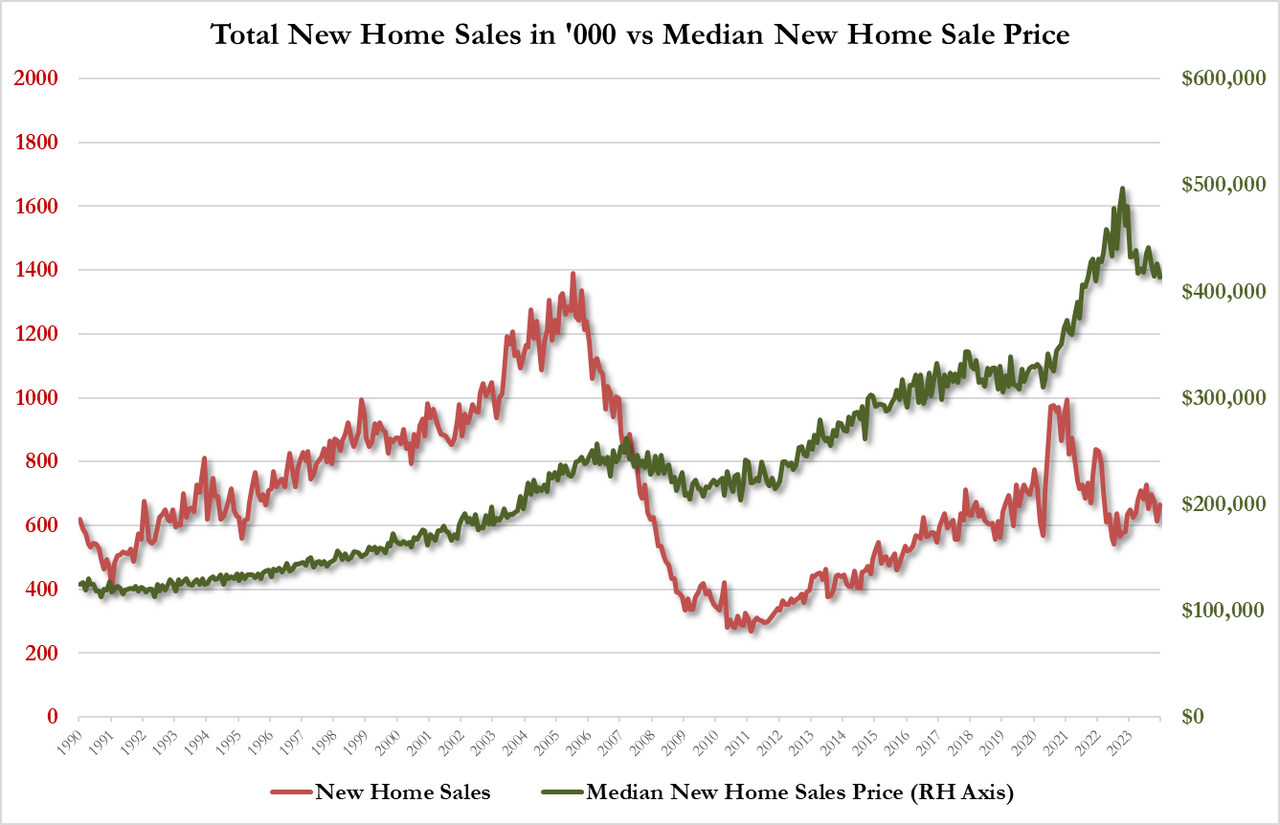
On a SAAR basis, new home sales ended at 664k (pre-COVID-lockdown levels), completely decoupled from existing home sales…
Source: Bloomberg
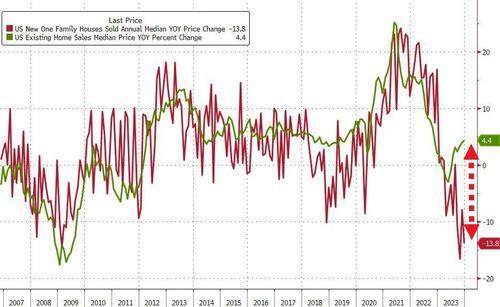
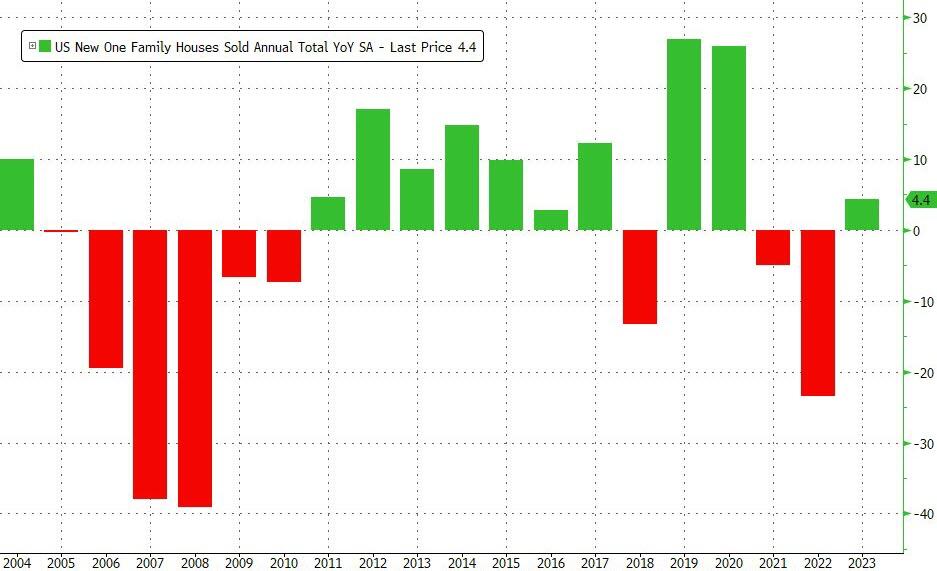
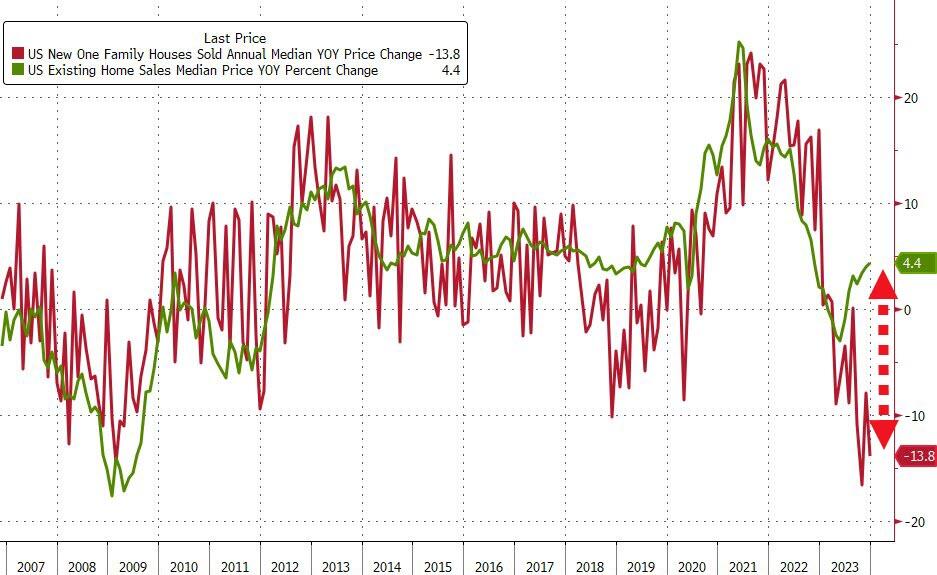
This left new home sales up 4.4% YoY…
Source: Bloomberg
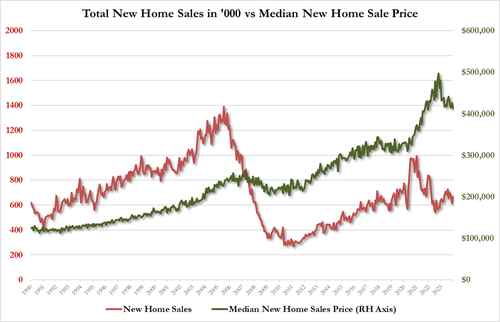
The median new home price fell 13.8% YoY to $413,200
Source: Bloomberg
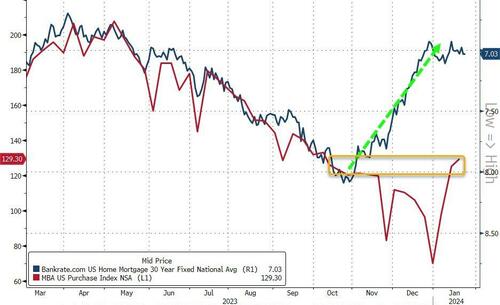
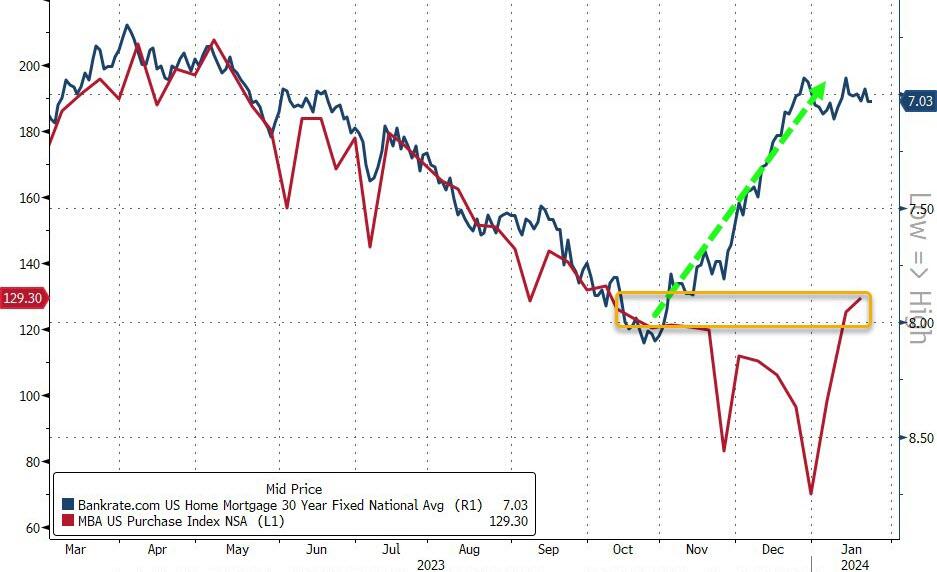
Trouble is, even as mortgage rates have plunged recently, applications for home purchases have only rebounded modestly…
Source: Bloomberg
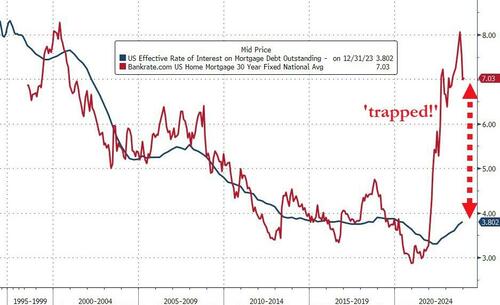
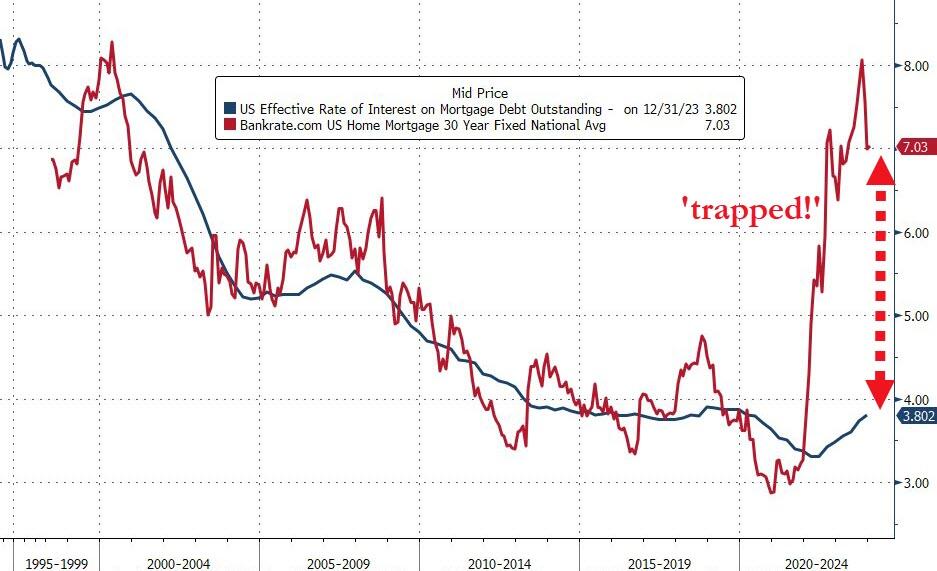
And while mortgage rates have declined (rapidly), they remain massively high relative to the effective mortgage rate for all Americans. That difference is the ‘subsidy‘ that homebuilders have to fill to enable buyers – and it’s still yuuuge!
Source: Bloomberg
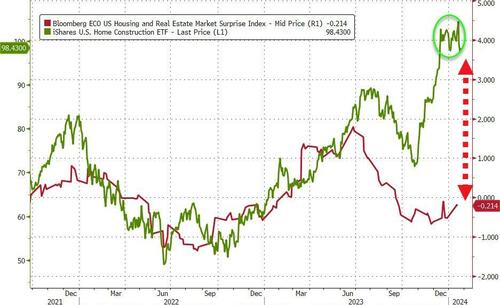
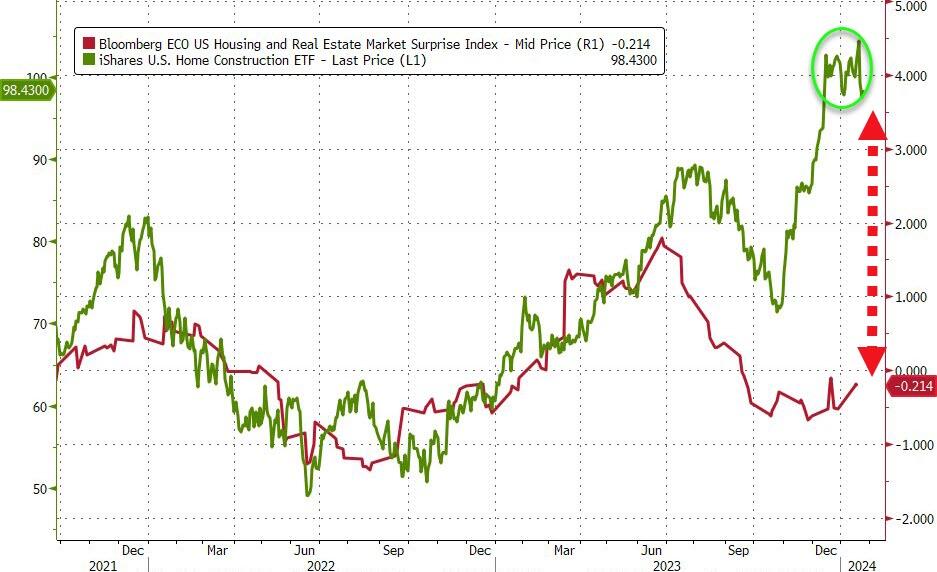
Of course, investors don’t care about actual fundamentals, rates are down so ‘buy buy buy’ the builders…
Source: Bloomberg
Finally, we note that supply shrank from 8.8 months to 8.2 months in December – so don’t expect new home prices to keep falling (they’ll be rising like the supply-constrained existing homes market)…
…and don’t expect The Fed cuts to prompt an excess-supply-driven decline in prices – it’s start your engines time on the next bubble.
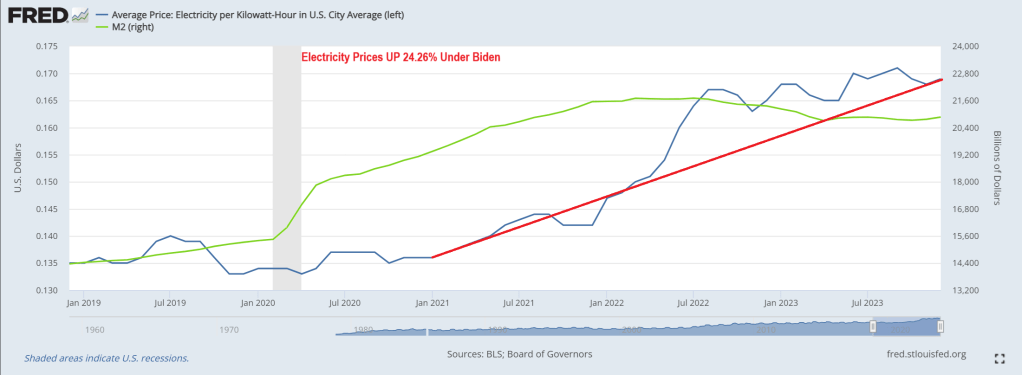
The average price of electricity has risen a whopping 24.25% under Biden and Bidenomics. Brrr!!
No wonder Biden only wants to talk about unlimited abortion and NOT the immigration (Fentanyl, child trafficing, crime, etc) fiasco at the border and continually rising prices. Or Biden’s growing wars.
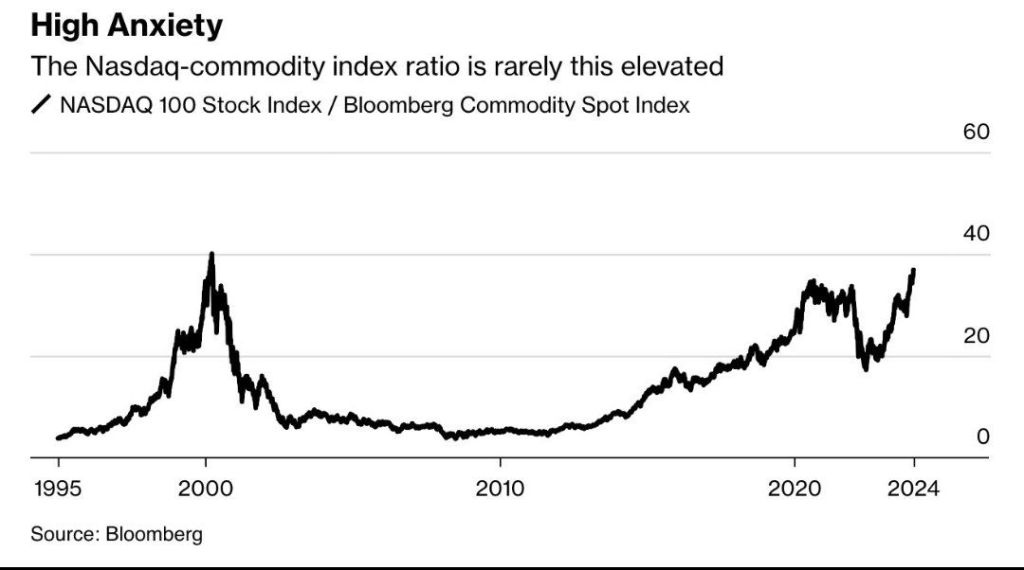
The NASDAQ commodity index RATIO is getting back to dot.com era bubble levels.
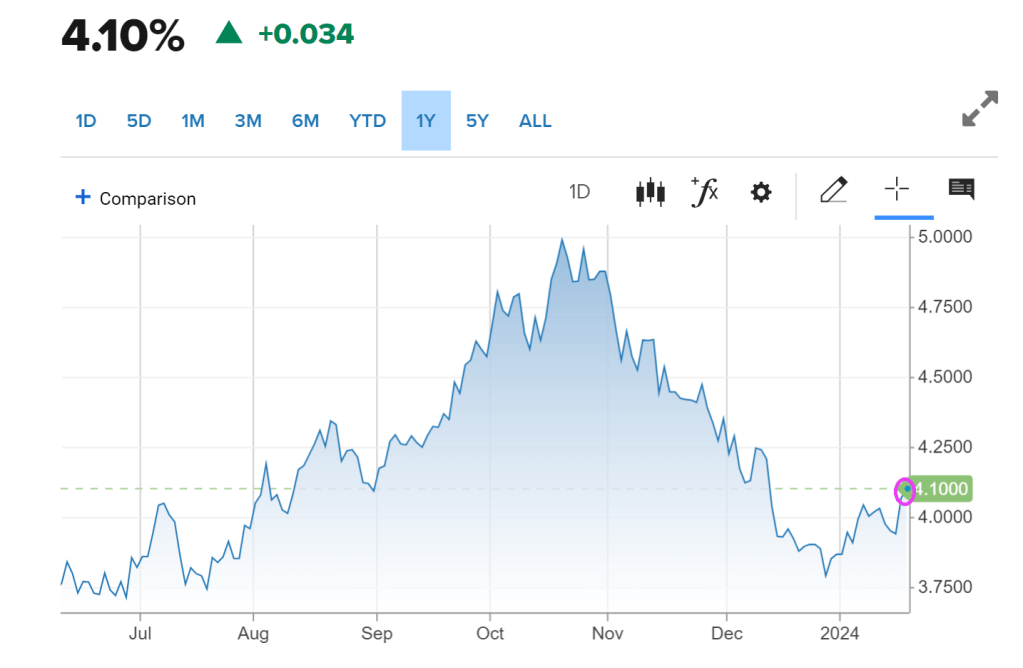
The yield on the 10-year Treasury note was recently up 4 basis points at 4.108% after briefly getting to 4.117%, the highest since Dec. 13. The 2-year Treasury yield rose by around 11 basis points to trade at 4.335%.
December’s retail sales data indicated strong consumer demand at the holidays. Retail sales increased 0.6% for the month, above economists’ estimates of 0.4%, as compiled by Dow Jones. Excluding autos, sales rose 0.4%, which also topped a 0.2% estimate.
On Tuesday, yields jumped after comments from Federal Reserve Governor Christopher Waller, who suggested that while the central bank will likely cut rates this year, it may take its time.
At the World Economic Forum in Davos, more European Central Bank members indicated that markets were getting ahead of themselves on rate cut projections.
The president of the Dutch central bank, Klaas Knot, told CNBC Wednesday that the euro zone’s central bank looked at overall financial conditions, and that “the more easing the market has already done for us, the less likely we will cut rates.” Knot was referring to the fact that higher stock and bond prices in the fourth quarter of last year acted as the equivalent of easier interest rate policy, while lower prices act as the equivalent of tighter policy.
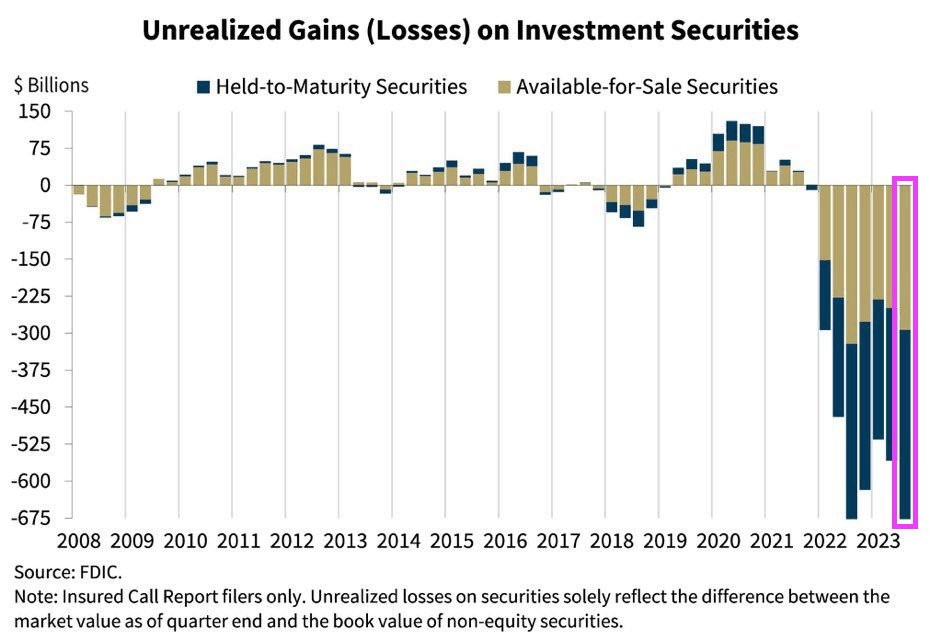
Rising interest rates are going to bite a big chunk out of The Fed’s massive ass (I mean balance sheet). Of course, The Fed sends the bill to Treasury. Gee, no wonder Biden/Yellen want so much money!
There is something wrong with letting aging politicians like Biden (81), Grassley (90), Pelosi (83), etc. borrow vast sums of money to spend when they will likely not be around for another 10 years.
Unfortunately, that period of relative stability appears to be ending.
The pace of layoffs really seemed to pick up steam at the end of 2023, and the outlook for the coming year is not promising at all. In fact, a survey that was just conducted by Resume Builder discovered that a whopping 38 percent of U.S. companies anticipate that they will conduct layoffs in 2024…
38% of companies say they are likely to have layoffs in 2024
52% are likely to implement a hiring freeze in 2024
Half say anticipation of a recession is a reason for potential layoffs
4 in 10 say layoffs are due to replacing workers with artificial intelligence (AI)
3 in 10 companies reducing or eliminating holiday bonuses this year
If you currently have a job that you highly value, try to hold on to it as tightly as you can.
Because the employment market is starting to shift in a major way.
Nike has announced a $2 billion cutback over the next three years, with an uncertain number of job cuts included. Toy giant Hasbro will cut nearly 20% of its workforce in 2024, according to reports from the Wall Street Journal. Music service Spotify announced a third round of layoffs. A recent email from CEO Daniel Ek says the company plans to cut its workforce by nearly 20%. Roku is going to be limiting new hires, and laying off about 10% of its workforce, while Amazon layoffs are effecting its new gaming division (all 180 jobs there are being eliminated). Citi CEO Jane Fraser announced layoffs in September, and sources have told CNBC that the bank could let go of at least 10% of its workforce, across several business lines. Flexport Logistics plans to cut up to 30% of its employees, and financial services company Charles Schwab is cutting back by 5-6% of its workforce, according to reports from Business Insider.
Unfortunately, this is just the tip of the iceberg.
With the continued rise of online shopping, along with record inflation, it’s no wonder that retailers are suffering steep financial losses. Unfortunately, this means that companies all across the U.S. are downsizing brick-and-mortar storefronts to make ends meet. In 2023, we’ve seen closures from big-name retailers and local shops alike—and the shutdowns don’t appear to be easing up anytime soon.
More than 3,000 retail locations were shut down in 2023, but that is nothing compared to what is coming…
According to UBS equity analyst Michael Lasser, the U.S. remains over-retailed. Lasser estimated that the U.S. will shed almost 50,000 retail stores by 2028. He cites rising operating costs and a higher proportion of e-commerce sales, causing retailers to look closely at store locations and performance.
Can you imagine what our communities will look like if that projection is even close to accurate?
As economic conditions deteriorate, people are going to get more desperate and the conditions in our streets will become even more chaotic.
A mob of over 100 looters purposefully crashed a Kia into a small bakery in Compton, Calif., before they flooded in and ransacked the store during a night of rampage on the streets earlier this week.
The thieves had gathered in the area for an illegal street takeover around 3 a.m. Tuesday before making the mile-long trek to Ruben’s Bakery & Mexican Food.
When they got to the locked store, a white Kia backed into the front doors, clearing an entryway for the crowd of pillagers to get to their loot.
And so it goes. Lawlessness is bad for retail businesses. Not to mention the morale of US citizens.
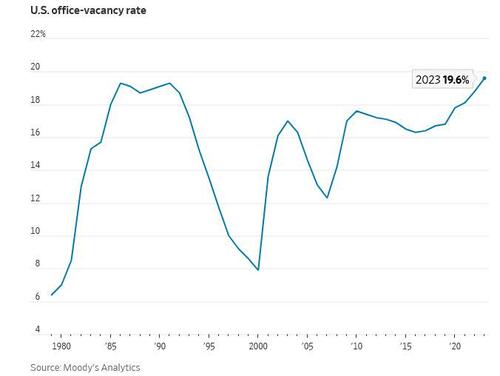
And then we have the office market. The office space vacancy rate in the US has reached its highest level since 1979. In the fourth quarter of 2023 19.6% of office space in major US cities was not leased according to data collected by Moody’s Analytics.
The increase in remote work since the COVID-19 pandemic has caused a large decline in demand for office space, despite increasing attempts to get Americans back in the office. What’s more, on the demand side the stock of office space in the US is the result of earlier booms in commercial real estate construction. The last boom took place between 2012 and 2017, when demand for commercial real estate loans strengthened. On the supply side, lending standards loosened between 2012 and 2015. This era coincides with a strong rise in the commercial real estate price index, which may have motivated banks to expand lending. Loan standards tightened during the pandemic, then loosened again when the economy rebounded, but have tightened since 2021.
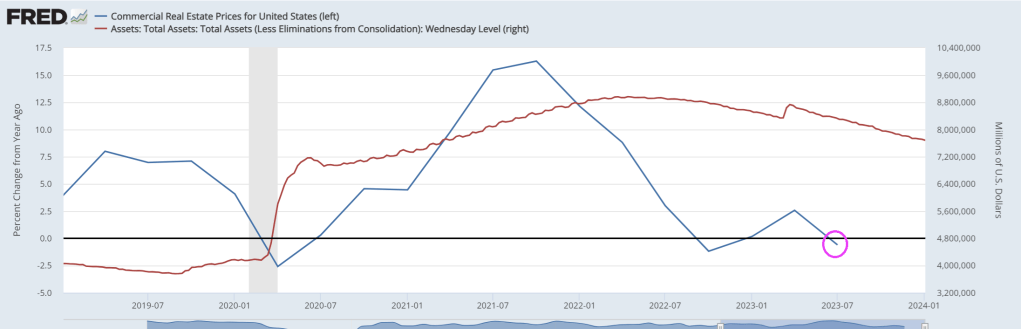
Since the Great Recession, commercial real estate prices have more than doubled in nominal terms, but have moved sideways since 2021. This suggests that prices have reached a plateau. However, in recent years inflation has obscured the movement of commercial real estate prices in real terms, which shows a peak in 2021, but since then there has been a decline, almost to the level during the COVID-19 pandemic. In other words, commercial real estate prices are already failing to keep up with inflation. Is this an indication that the commercial real estate bubble is already deflating? With nominal commercial real estate prices remaining elevated, most of the nominal price correction is likely still to come. Since small banks are heavily exposed to commercial real estate, the enduring problems at small banks and the fragility of commercial real estate could provide a dangerous mix that could explode during a recession. For more details, we refer to The commercial real estate-small bank nexus.
I noticed that The Administration has handed propaganda duties off to John Kirby and relegated KJP to relief pitching away from Peter Doocey!
One of the biggest public pension plans in the US plans to borrow tens of billions of dollars to maintain liquidity instead of triggering a fire-sale of its assets.
Borrowing to lever up its real estate-laden portfolio when CRE returns are negative??
Calstrs board members will review the first draft of the policy next Thursday. If approved, the leverage would be used “on a temporary basis to fulfill cash flow needs in circumstances when it is disadvantageous to sell assets,” a CalSTRS policy document stated.
According to Calstrs consultant Meketa Investment Group, the public pension fund already deploys leverage upwards of 4% of its portfolio, adding the proposed increased leverage won’t be used for a new asset allocation policy but rather used to smooth cash flow and as an “intermittent tool” to manage the portfolio.
The need to increase leverage comes after a report from the Financial Times last April explained that CalSTRS was planning to write down the value of its $52 billion commercial real estate portfolio after high interest rates crushed the values of office towers.
At the time of the FT report, CalSTRS Chief Investment Officer Christopher Ailman told the media outlet that:
“Office real estate is probably down about 20 percent in value, just based on the rise of interest rates,” adding, “Our real estate consultants spoke to the board last month and said that they felt that real estate was going to have a negative year or two.”
For Calstrs, CRE was one of the best-performing asset classes until Covid and the Fed embarked on the most aggressive interest rate hiking cycle in a generation. Real estate had delivered double-digit returns over a 10-year period for its million-member plan, according to an update last March.
FT noted real estate makes up about 17% of Calstrs’ overall assets.
We’re sure Calstrs is one of many pension plans under pressure from the CRE downturn. Also, regional banks have high exposure to CRE and are still not out of the woods.
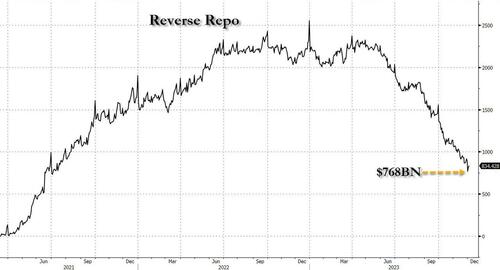
We didn’t have long to wait because just a few days later, on December 1 (just after the customary month-end window dressing period) when reverse repo tumbled to a fresh multi-year low of $765 billion…
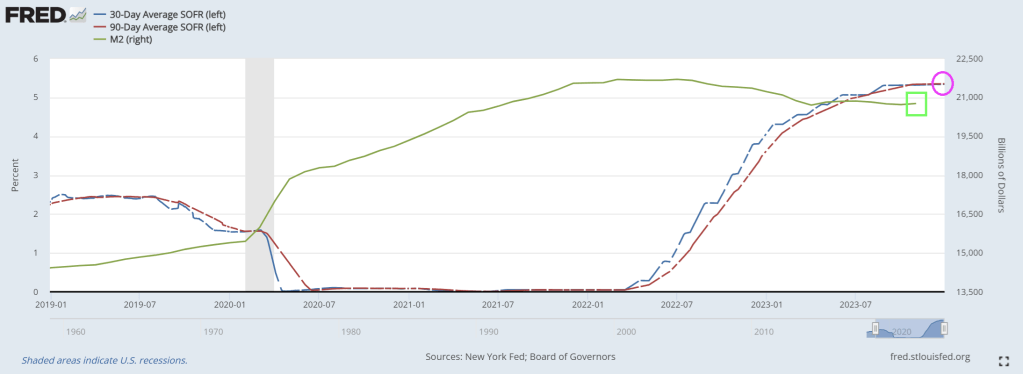
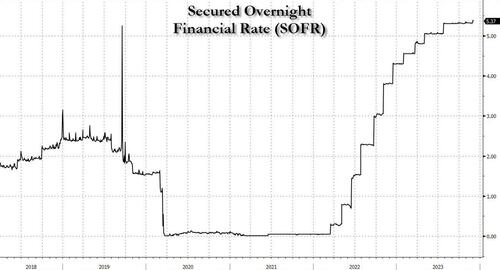
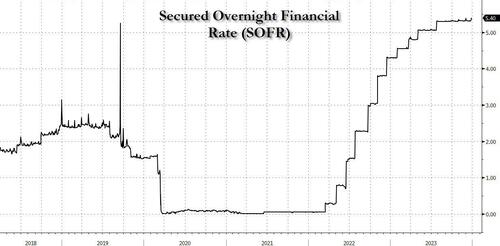
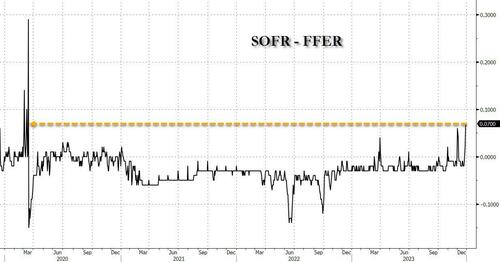
… things indeed broke as we explained in “Sudden Spike In SOFR Hints At Mounting Reserve Shortage, Early Restart Of QE” (in which we correctly previewed the coming Fed pivot at a time when most were still dead certain that Powell would only care about inflation for months to come): that’s when the the all-important SOFR rate (i.e., the new Libor) unexpectedly jumped 6bps to 5.39%, the highest on record…
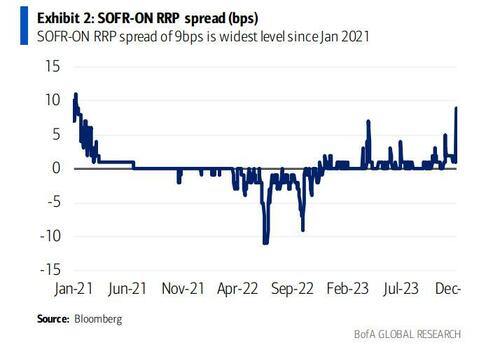
… also resulting in the largest SOFR spike vs ON RRP since Jan ’21, which hit 6bps.
The spike caught almost everyone by surprise, even such Fed-watching luminaries as BofA’s Marc Cabana because it was with “no new UST settlements, lower repo volumes, and lower sponsored bi-lateral volumes.” More ominously, and confirming our take from three weeks ago, Cabana warned at the time (full note here) that “the move is consistent with the slow theme of less cash & more collateral in the system” – i.e., growing reserve scarcity – and “may have been exacerbated by elevated dealer inventories, bi-lateral borrowing need, and limited excess cash to backstop repo. If funding pressure persists, it risks Fed re-assessment of ample banking system reserves & potential early end to QT.”
Then, the mini liquidity crisis disappeared almost as fast as it emerged, as SOFR rates eased off and the SOFR-Fed Funds spread normalized once GSE cash entered the market as it does every month….
… until today when not only did SOFR hit a new record high, ironically at a time when the market is pricing in more than 6 rate cuts in 2024…
… but the spread between the SOFR and the effective Fed Funds rate just spiked to the highest level since the March 2020 repo crisis…
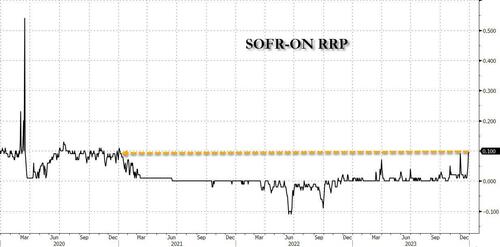
.. with a similar move also observed in the spread between SOFR rate and the O/N Reverse Repo which similarly blew out to the widest since the start of 2021.
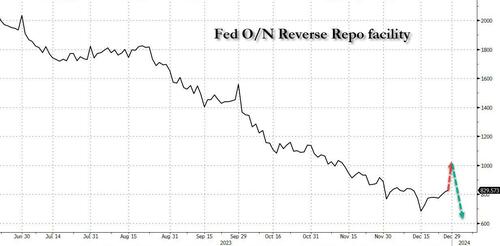
While there was no specific catalyst behind the sudden spike, two factors are the likely culprits: the year-end liquidity crunch, and the recent sharp increase in the Fed’s reverse repo facility, which has increased from a multi-year low of $683 billion on Dec 15 to yesterday’s $830 billion, and which STIR strategists expect will shoot up above $1 trillion in today’s final for 2023 reverse repo operation as a whopping $300+ billion in short-term liquidity in pulled from markets in just days.
That’s the bad news.
The good news is that come 2024 in a few hours, and specifically the first day of trading on Jan 2, we expect the reverse repo facility to plummet back to $700 billion once the year-end window dressing is over (especially with total US debt rising above $34 trillion to start the year), and floods the system with fresh liquidity which will stabilize the monetary plumbing at least until reverse repo dips below that key level of $700 billion at which point we expect the SOFR spikes to become a daily occurrence, and one which the Fed will no longer be able to ignore.
Indeed, one can already see traces of this in the repo market, where the rate on overnight GC repo first surged to 5.625% at the open on the final trading day of December before dropping to 5.45%, according to ICAP. It has since climbed back to 5.50%. But that’s still lower than where repo rates for Dec. 29 were trading during the prior session, as markets now start frontrunning the coming reverse repo liquidity flood.
Of course, once reverse repo eventually tumbles to $0 some time in March, all bets are off and the narrative shift to the next QE will begin.
“Say, can I sniff you if you take Trump off of Maine’s Presidential ballot??”


You must be logged in to post a comment.