REAL average hourly earnings growth remain in the toilet at -3.06% YoY.
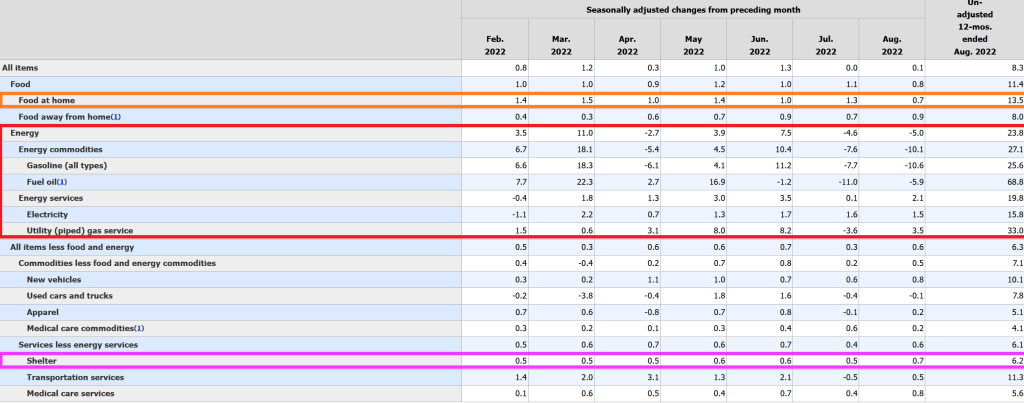
Fuel oil used to heat homes rose 68.8% YoY. Food at home rose 13.5% YoY while rent (shelter) rose “only” 6.2% YoY. Wow, renters are REALLY getting the short-end of the stick from The Fed and the Biden Administration!!
New vehicles are UP 10.1% YoY. Good luck buying those “cheap” electric cars that Mayor Pete Buttigieg trumpets! And wait for the bill when the battery needs to be replaced!!!
Freddie Mac’s 30-year mortgage commitment rate just rose to its highest level since … The Fed initiated Quantitative Easing (aka, fanatical money printing) during the financial crisis.
The good news? The US inflation report is likely to show a slowing of the inflation rate to around 8% YoY and -0.1% MoM. Why? Gasoline prices are cooling thanks to the global economic slowdown.
While gasoline and food prices are falling, CORE US inflation, the inflation rate excluding food and energy, is expected to rise to around 6.1% YoY and +0.30% for August.
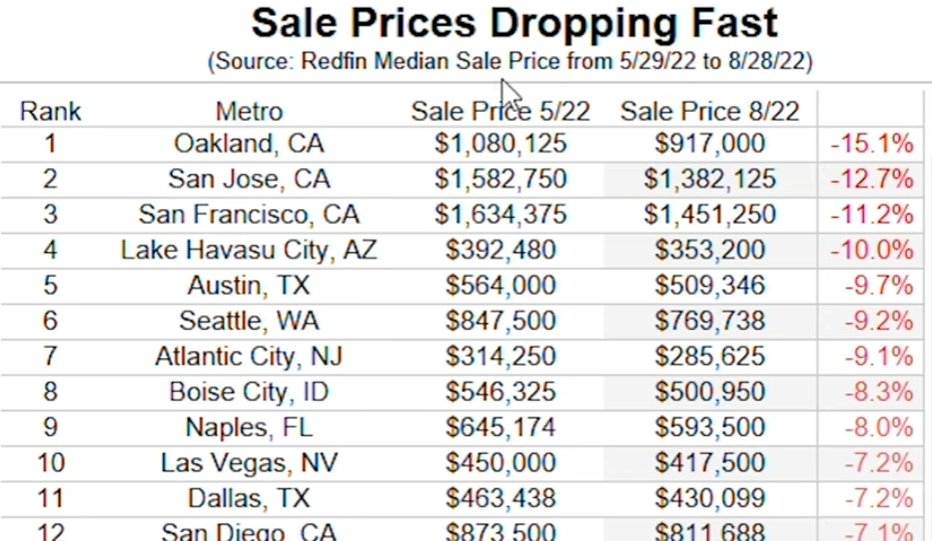
The US housing market is facing stress thanks to The Federal Reserve’s “war on inflation.” As The Fed starts trimming its excess ballast and M2 Money growth YoY slows to the lowest since Pre-Covid, we are seeing housing markets like San Francisco beginning to experience declines in home prices.
According to Redfin, Oakland California is leading the nation in terms of declining sales prices at -15.1% over a 3 month period. Followed by Silicon Valley and San Jose at -12.7%. San Francisco is in third place at -11.2% (I will ignore Lake Havasu AZ since it is teeny but does have one of the London Bridges) and Austin TX is in 5th place at -9.7%.
As The Fed takes away the massive monetary punch bowl, mortgage rates have risen to the highest since November 2008. And with the withdrawal of monetary stimulus (raising Fed Target Rate), mortgage purchase applications have declined.
Here is a photo of The Federal Reserve fighting the housing and mortgage market.
Joe Biden is the king of malaprops. But his press secretary is just as bad as her boss. Recently, she said that under Biden, there were 10,000 million jobs created. Better known as 10 BILLION jobs created. Not bad, considering that the total population of the US is 333 million. THAT is a hot labor market! /sarc
But seriously, the US U-3 unemployment rate is 3.7% in August, the lowest since Donald Trump was President and BEFORE the Covid outbreak. The Covid economic shutdown saw a surge in the unemployment rate to 14.7% in April 2020 that begat a huge spike in M2 Money growth (22% YoY in May 2022 (green line). Only now is M2 Money growth returning to Trump-era growth rates.
But as The Federal Reserve removes its hefty monetary stimulus, it is unlikely that the unemployment rate will remain low.
In defense of Biden’s press secretary, the US economy saw 10.247 million jobs added under Biden (although while technically correct, even MSNBC wouldn’t give Biden credit for job creation in his first several months as President. Check that. They probably would.
April 2020 saw a decline in US jobs of -20.493 million jobs thanks to the Covid economic shutdowns. BUT with the M2 Money surge, we saw +12.1 million jobs added between May and November 2020 under Trump. Then the US elected China Joe (or Beijing Biden) as President.
The economic shutdowns due to Covid were an economic disaster for millions. But the surge in M2 Money (supporting the various Federal spending programs and inflation) explains the surge in jobs added, not economic wizardry of Biden.
For some reason, Biden and his press secretary failed to mention that inflation is so bad that REAL average hourly earnings YoY are declining at a 3% pace.
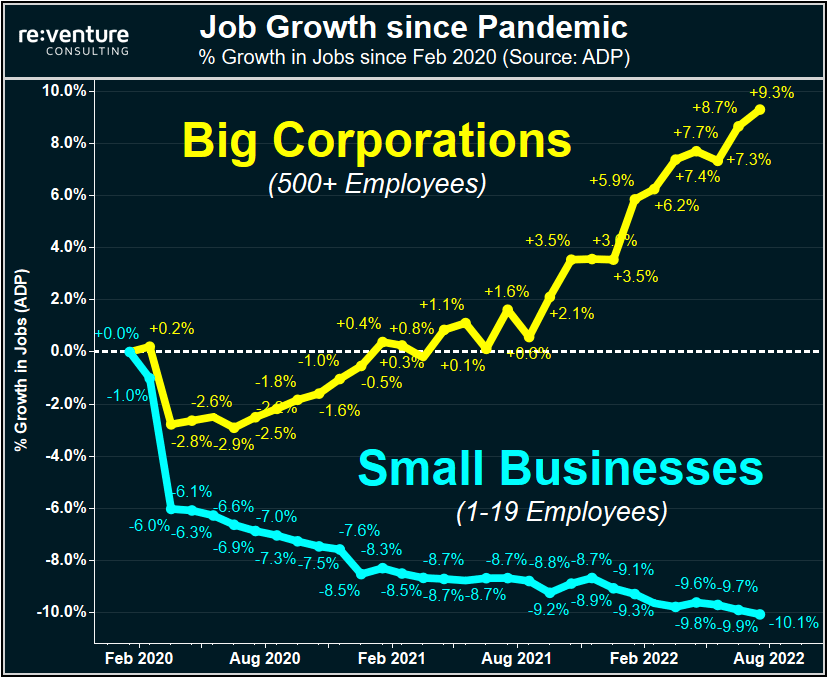
And not surprisingly, job growth has accrued to big corporations and not small businesses.
When we look at tomorrow’s US jobs report, it is important to acknowledge that 1) The Federal Reserve has not yet removed the Covid stimulus (green line) and 2) the ADP payroll jobs added was only 132k in August while non-farm payrolls jobs added in July was 528k. That is quite a spread!
(Bloomberg)The hotly anticipated US jobs report has the potential to tip the scales toward a third jumbo-sized hike in interest rates later this month after a wave of data that point to a resilient consumer and high labor demand.
Friday’s report is one of the last marquee releases Fed officials will have in hand before the mid-September policy meeting to help them decipher a complex economic and inflationary puzzle.
Forecasts call for a healthy, yet more moderate 298,000 gain in August payrolls and for the unemployment rate to hold steady at 3.5%, matching the lowest in five decades. Solid wage growth is also expected amid a persistent mismatch between labor demand and supply.
Such figures, in conjunction with a blowout July employment print, improving consumer sentiment figures and a surprise pickup in job openings, could be enough to push the Fed to raise borrowing costs by 75 basis points, extending the steepest interest-rate hikes in a generation to curb an inflation surge.
As of this morning, Fed Funds futures data is still pointing to The Fed Funds Target rate rising from 2.50% to around 4% by the March FOMC meeting. That is still a large jump of another 150 basis points anticipated.
When inflation is so bad that REAL wage growth is negative (-3.31% YoY), I would hardly call that a strong economy for the middle class and low-wage workers.
We also see that REAL home price growth (existing home sales median price YoY – CPI YoY) has slowed to only 2.23% YoY in July.
As The Fed tightens, it is only growing to get worse.
The ADP National Employment Report SA Private Nonfarm Level Change printed this morning confirming what most of us already knew … the US economy is slowing if not already in recession.
The ADP jobs added grew by only 132k in August as The Fed’s M2 Money growth slowed.
Since The Federal Reserve and Federal government overstimulated the economy when Covid surfaced in early 2020, The Fed’s balance sheet expanded to near $9 TRILLION which helped existing home sales median price YoY hit 25.2% in May 2021 but falling to 10.8% YoY in July 2022 as The Fed tightened rates.
It will be a monetary inferno if The Fed decides to actually unwind its $9 trillion balance sheet.
Mortgage application volume dropped and remained at a multi-decade low last week(back to 1997), led by an 8 percent decline in refinance applications, which now make up only 30 percent of all applications. Purchase applications have declined in eight of the last nine weeks, as demand continues to shrink due to higher rates and a weaker economic outlook.
Mortgage applications decreased 3.7 percent from one week earlier, according to data from the Mortgage Bankers Association’s (MBA) Weekly Mortgage Applications Survey for the week ending August 26, 2022.
The unadjusted Purchase Index decreased 4 percent compared with the previous week and was23 percent lower than the same week one year ago.
The Refinance Index decreased 8 percent from the previous week and was 83 percent lower than the same week one year ago.
Just wait for The Federal Reserve to start unwinding its enormous balance sheet!
US home price growth is decelerating as The Federal Reserve let’s some of the air out of the monetary tires.
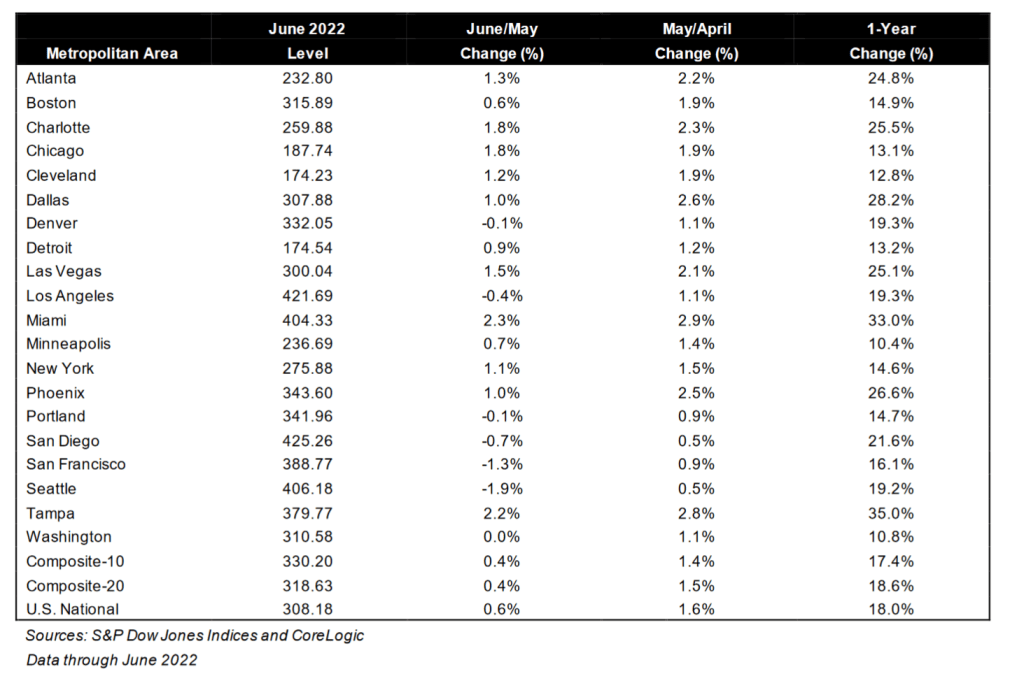
The S&P CoreLogic Case-Shiller U.S. National Home Price NSA Index, covering all nine U.S. census divisions, reported an 18.0% annual gain in June, down from 19.9% in the previous month. The 10-City Composite annual increase came in at 17.4%, down from 19.1% in the previous month. The 20-City Composite posted an 18.6% year-over-year gain, down from 20.5% in the previous month.
Tampa, Miami, and Dallas reported the highest year-over-year gains among the 20 cities in June. Tampa led the way with a 35.0% year-over-year price increase, followed by Miami in second with a 33.0% increase, and Dallas in third with a 28.2% increase. Only one of the 20 cities reported higher price increases in the year ending June 2022 versus the year ending May 2022.
While the Case-Shiller National home price index slowed to 18% YoY in June, the median price for existing home sales slowed to 10.55% YoY in July as The Fed’s M2 Money growth YoY slowed to 5.28% and Freddie Mac’s 30yr mortgage rate rose to 5.3%.
Bear in mind that Case-Shiller is lagged compared to the existing home sales numbers. Much like the New York Yankees manager picking the hottest batter in June to start in September. The Yankees traded poor-hitting Joey Gallo to the LA Dodgers to supplement poor-hitting Cody Bellinger.
In any case, as of June 2022, the 20 metro areas covered by Case-Shiller all grew in price in double digits with alligator-infested Tampa and Miami FL in the 30% rate, rattlesnake-infested Dallas is in 3rd place at 28.2%. Phoenix AZ, where I used to live, slowed to 26.6%. Yes, I had rattlesnakes on my property (a nest of Mohave Rattlers) and a large Diamond-backed Rattler behind my house).
Let’s see how housing holds up with more Fed monetary tightening. Fed Chair Powell is predicting “pain.”


You must be logged in to post a comment.