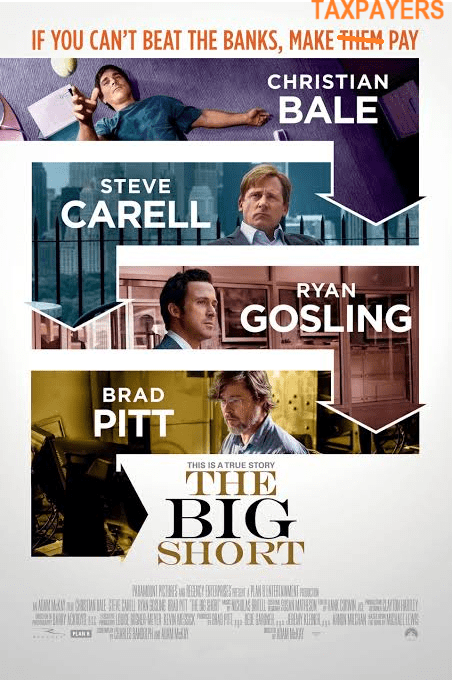
Shades of “The Big Short” and subprime crash of 2008.
Following a profit warning from New York Community Bancorp on Wednesday, largely attributed to continued turmoil in the commercial real estate sector (which led the bank to slash its dividend and bolster reserves leading to a 38% plunge in its shares and triggering the largest drop in the KBW Regional Banking Index since the collapse of Silicon Valley Bank last March) Japan’s Aozora Bank slashed the value of some of its US office tower loans by more than 50%, according to Bloomberg.
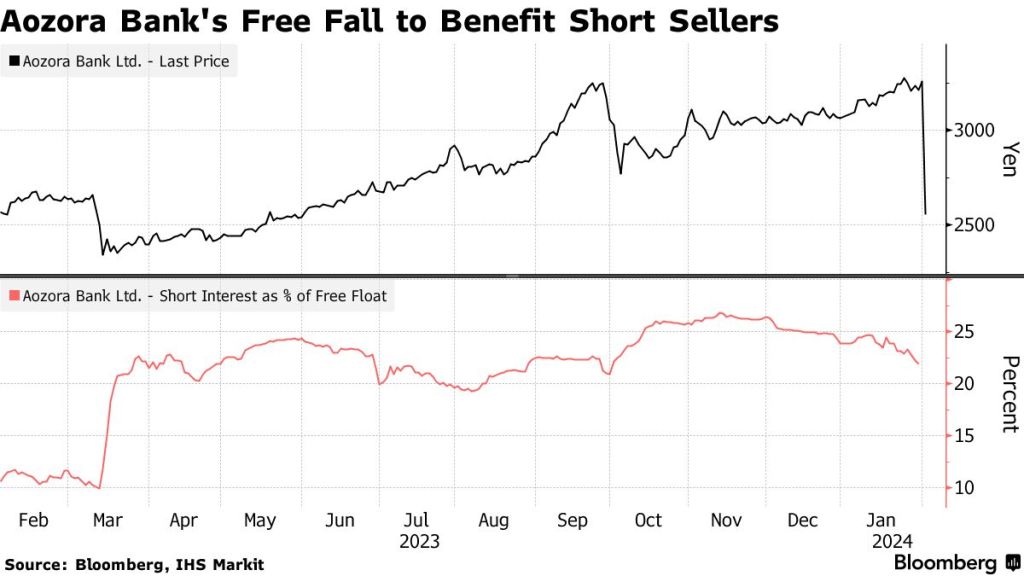
Like rows of falling dominoes, Aozora Bank, the 16th largest in Japan by market value, saw its shares plunge by 20% on Thursday after reporting a net loss of 28 billion yen ($191 million) for the fiscal year. This was in stark contrast to its earlier projection of a 24 billion yen profit.
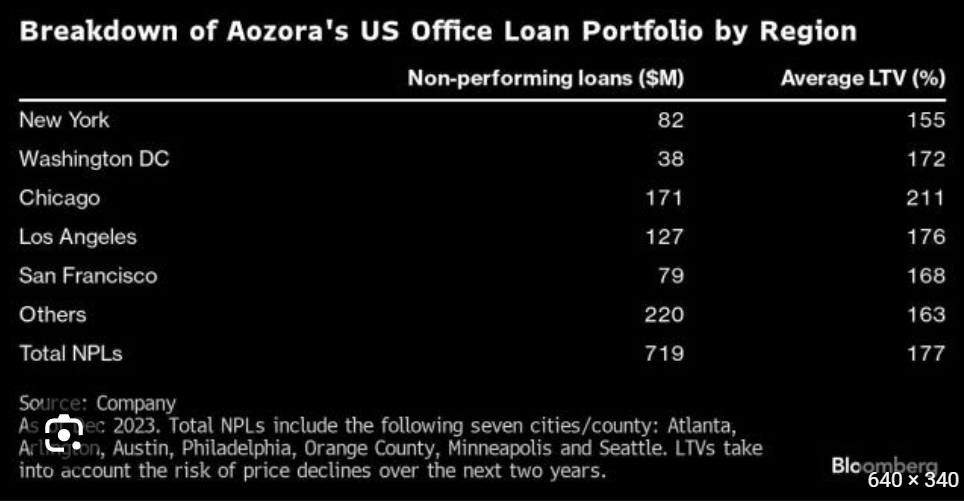
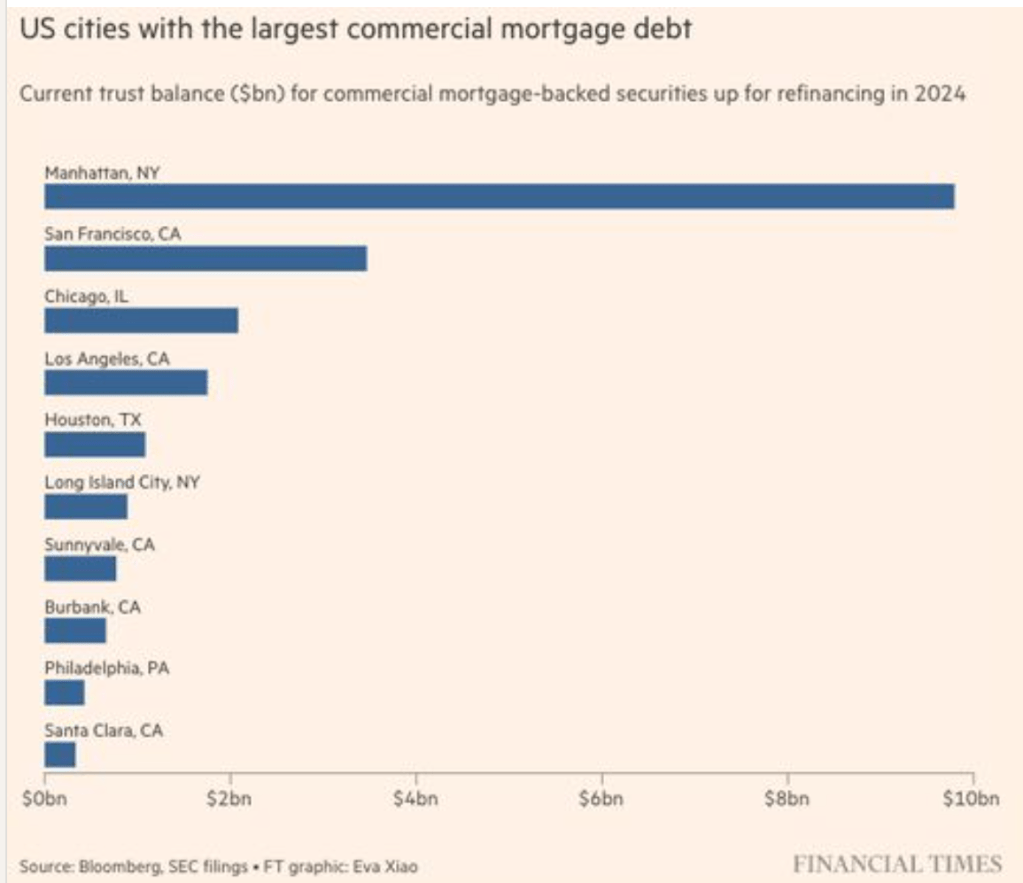
Aozora wrote down the value of its non-performing office loans by 58%, including a 63% reduction in Chicago and between 51% and 59% in New York, Washington D.C., Los Angeles, and San Francisco – all of these cities are plagued with violent crime and controlled by radical Democrats.
In total, the bank’s US office loans were about 6.6% of its portfolio, or approximately $1.89 billion. It said 21 office loans worth $719 million were classified as non-performing, and as a result it increased its loan-loss reserve ratio on US offices to 18.8% from 9.1%.
“It’s a shock,” said Tomoichiro Kubota, a senior market analyst at Matsui Securities Co., adding, “The expectation was the worst was over and that the bank had set aside enough provisions.” Guess not.
Far markets, this was another flashing red warning sign that not only is a tsunami of office loan defaults still on the horizon, but that banks continue to be woefully underprovisioned for the coming bloodbath.
“This is a huge issue that the market has to reckon with,” said Harold Bordwin, a principal at Keen-Summit Capital Partners LLC in New York, specializing in renegotiating distressed properties.
Bordwin said, “Banks’ balance sheets aren’t accounting for the fact that there’s lots of real estate on there that’s not going to pay off at maturity.”
Besides New York Community Bancorp and Aozora Bank, Deutsche Bank noted in fourth-quarter results:
“Interest rate environment remains key driver for refinancing risk and potential [credit-loss provisions] in 2024 especially in office, with further drivers being ongoing sponsor support and expiring rental agreements.”
Fed chair Powell delivered bad news for the CRE world in yesterday’s FOMC meeting, warning that a March rate cut isn’t happening (absent a shock of course). Perhaps most notably, the Fed removed the following sentence from the FOMC statement: “The US banking system is sound and resilient.” Cynics asked why the Fed no longer sees “the US banking system is sound and resilient” – is it a signal of rumblings in the economy near-term, or was it just a lie before, and now that bank dominoes are again falling, will Powell be forced to trot it back out?
Where will this lead? Likely more bank and pension fund bailouts. You didn’t really believe that hype about the Dodd-Frank banking legislation that there will never be another bank bailout did, you??


You must be logged in to post a comment.