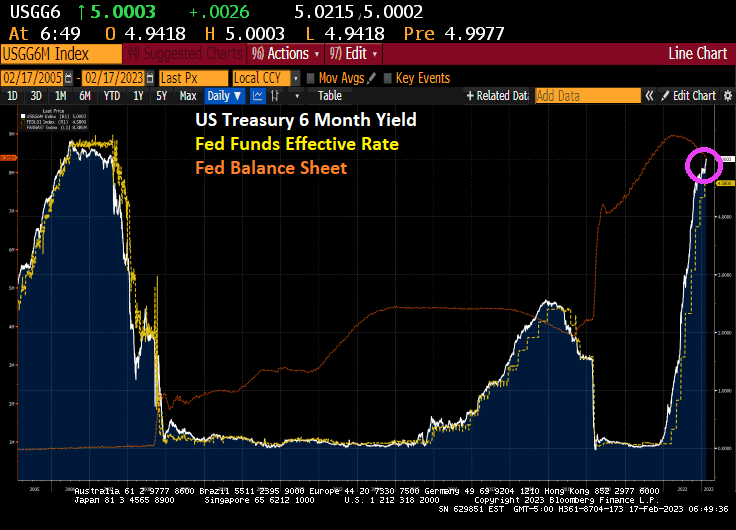
Well, here we are again. Back to 2007 and the housing bubble and subsequent financial crisis. The US Treasury 6-month yield is back over 5%, a yield we haven’t seen since August 8, 2007.
Well, there is one notable difference. The Fed’s balance sheet is still at $8.4 TRILLION whereas it was only $866 billion on August 8, 2007.
The US Treasury yield curve? It remains deeply inverted as The Fed withdraws liquidity.
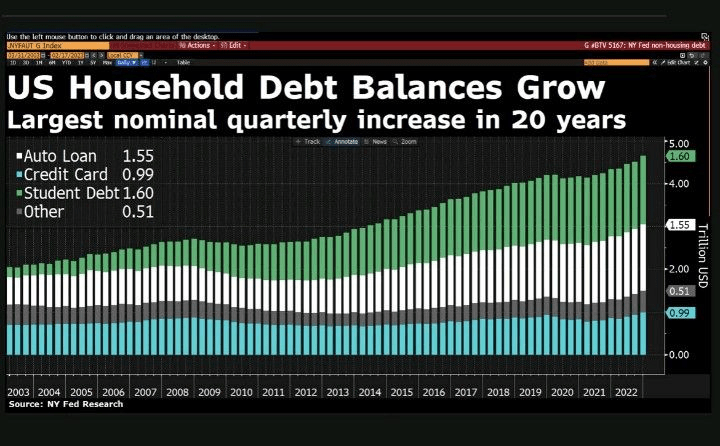
And then we have this diddy. US household debt balances increase, the largest nominal quarterly increase in 20 years.
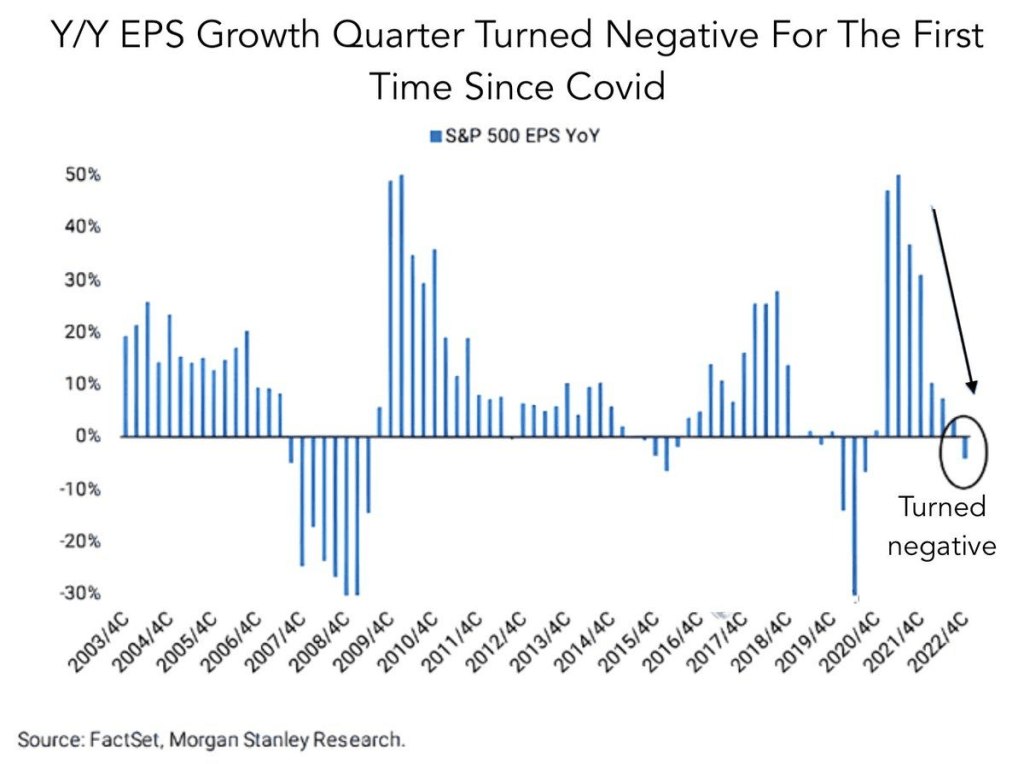
Also, we have the year-over-year EPS growth has turned negative for the first time since Covid.
While much of the US is down from 2022 peaks in home price. but it is The West where home prices are down the most (just like 2008 where the Inland Empire of California, Phoenix and Las Vegas crashed in term of home prices).
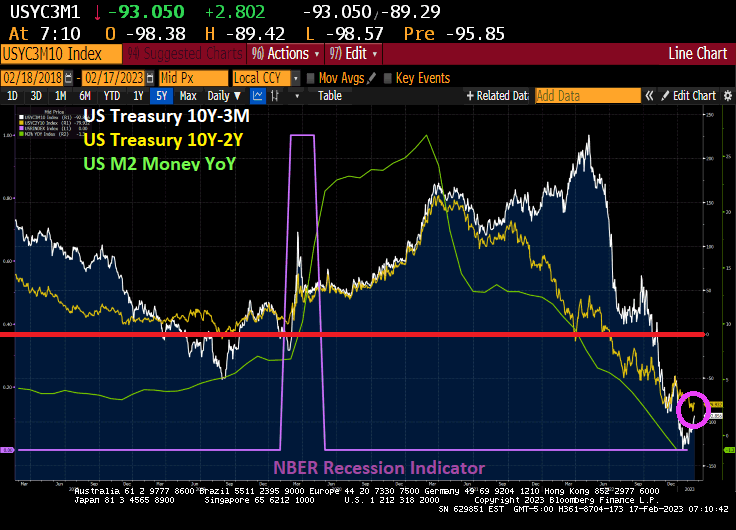
Biden’s State of the Union address saw him bragging about his record job creation (actually, it was the private sector, not Biden than created jobs) and historic unemployment rate. What Biden didn’t mention (along with not discussing the porous Mexican border with fentanyl pouring across or why he failed to shoot down a Chinese spy balloon until after it has passed over numerous military reservation) is that the unemployment rate always hit a low point just prior to a recession.
So, here we sit at 3.4% unemployment. But we also see the US Treasury yield curves (10Y-3M and 10Y-2Y) remaining deeply inverted.
The US Treasury 10-year yield is up 5.5 basis points today.
And Bankrate’s 30-year mortgage survey rate is up slightly today.
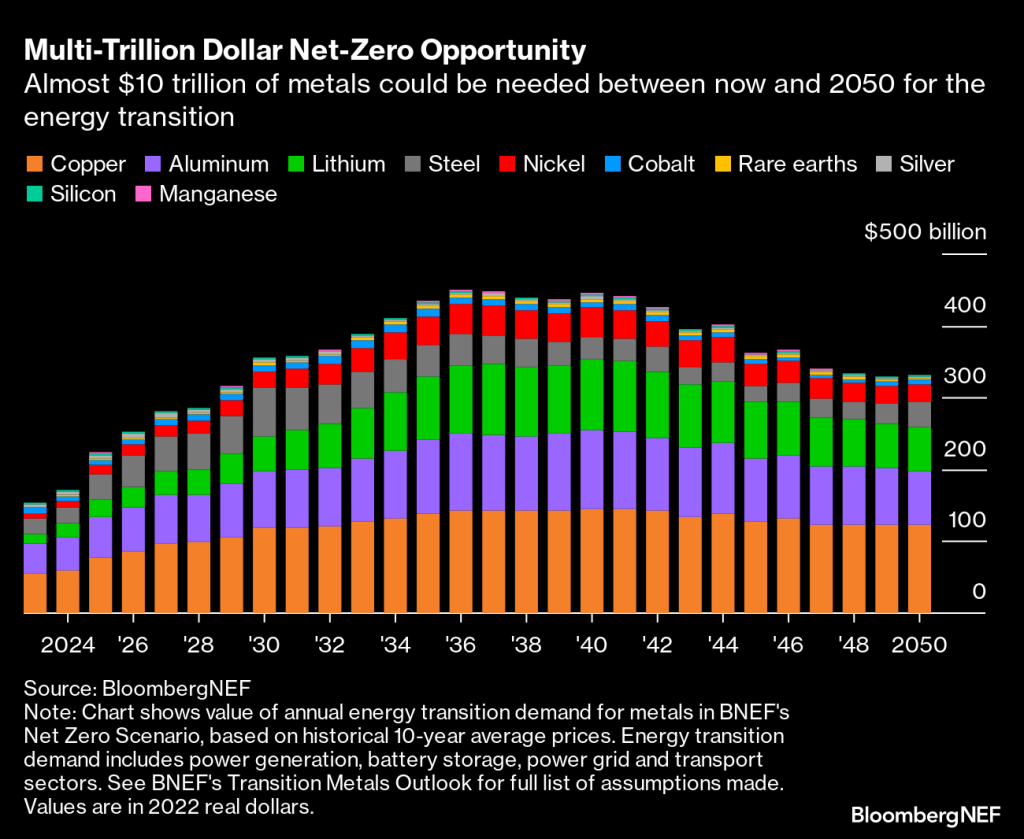
Copper set to be most valuable opportunity in race to net zero
Electric vehicles and wind turbines are main demand drivers
Everything is a race when it comes to the energy transition. A race against time to reach net-zero emissions by the 2050 crunch point; a race to build enough wind turbines and replace gas-guzzling cars with electric vehicles; a race between superpowers to shore up domestic supply chains and capture the economic benefits of decarbonization.
There’s one common thread that runs through them all: the need for metals. A greener future is impossible without copper to expand the world’s electricity grids, lithium for batteries and aluminum for solar panel frames.
Companies are now hunting for more direct access to these essential raw materials as they recognize metals will form the backbone of the energy transition. General Motors Co., for example, announced at the end of last month that it will invest $650 million in Lithium Americas Corp. and help develop the Thacker Pass mine in Nevada. The automaker is also reportedly competing to buy a stake in the base metals unit of mining giant Vale SA, according to Bloomberg News.
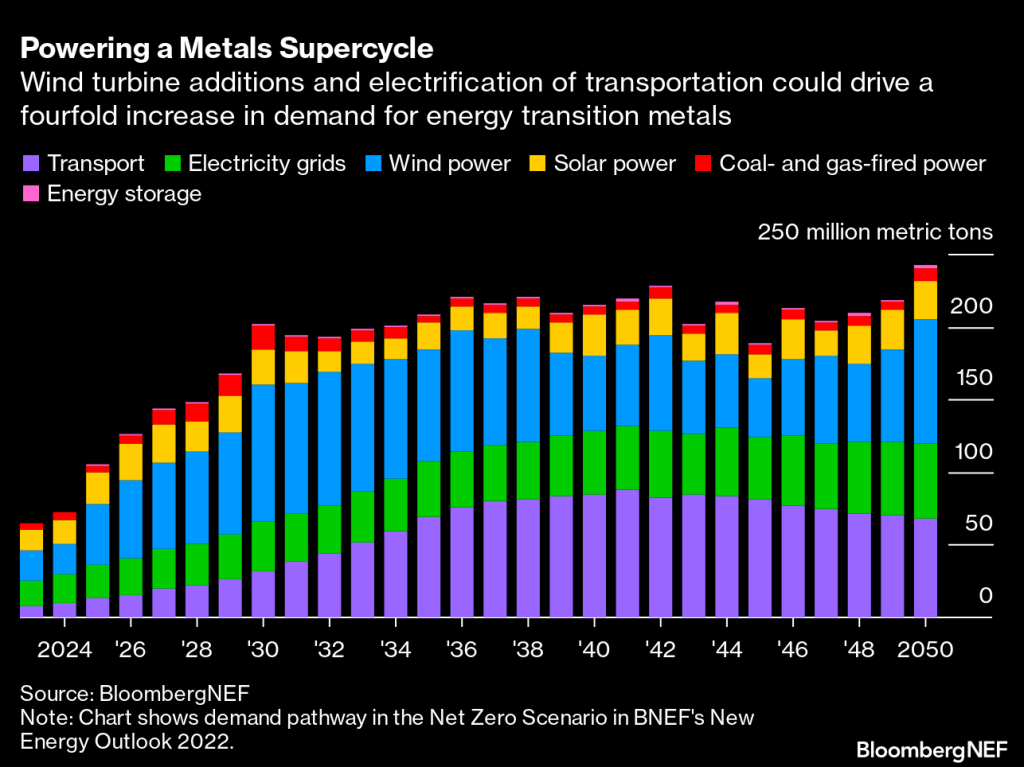
What exactly is driving this hunger for metals? Achieving a net-zero world will entail electrifying as much as possible. BNEF estimates the size of the global power grid will have to almost double to 152 million kilometers by 2050, requiring masses of steel, copper and aluminum. This means the expansion of grids will use the most copper out of all energy transition applications, coming in at 427 million tons between now and mid-century.
Clean electrons will need to flow through those grids, enabled by the scale-up of wind and solar power. Wind turbines are projected to consume the most metals overall by 2050 if the world gets on track for net-zero emissions. Today, steel accounts for nearly 90% of the materials used by weight in offshore wind and about 25% in onshore wind, although as turbines get bigger, they will use less steel on a per-megawatt basis. Consumption of rare earth metals such as neodymium will become more intense, however, as permanent magnet generators become more common in turbines.
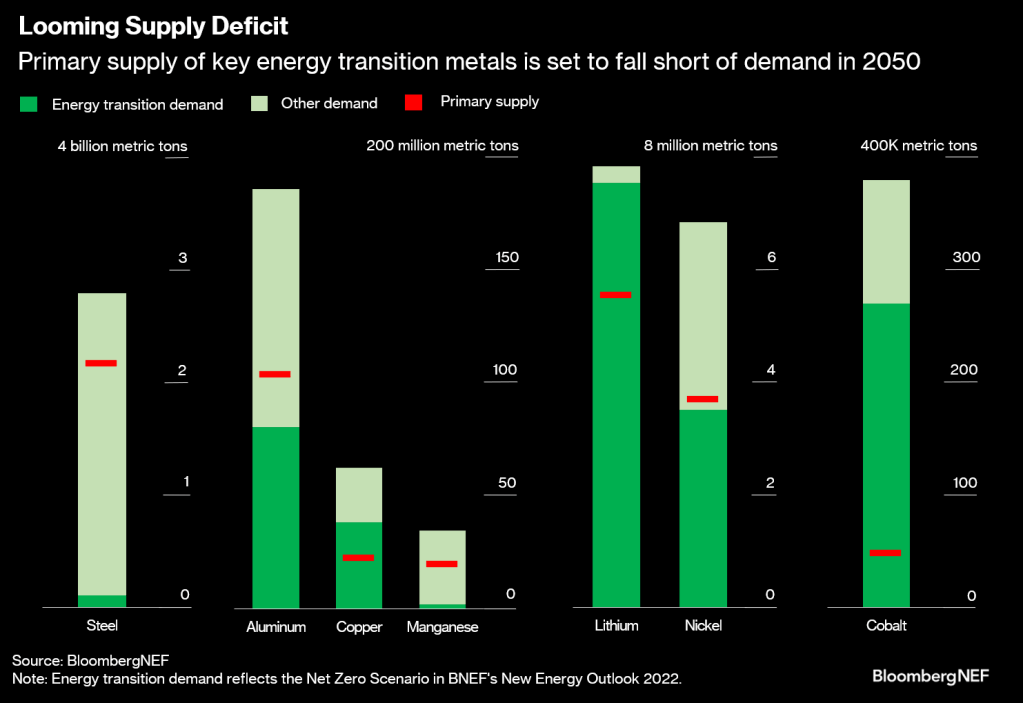
Rising demand for energy transition metals is essentially a given at this point. The real question is whether there will be enough supply. As things currently stand, lots of these metals, including copper and cobalt, are at risk of a shortfall in the coming decades unless current reserves can be supplemented with new geological discoveries and projects, and recycling of old material is stepped up.
Many countries have known resources of metals – in other words, natural occurrences of minerals in high concentrations and sufficient quantities. But not all of these resources have been turned into reserves that can be profitably mined yet. This requires time and investment to go through the exploration, discovery and feasibility stages, and these processes could be thwarted by policy.
Here are metals today.
So, people get ready! Whether you agree with green energy policies or not, it is where markets are headed. Personally, I am sticking to my gasoline guzzling cars until I am ordered not to drive them. Stated differently, if Joe Biden can drive a gas guzzling V-8 in a Chevy Corvette, why can’t I?
At least I didn’t leave classified documents in my garage.
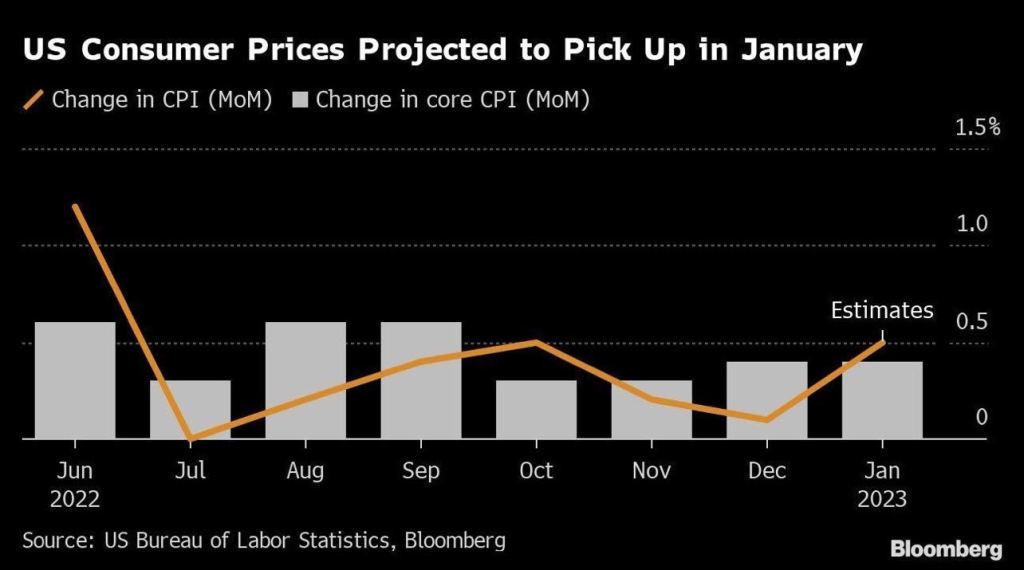
The one statement that Biden made in his State of the Union Address that was factually accurate was that inflation is coming down. Of course, he then blew it by saying he inherited inflation from Trump which was not true. Headline inflation (CPI YoY) was only 1.4% when Biden was sworn-in as President and rose to 9.1% YoY by June 2021 before finally starting to decline.
But despite the cooling of inflation (and M2 Money growth), The Fed seems hell bent on increasing their target rate, now forecast by Fed Funds Futures to peak in July 2023 at 5.123% before pivoting.
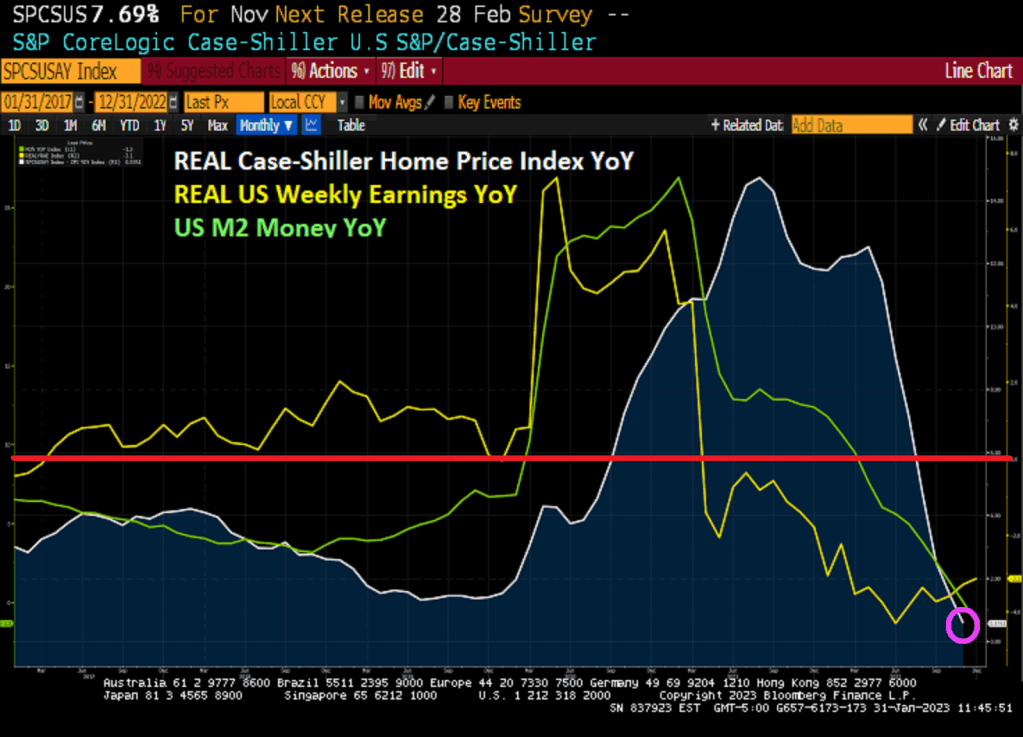
On a year-over-year (YoY) basis, the Case-Shiller National home price index slowed to 6.77%. On a month-over-month (MoM) basis, the CS National index fell -0.54%. That is the 5th straight month of home price declines.
In REAL terms, the Case-Shiller National home price index is up only 0.58% YoY as REAL Weekly Earnings growth is negative at -3.1% YoY.
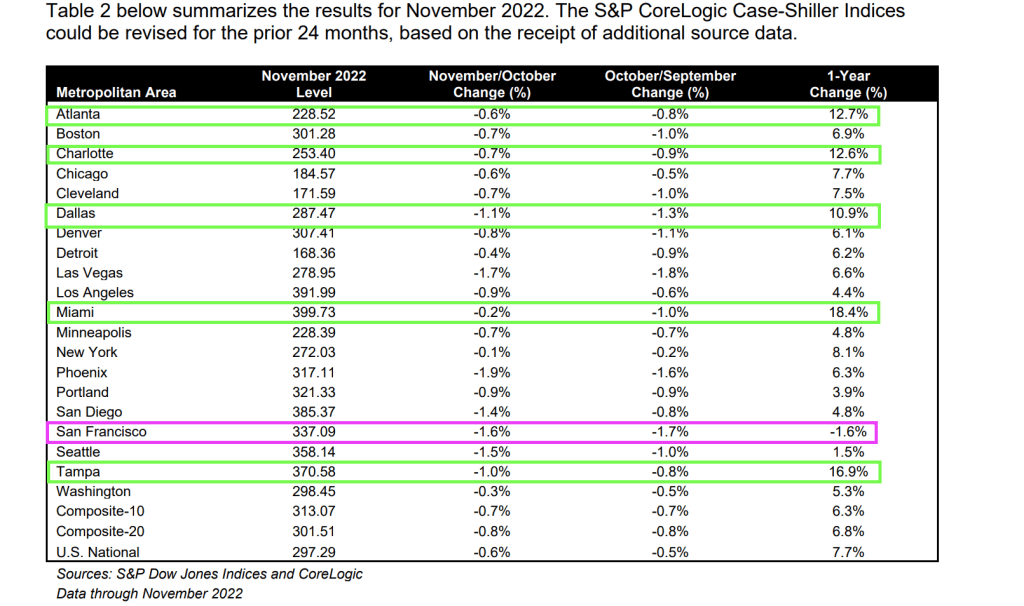
Only San Francisco fell on a YoY basis (down -1.6%). Five metro areas were above 10% and they are all in the South. Atlanta, Charlotte. Dallas, Miami and Tampa.
On MoM basis, every metro area in the Case-Shiller 20 index saw price declines from October to November.
The Federal Reserve’s Open Market Committee (FOMC) is meeting on Wednesday. What will they do?
First, The Fed Funds Target (upper bound) is above the Core US inflation rate YoY. Second, M2 Money growth YoY has slowed to -1.3%.
Of course, the members of the FOMC might decide that this is not enough and may keep raising rates and shrinking The Fed’s enormous balance sheet.
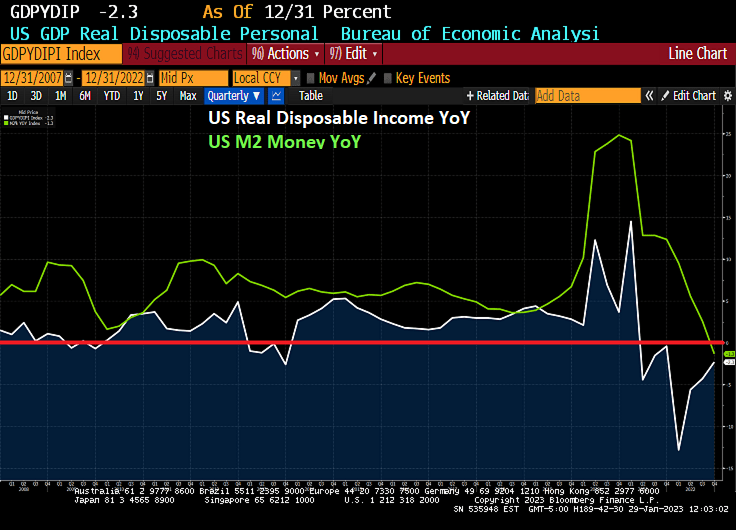
In the “Haven’t they suffered enough?” arena, US real disposable income has fallen by -21% since Biden was sworn-in as President.
On the other hand, the Taylor Rule is still pointing to a target rate of 10% (we aren’t even half way there at 4.50%).
Oh and the price of insuring against a US debt default remains elevated (since Biden and Schumer are baving like arrogant bullies) and are refusing to negotitate over spending cuts.
The 1Y CDS volatility cube indicates that it will all be over soon.
Welcome to the wonderful world of Bidenomics, giving the US 40 year highs in inflation leading The Federal Reserve to remove its enormous monetary stimulus (known as “The Punch Bowl.”
I previously pointed out that US Real GDP was actually less than 1% year-over-year (YoY) in 2022, hardly a fantastic number given the trillions in Biden/Pelosi/Schumer spending (Omnibus, Infrastructure, etc) and Powell/Fed’s whopping monetary stimulus in 2020. But real disposable income, the amount households have left to spend after adjusting for inflation, had been falling for 7 straight months.
In fact, REAL disposable personal income peaked in March 2021, shortly after Biden was sworn-in as President in Janaury 2021 at $19,213.9 billion (or $19.214 TRILLION). As of December 2022, real personal disposable income had fallen to $15,213.0 or $15.213 TRILLION. That is a loss of $4 TRILLION since March 2021. Or a -21% Loss in Real Disposable Income.
Despite polticians like President Biden cheerleading his great economic accomplishments and Treasury Secretary Janet Yellen dipping into Social Security to fund the Federal government (much like Biden’s dipping into the Strategic Petroleum Reserve), there are serious problems facing America’s middle class and low-wage workers. Inflation is still brutal (but slowing) and REAL weekly earnings growth has been negative for 21 straight months (meaning that Biden’s bragging about wage growth has been destroyed by the inflation created by his energy policies and massive spending sprees). Personal spending rate YoY has plunged -53.5% to cope with inflation. To quote Joe Biden (Chauncy Gardner), “All is well in the garden.” But all is not well in the garden. As a result, we are now seeing pension funds jumping from stocks to bonds.
(Bloomberg) For some of America’s biggest bond buyers, the soft-versus-hard-landing debate on Wall Street might be a sideshow. They’re getting ready to swoop in with as much as $1 trillion, no matter what happens.
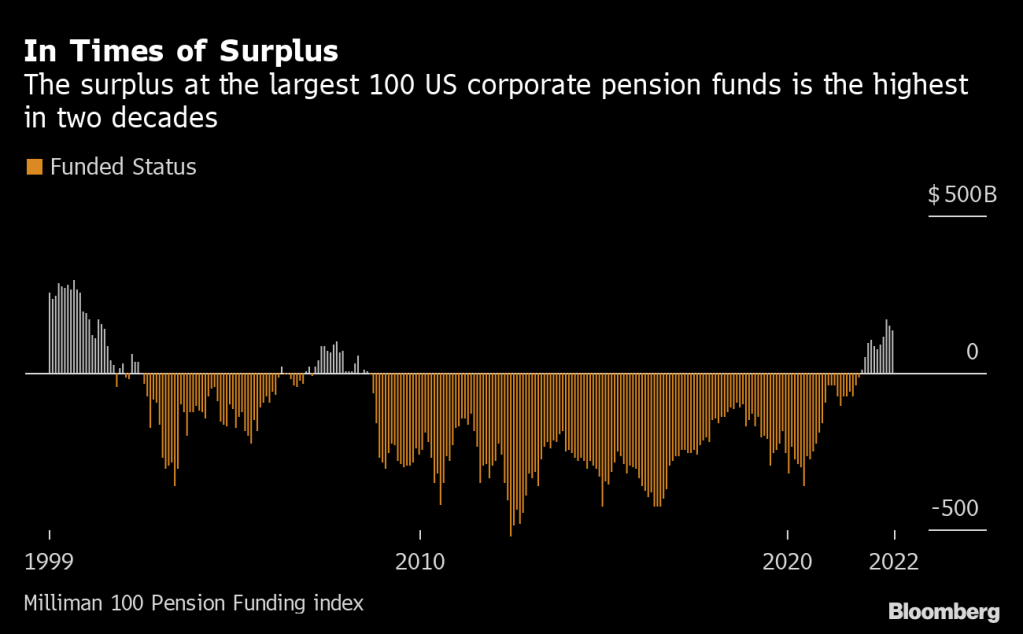
One of the pillars of the trillion-dollar pension fund complex is now awash in cash after struggling under deficits for two decades. This rare surplus at corporate defined-benefit plans, thanks to surging interest rates, means they can reallocate to bonds that are less volatile than stocks — “derisking” in industry parlance.
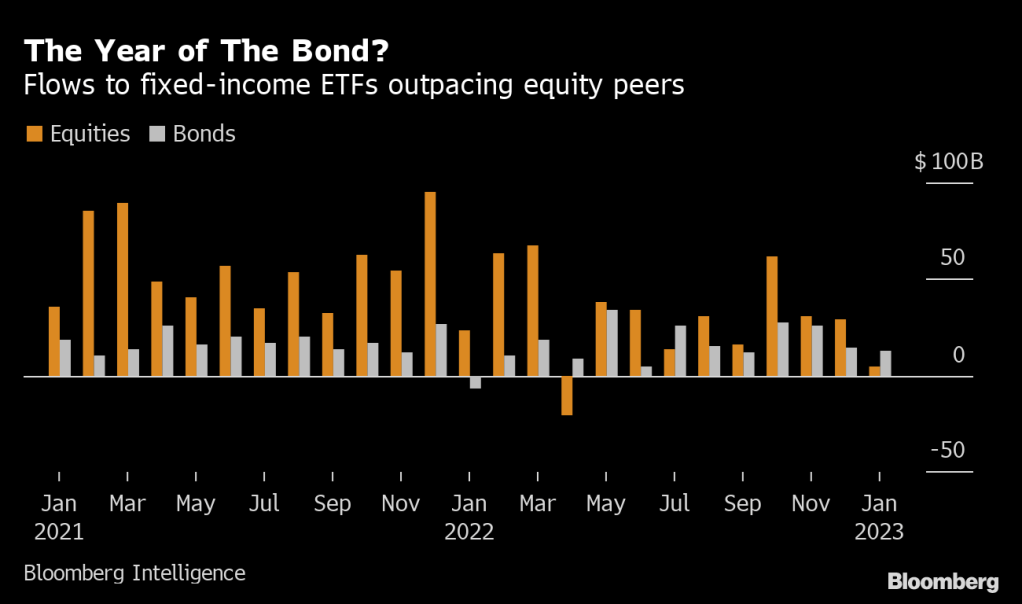
Strategists at Wall Street banks including JPMorgan Chase & Co., Bank of America Corp. and Wells Fargo & Co. say the impact will be far-reaching in what’s already being coined “the year of the bond.” Judging from the cash flooding into fixed income, they’re just getting started.
“The pensions are in good shape. They can now essentially immunize — take out the equities, move into bonds and try to have assets match liabilities,” Mike Schumacher, head of macro strategy at Wells Fargo, said in an interview. “That explains some of the rallying of the bond market over the last three or four weeks.”
An irony of pension accounting is that a year like last year, with its twin routs in stocks and bonds, can be a blessing of sorts to some benefit plans, whose future costs are a function of interest rates. When rates climb, their liabilities shrink and their “funded status” actually improves.
The largest 100 US corporate pension plans now enjoy an average funding ratio of about 110%, the highest level in more than two decades, according to the Milliman 100 Pension Funding index. That’s welcome news for fund managers who suffered years of rock-bottom interest rates and were forced to chase returns in the equity market.
Now, they have an opportunity to unwind that imbalance and Wall Street banks pretty much agree on how they’ll use the extra cash to do it: buying bonds, and then selling stocks to buy more bonds.
Already this year fixed-income flows are outpacing those of equity funds, marking the most lopsided relationship since July.
How much of that is due to derisking by pension funds is anyone’s guess. Some of the recent rally in bonds can be ascribed to traders hedging a growth downturn that would hit stocks hardest.
But what’s obvious is their clear preference for long-maturity fixed-income assets that most closely match their long-dated liabilities.
Pension funds need to keep some exposure to stocks to boost returns, but that equation is changing.
Once a corporate plan reaches full funding, their aim is often to derisk by jettisoning stocks and adding fixed income assets that line up with their liabilities. With the largest 100 US corporate defined benefit funds riding a cash pile of $133 billion after average yields on corporate debt more than doubled last year, their path is wide open.
With yields unlikely to go above their peak level once the Federal Reserve hits its terminal rate of about 5% around the middle of the year, there’s rarely been a better time for them to make the switch to bonds.
Even if growth surprises on the upside and yields rise, causing bonds to underperform, the incentive is still there, said Bruno Braizinha, a strategist at Bank of America.
“At this point and considering where we are in the cycle, the conditions are favorable for de-risking,” Braizinha said in an interview.
JPMorgan’s strategist Marko Kolanovic estimates derisking will lead pension managers to buy as much as $1 trillion of bonds; Bank of America’s Braizinha says a $500 billion buying spree is closer to the mark.
How about gold? As the probability of a US debt default looms (as Bride of Chucky Schumer stomps his feet and says ” No budget cuts!”) and the US Treasury 10Y-3M yield curve remains inverted, gold is soaring.
Perhaps pension funds should by gold rather than cryptos.
Kansas City is a wonderful city. But the KC Fed’s Services Survey is not. In fact, it plunged to -11 for January. Rough start to the new year.
The decline in the KC Fed survery mirrors that of other regional Fed indices, indicating a slowdown in the US economy as The Fed withdraws the monetary punch bowl,
Despite the hoopla, remember that US Real GDP growth only grew at less than 1% on a year-over-year basis in 2022.


You must be logged in to post a comment.