Buckaroo! Why The Fed Won’t Be Able To Contain Inflation (Taylor Rule Suggests A Target Rate Of 23.30%, A Bridge Too Far)

The Federal Reserve has behaved like buckaroos! Why? Since the financial crisis, The Fed has left its enormous monetary stimulus outstanding for too long.

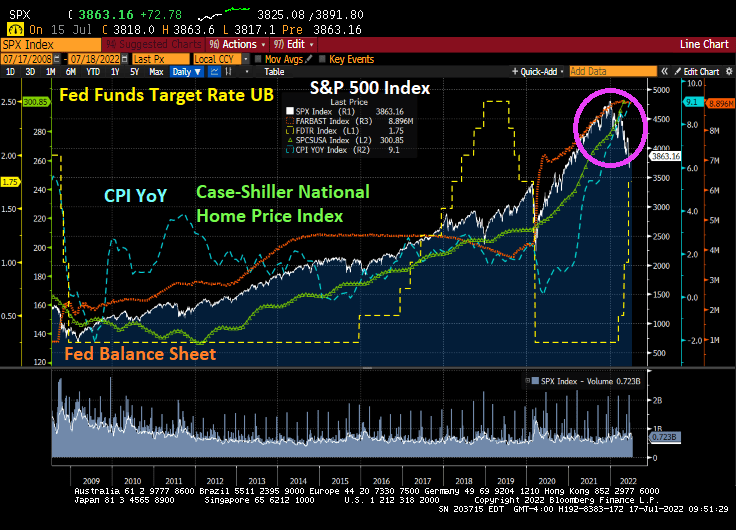
The Fed initiated asset purchases in a series of moves (aka, QE) culminating in Covid QE that has been barley removed. With The Fed’s stimulypto (and Federal spending), we have seen the S&P 500 index soar along with home prices.

Of course, this begs the question as to whether the stock market and housing market can withstand The Fed’s tightening plans.
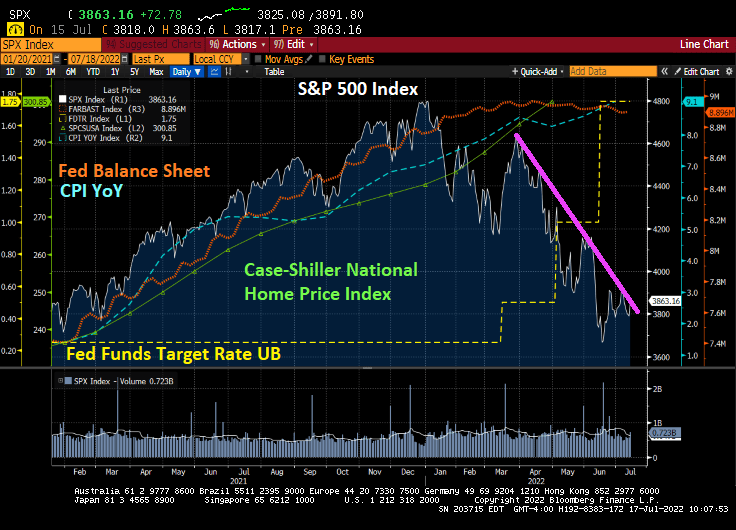
A closer look at the S&P 500 index and the Case-Shiller National home price index under Biden. The S&P 500 has been declining since The Fed started their monetary tightening. But the Case-Shiller National home price index as of April ’22 was still soaring.
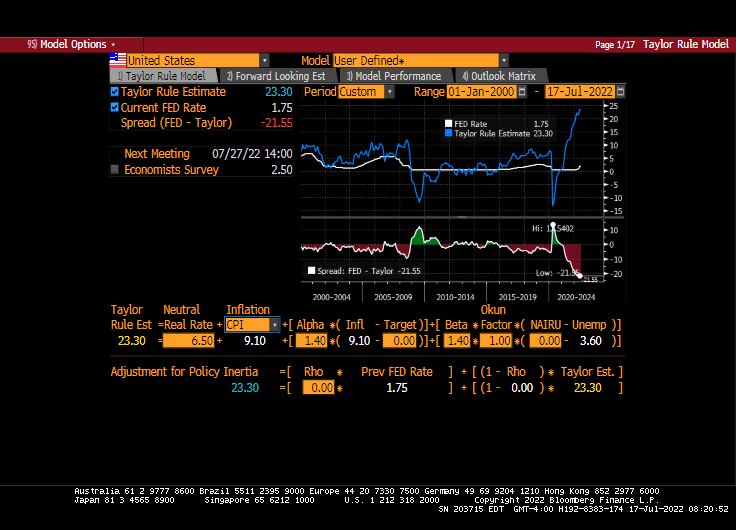
With inflation at a 40-year high, the Taylor Rule suggests a Fed target rate of … 23.30%. It is currently at 1.75%. That is an unrealistic target rate that The Fed will never do. It is, in fact, a Bridge Too Far.
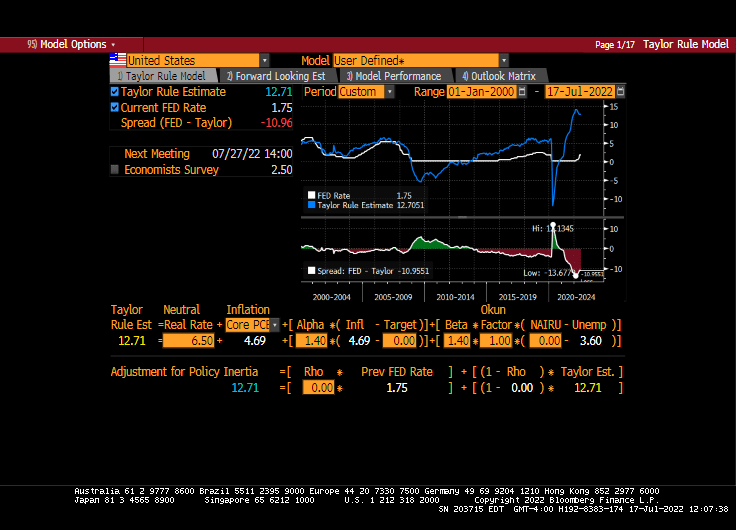
How about the Taylor Rule using Core PCE? It is still 12.71%. Still a bridge too far!
Markets are conditioned to massive Fed stimulypto, so how will markets react to stimulus reduction?

While The Fed is intent on withdrawing SOME of the enormous monetary stimulus, they are still buckaroos. And Biden/Congress still want to distort markets by Federal spending such as the Build Back (Inflation) Better bill that Manchin has blocked … so far.

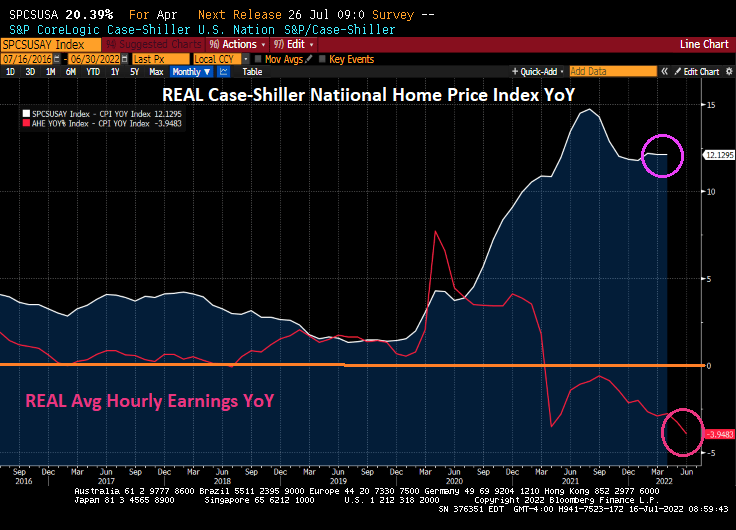
Simply Unaffordable? Or Is The Fed Killing-off Housing In Its Quest To Crush Inflation? (REAL Home Price Growth Is 12% YoY While REAL Wage Growth Is -3.95% YoY)

Housing in the US is simply unaffordable for the middle class and low-wage workers. Combine rising food costs and gasoline/heating costs, and we have an economic disaster on our hands.

US existing home sales for June will be released on Wednesday. But can The Fed kill-off home price inflation?

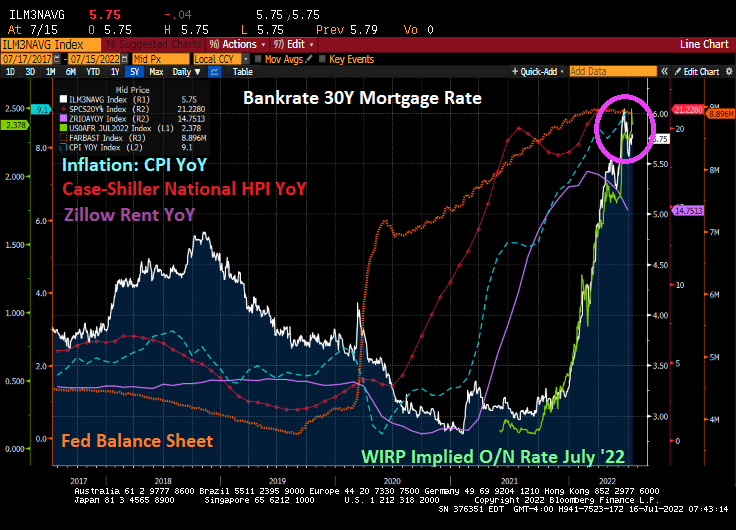
A preliminary analysis of existing home sales for June is for a seasonally adjusted annual rate of 5.1 million, down 5.4% from May and down 14.2% from last June. As The Fed cranks up its target rate (green line) and eventually shrinking its balance sheet, we will see further shrinking of existing home sales this summer.

But home price inflation remains high (Case-Shiller National home price index at 21.23% YoY, Zillow’s rent index at 14.75% YoY) while the Consumer Price Index YoY is at 40-year high of 9.1% YoY. In other words, home price inflation is 233% of the stated inflation rate from Uncle Sam.

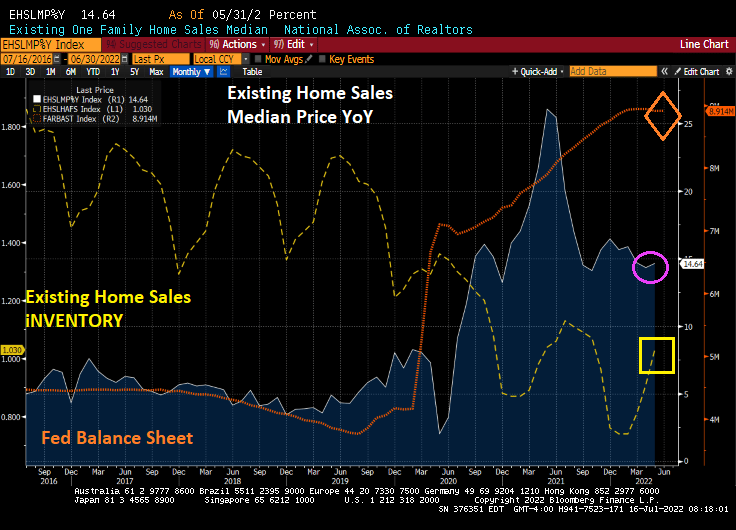
May’s existing home sales report was … sobering. There is still historically low levels of available inventory and median sales price of existing home sales was 14.64% YoY. Of course, the alternative to ownership is renting which is growing at 14.75% YoY. Simply unaffordable.

The gap between REAL home price growth (12.13% YoY) and REAL average hourly earnings (-3.95% YoY).

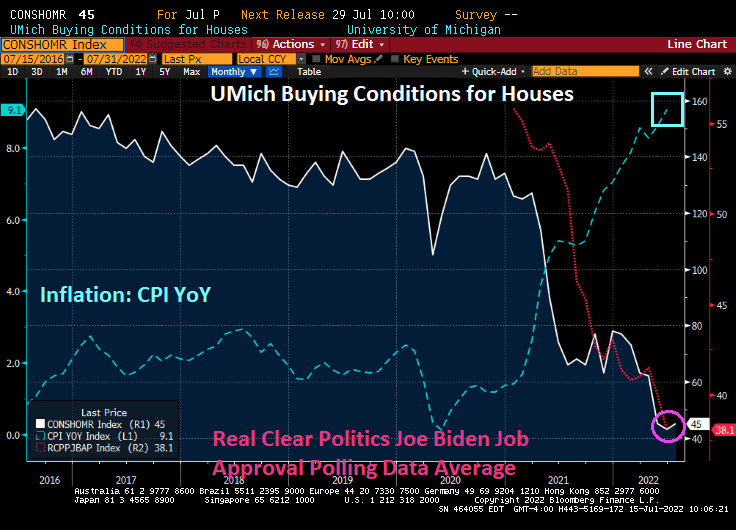
Consumer sentiment for housing is near the lowest level since 1982.

The Fed seems determined to remove the punch bowl in its efforts to crush inflation. But will The Fed’s efforts also crush the housing and mortgage market?

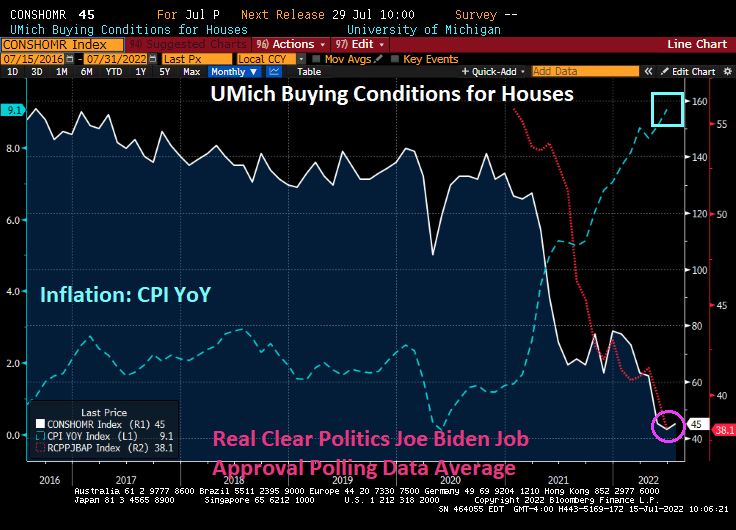
Biden’s Limbo Rock! US Consumer Confidence Remains Depressed 51.1 With Inflation Ravaging Households, Housing Sentiment Even Worse At 45 (Biden Approval At 38.1%)

How low will consumer sentiment (and Biden’s approval ratings) go? This is Biden’s limbo rock.

One measure of how bad things are in the US for the middle-class and low-wager workers ix consumer sentiment from University of Michigan. The latest University of Michigan survey of consumers remains depressed at 51.1.

The consumer sentiment index was at 80.7 at the beginning of 2021, but has plunged dramatically with rising gasoline, food and inflation in general. Biden’s popularity has sunk from 55.8 in January 2021 to 38.1 today.

How about housing sentiment? Housing sentiment was 134.0 in January 2021 but has plunged to a depressing 45 with inflation and rising home prices (and rent). And with declining sentiment about housing, Biden’s popularity has plunged.

Yes, this is Biden’s limbo rock. How low will his popularity go?

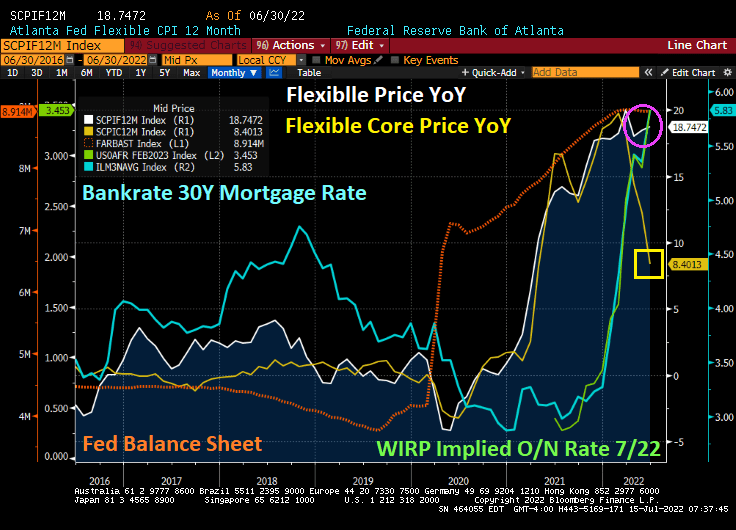
The Core? Flexible Price Inflation Rises To 18.74% While Core Inflation Plunges To 8.40%, “Fats” Waller Backing 75 Basis Point Hike (30Y Mortgage Rate Rises To 5.83%)

As Americans are painfully aware, inflation is the highest in 40 years prompting The Federal Reserve to remove the massive punch bowl. In fact, Federal Reserve Governor Christopher “Fats” Waller backed raising rates by 75 basis points this month.

How hot was the recent inflation report? The Atlanta Fed’s flexible price index rose to 18.74% YoY. On the other hand, the CORE flexible price index (less energy and food) plunged to 8.46% YoY. The 30-year mortgage rate from Bankrate rose slightly to 5.83% as the implied overnight rate for the July FOMC meeting rose to 3.45%.

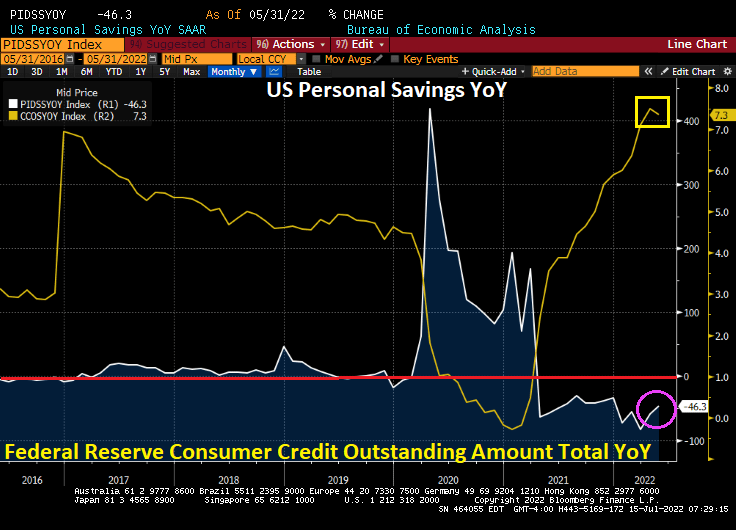
Inflation is ravaging consumers with the savings rate falling by -46.3% YoY while consumer credit rose 7.3% YoY. Yes, thanks to high inflation, consumers are saving less and borrowing more.

When even CORE flexible price inflation is 8.40% YoY, you know that The Fed and Federal government have made serious policy errors.

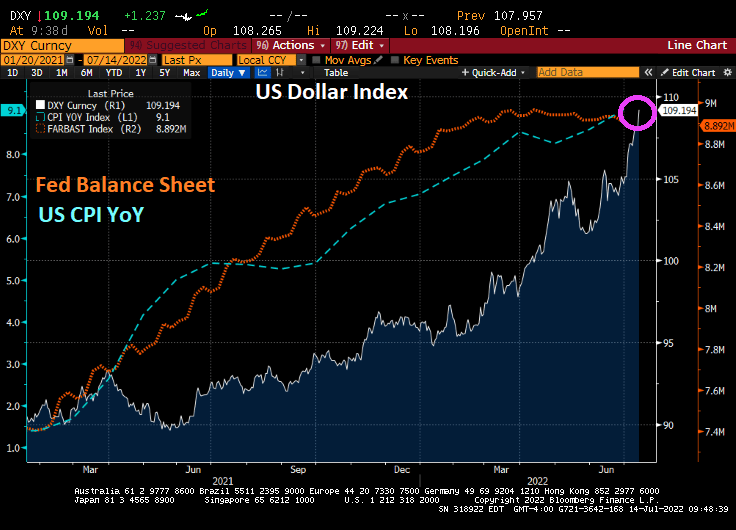
Bottle Of Wine? Strong US Dollar And Soaring Inflation Is A Brutal Cocktail For S&P 500 Firms (Will The Fed Pivot To QE Again?)

The US Dollar keeps strengthening as inflation skyrockets. Good news?

Bear in mind that a strong dollar is a two-edged sword. The US Dollar Index has risen 16% year-over-year, presenting a big hurdle for US firms with business overseas.

That strength of the greenback will rise until the Fed makes a dovish policy pivot.

And that pivot is forecast to occur at the Feb ’23 FOMC meeting.

But will The Fed pivot?

The Biden Cocktail. A fine wine turned to vinegar.
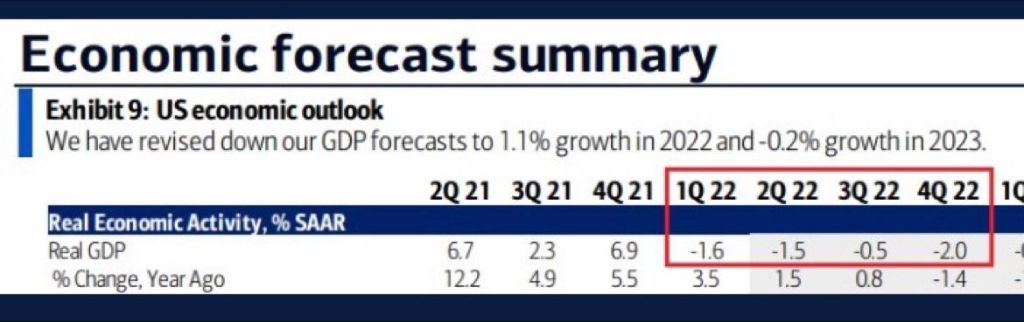
Let’s Get Ready To Stumble! Bank Of America Predicts 4 Straight Quarters Of Negative Real GDP Growth

Let’s get ready to stumble!

Bank of America is predicting 4 straight quarters of negative real GDP growth.

2022 is shaping up for a bad year.

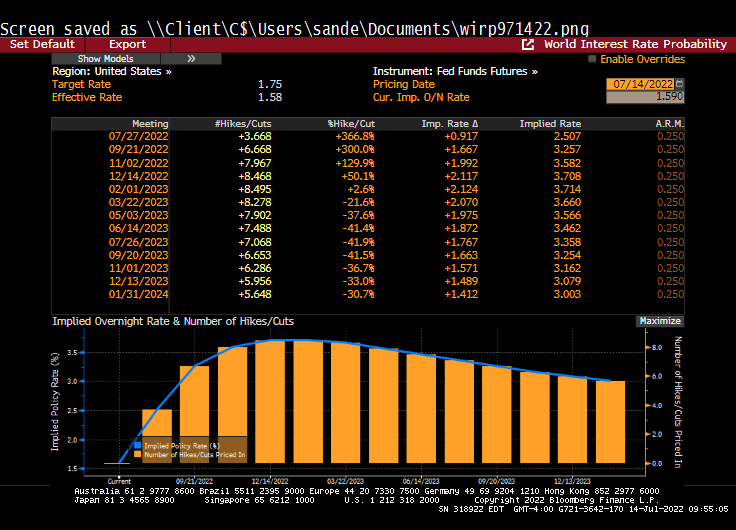
The Shallows! Traders Fully Price 75-Basis-Point Fed Hike at July Meeting As Mortgage Rates Decline Slightly (Fed Fighting Inflation At All Costs!)

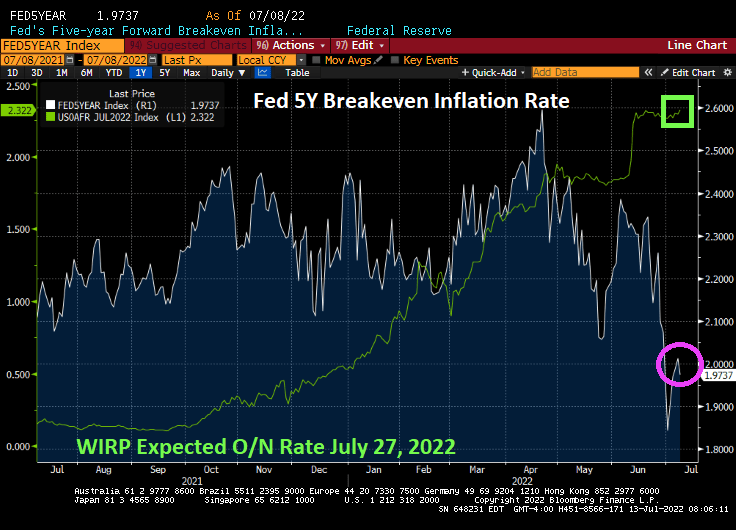
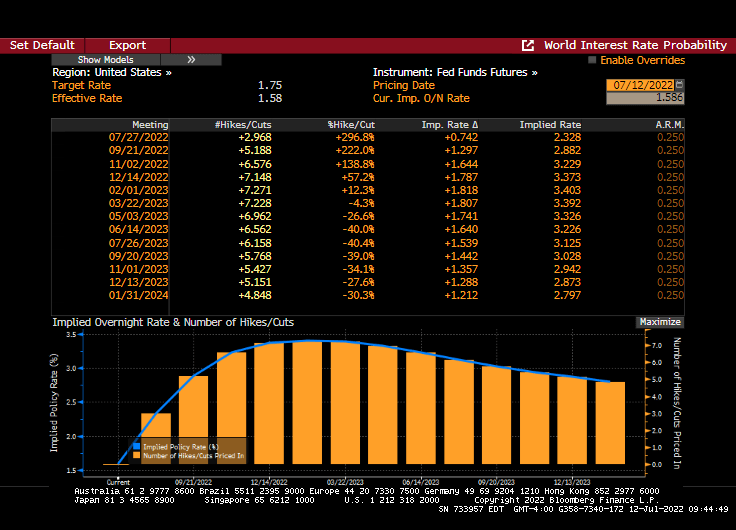
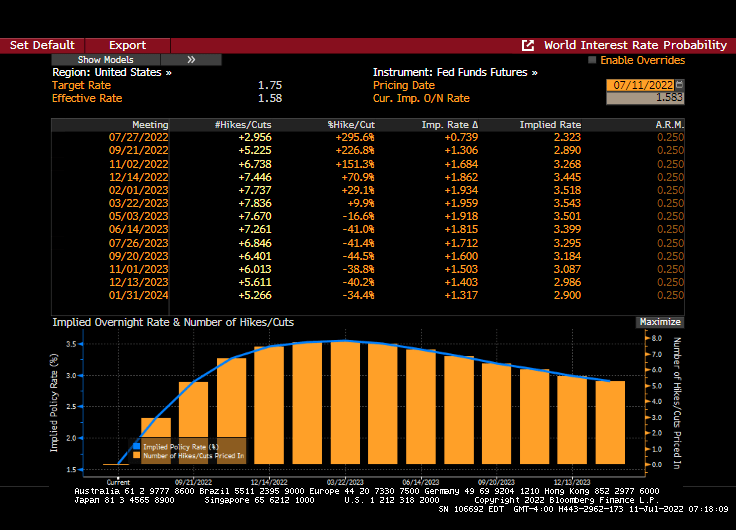
Here we go loop de loop! Traders are pricing in a 75 basis point rate increase at the July FOMC meeting despite collapsing Fed 5-year inflation breakeven rates.

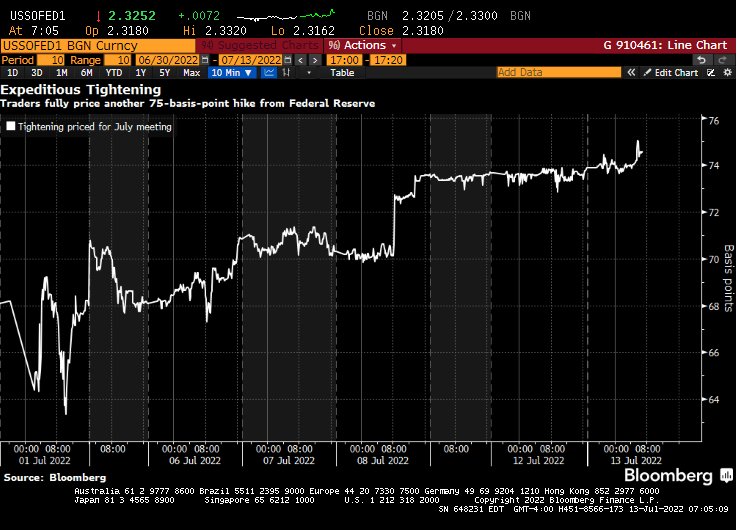
Money markets are betting on a three quarter-percentage point hike by Federal Reserve officials later this month, wagering the US will need to ramp up the pace of monetary tightening to tame inflation.

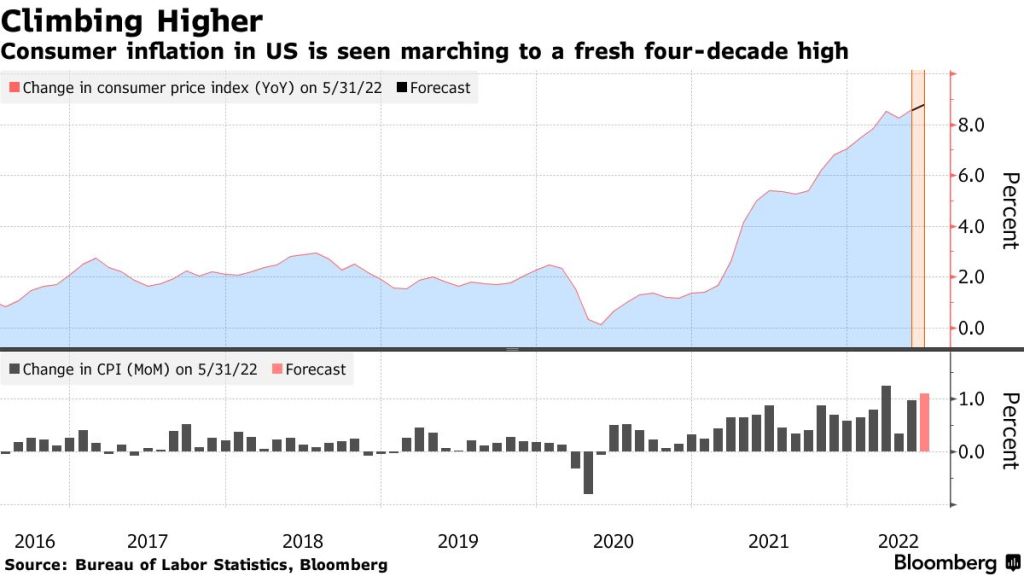
The repricing comes ahead of a key inflation report due Wednesday. The headline figure for June is set to accelerate to 8.8% year over year, the highest since 1981.

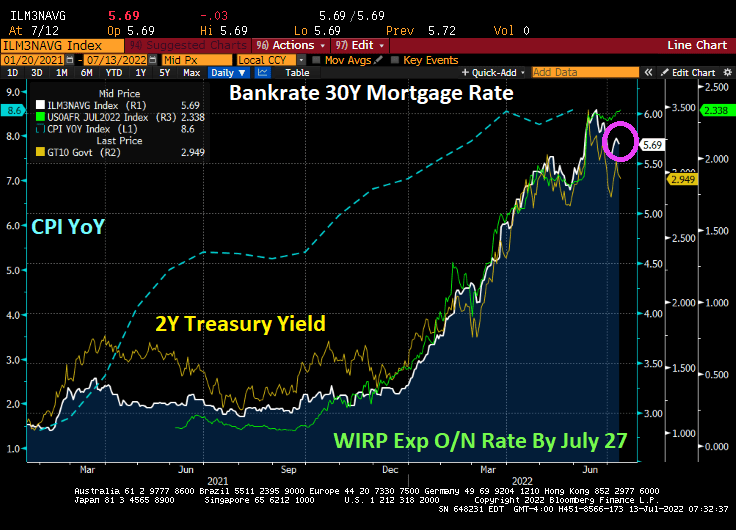
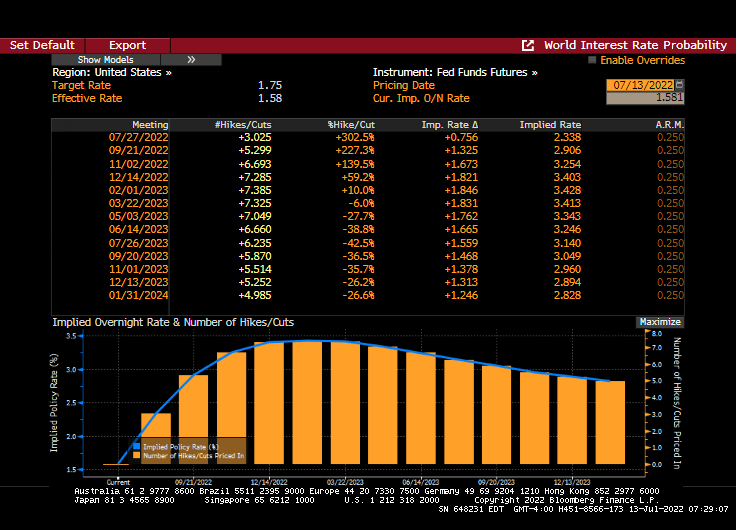
Bankrate’s 30Y mortgage rate fell slightly ahead of today’s inflation report with the expectation of The Fed hiking their target rate by 75 basis points to 2.338% at the July 27th Fed Open Market Committee meeting.

Trader expectations from Fed Funds Futures data:

Last night I watched “The Shallows” on Peacock TV. I thought from the title that it was going to be a biography of The Federal Reserve, but it was a film about a surfer being attacked by a shark.

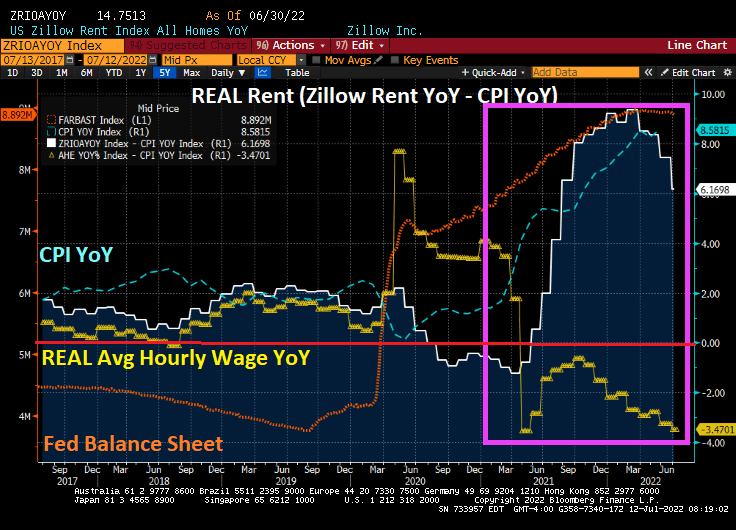
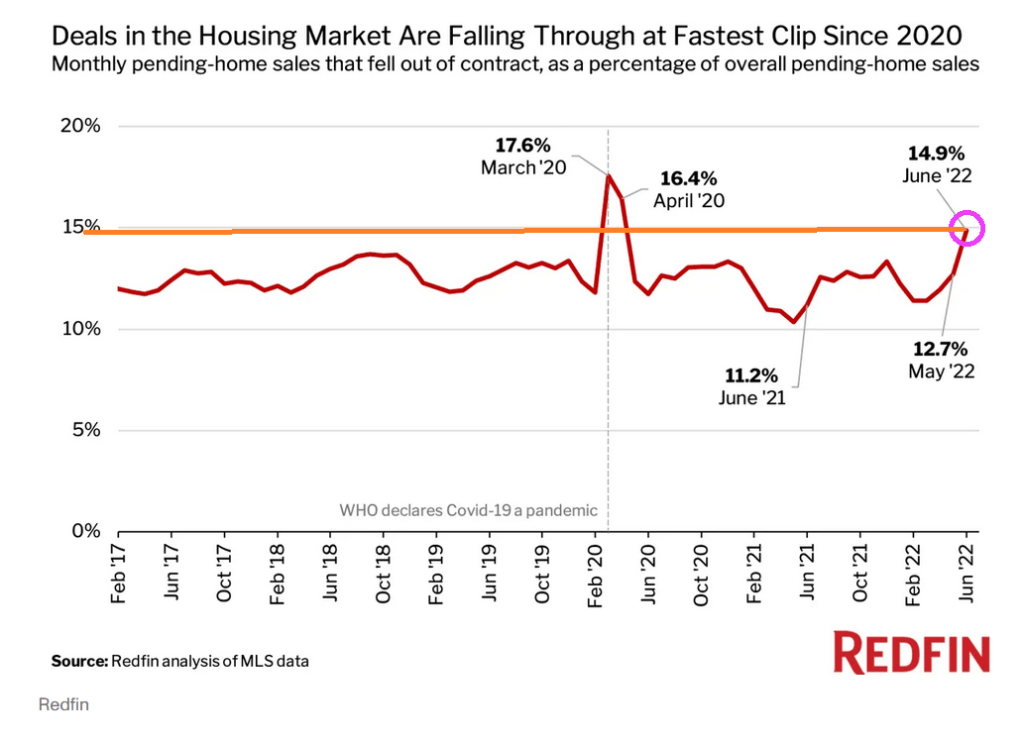
The Great Divide … In Affordability! REAL Rents Rising At 6.16% YoY As REAL Hourly Earnings Declining At -3.47% YoY (Growing Homelessness And Rise In Home Sale Cancelled Transactions)

We are across the great divide! In terms of house prices and affordability.

We are all aware that inflation is soaring, since the Covid outbreak in 2020 and the massive overaction by The Federal Reserve and Federal government in terms of stimulus spending and economic lockdowns.

Things were “normal” before Covid in that REAL housing rent (white line) and REAL average hourly earnings YoY (yellow line) moved together. But after Covid shutdowns and Federal stimulus “relief” (orange line), we see that inflation (blue line) took off along with the growth in housing rent. The problem, of course, is that REAL average hourly earnings YoY has been declining. I call this “The Great Divide in housing affordability”.

The question, of course, is whether The Federal Reserve will continue their “war on inflation” with a 75 basis point rate increase.

Inflation is at its fastest pace in 40 years, and is expected to increase even higher in tomorrow’s inflation report.

Gasoline prices have been dropping recently, but remain above $4.50 per gallon (regular gas price was $2.40 per gallon on Biden’s inauguration day. And no, it wasn’t the Biden Administration selling nearly 1 million barrels of crude oil from the strategic petroleum reserve to the Chinese government-owned Sinopec that Biden’s son Hunter is an investor (so, The Big Guy aka Joe Biden gets a 10% piece of the action). It is a slowing global economy that is helping to lower gasoline prices.

Between soaring gasoline prices and soaring home rents, it is little wonder that there is a serious homeless problem in places like New York and California.

With rising mortgage rates, we are seeing a surge in pending home sales cancellations.

Atlanta Fed’s Raphael Bostic thinks that the US economy is so strong that it can easily handle a 75 basis point increase at the next FOMC meeting. Fortunately, he is not a voting member.

I wonder if Joe Biden sings “Carry On My Wayward Son” to Hunter?

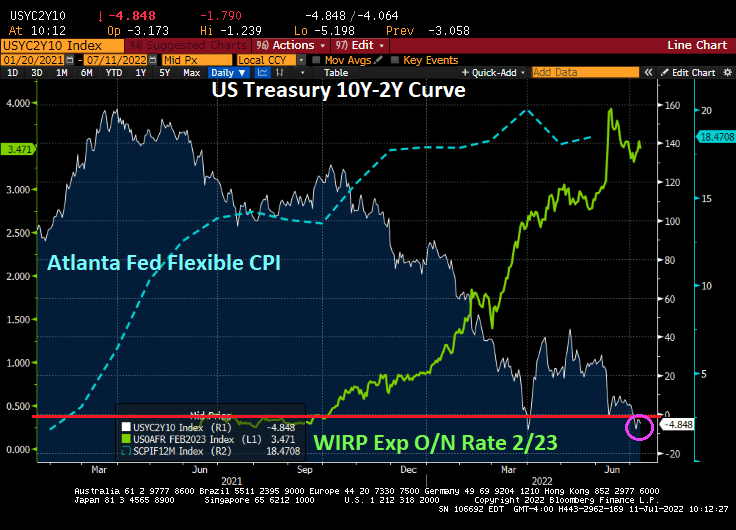
Slippin’ Into Darkness! US Treasury 10Y-2Y Curve Inverts To -4.85 BPS (Fed Expected To Reverse Tightening In March 2023)

The US economy is slippin’ into darkness.

The US Treasury 10Y-2Y yield curve steepened after Biden’s inauguration as President, a sign of economic optimism. Then reality began to dawn when inflation began to surge (blue line). Then The Fed stepped in to combat inflation by signaling an increase in their target rate (green line). The result? The 10Y-2Y Treasury curve is inverted at -4.85 BPS, generally an indicator of an impending recession.

But never fear! The Feral Reserve is expected to reverse its rate increases by March 2023.

So, it looks like The Fed will be returning to its “low rider” rate policies in early 2023.

In other words, hold on, The Fed is coming. Again.

Money! About That June Jobs Report (The Fed’s Balance Sheet Still Out In Force!)

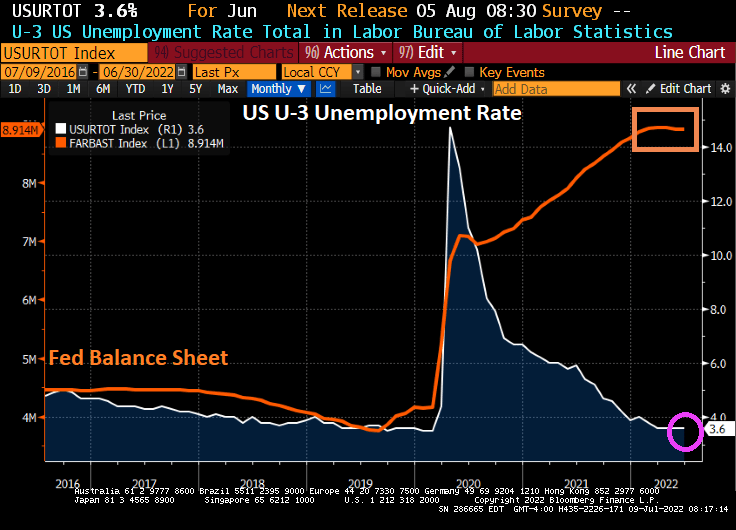
The Federal Reserve’s policies remind me of the Cabaret tune “Money.” There is still almost $9 trillion in monetary stimulus outstanding.

For all the economic cheerleaders out there like CNBC about the June job report, they generally ignore what is driving the jobs report: The Federal Reserve!

Take the US U-3 unemployment rate. The Biden Administration is proud of the unemployment rate of 3.6%. But if you look at the chart of unemployment relative to The Fed’s balance sheet expansion due to Covid lockdowns, there is still almost $9 trillion of Fed stimulus outstanding.

Of course, the lockdowns were pure economy killers, so opening the economies again led to the unemployment rate falling to 3.6% which is still higher than before the Covid outbreak. But The Federal Reserve has been painfully slow at shrinking its balance sheet, leaving almost $9 trillion in monetary stimulus outstanding.

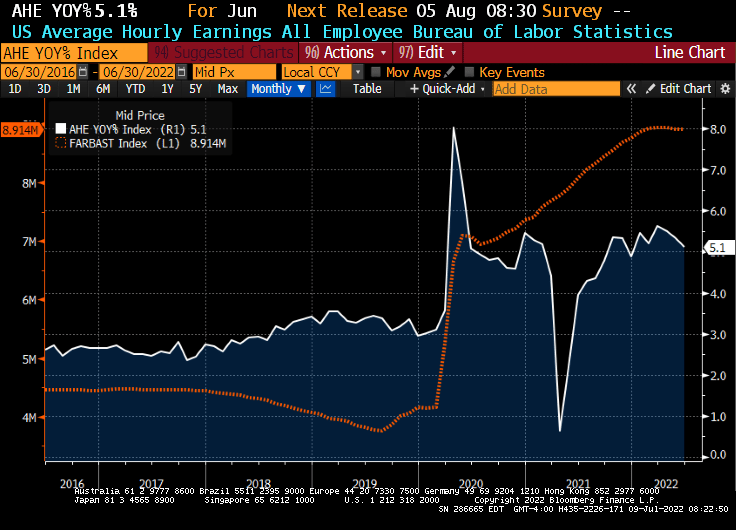
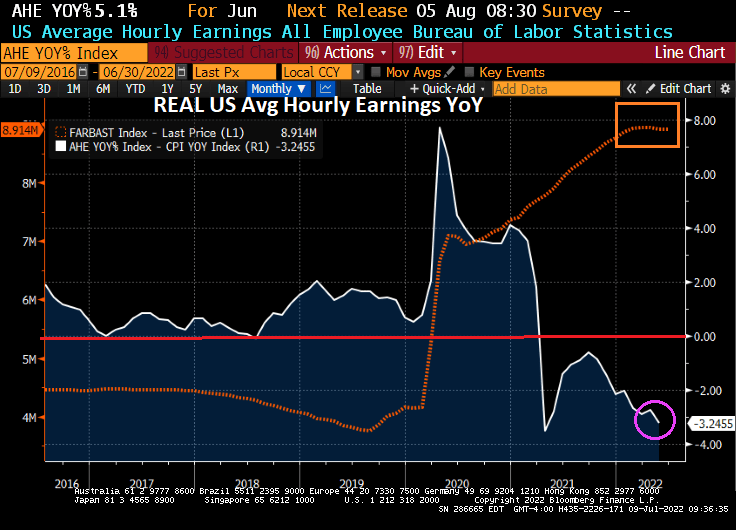
Take average hourly earnings growth. The media is all smiles as US wage growth declined to 5.1%, much higher than pre-Covid.

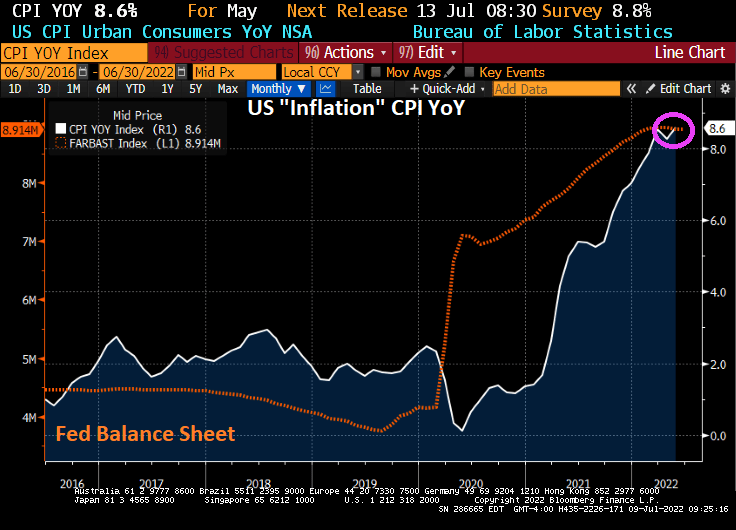
Then we have inflation, at 40-years highs thanks to massive Fed stimulus (and Federal spending).

And if we deduct inflation from average hourly wage growth, we see REAL wage growth declining at a -3.25% YoY clip.

Lastly, we have the US Dollar. Nothing has been the same since the financial crisis of 2008 and the entrance of The Federal Reserve distorting the economy and prices. Not to mention the US Dollar.

The Fed leaving its monetary stimulus out in force for so long is a major policy error. So what happens when The Fed actually gets serious about withdrawing the monetary stimulus (likely after the midterm elections)?