I am no forune teller, but this doesn’t look to good for old Joe (Biden).
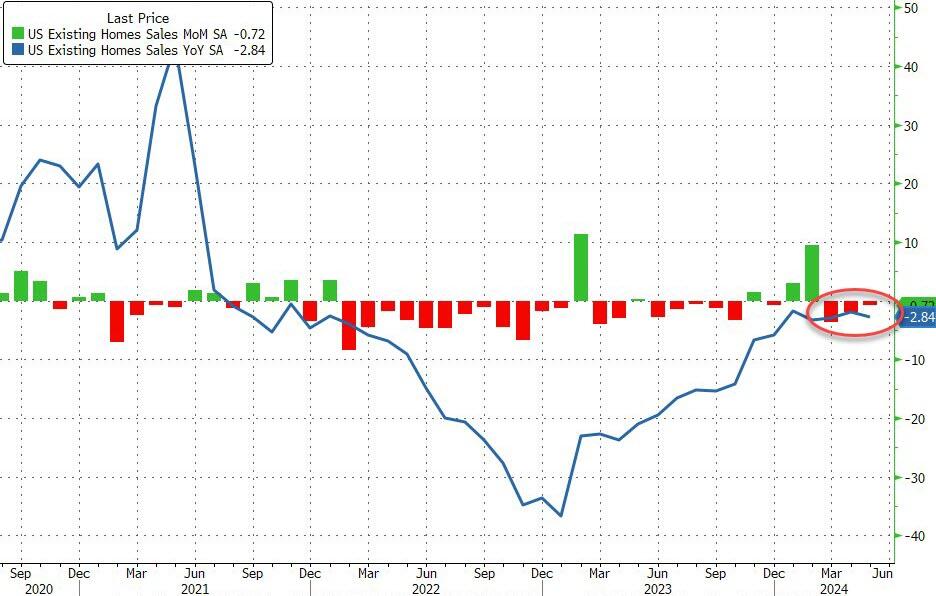
Existing home sales fell -2.8% YoY in May.
US existing home sales fell for the third straight month in May (-0.7% MoM vs -1.0% exp). This left home sales down 2.8% YoY (YoY sales have not increased since July 2021)…
Source: Bloomberg
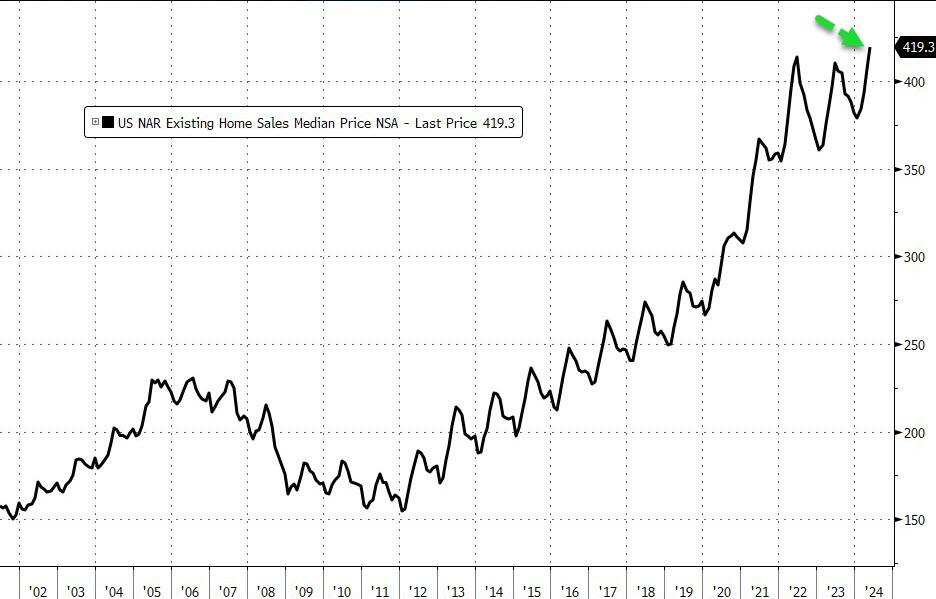
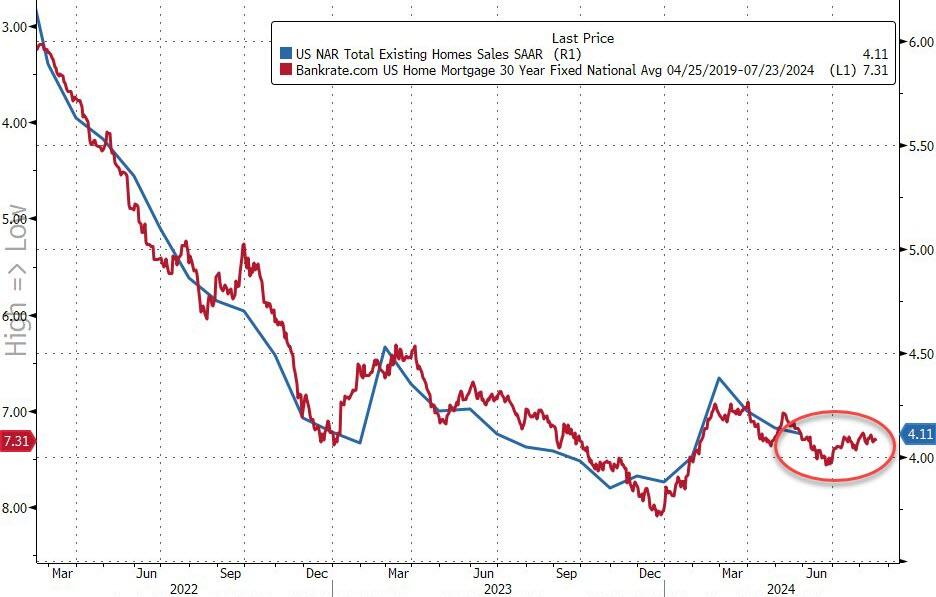
The total home sales SAAR is push back towards COVID lockdown lows once again at 4.1mm, but prices accelerated to a new record high…
Source: Bloomberg
“Home prices reaching new highs are creating a wider divide between those owning properties and those who wish to be first-time buyers,” NAR Chief Economist Lawrence Yun said in a statement.
“Eventually, more inventory will help boost home sales and tame home price gains in the upcoming months.”
And given that mortgage rates remain stubbornly above 7%, existing home sales show no signs of improving anytime soon…
Source: Bloomberg
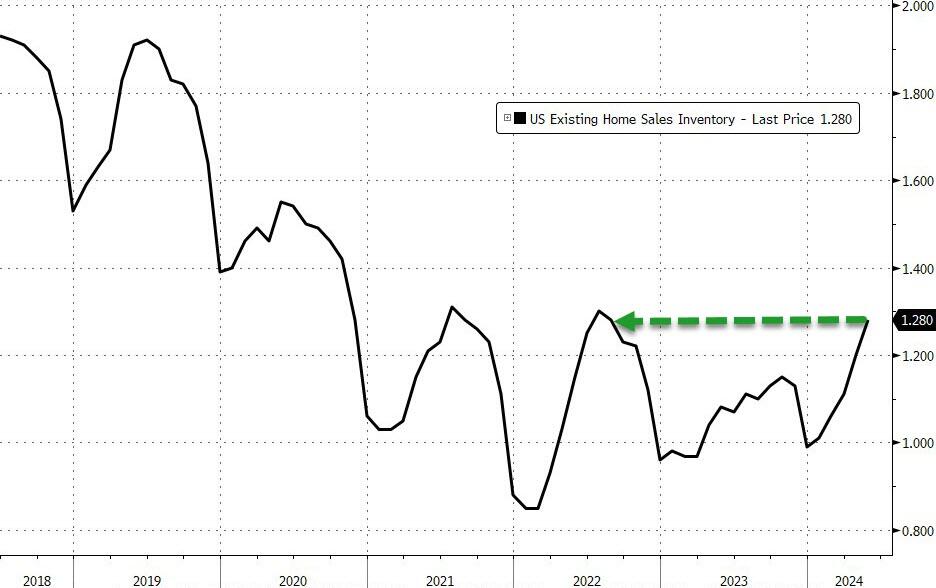
The supply of homes on the market increased 18.5% from the same month last year to 1.28 million, but it’s still well below the level seen before the pandemic when mortgage rates were much lower.
Source: Bloomberg
About 67% of the homes sold were on the market for less than a month in May, roughly flat from the prior month, while 30% sold above the list price. Properties remained on the market for 24 days on average in May, compared with 26 days in April, NAR’s report said.
This prediction only got warmer two months later when, inexplicably, Japan’s Norinchukin bank, best known as Japan’s CLO whale, was quietly added to the list of counterparties for the Fed’s Standing Repo Facility, a/k/a the Fed’s foreign bank bailout slush fund.
But if that was the first, and still distant, sign that something was very wrong at one of Japan’s biggest banks (Norinchukin is Japan’s 5th largest bank with $840 billion in assets) today the proverbial canary stepped on a neutron bomb inside the Japanese coalmine, because according to Nikkei, Norinchukin Bank “will sell more than 10 trillion yen ($63 billion) of its holdings of U.S. and European government bonds during the year ending March 2025 as it aims to stem its losses from bets on low-yield foreign bonds, a main cause of its deteriorating balance sheet, and lower the risks associated with holding foreign government bonds.”
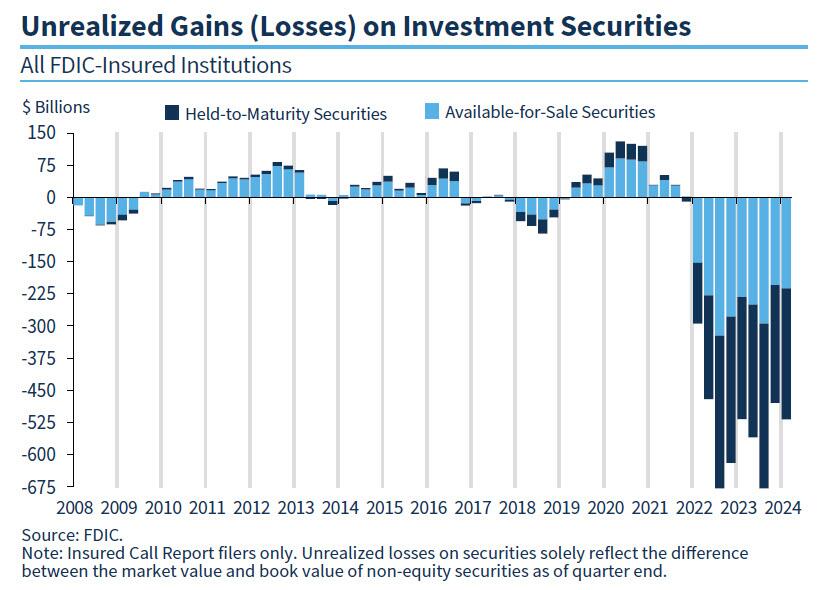
See, what’s happened in Japan is not that different from what is happening in the US, where as the FDIC keeps reminding us quarter after quarter, US banks are still sitting on over half a trillion dollars in unrealized losses, as a result of the huge jump in interest rates which has blown up the banks’ long-duration fixed income holdings, sending them trading far below par and forcing banks (and the Fed, see BTFP) to come up with creative ways of shoving these massive losses under the rug.
And while Japanese rates have barely budged – the BOJ only just raised rates for the first time in decades in April – the move is already cascading into the form of huge losses for domestic banks, which have been hammered twice as hard due to their holdings of offshore debt which until 2021 was viewed as risk free, only to blow up in everyone’s face two years ago when the bull market since the early 1980s ended with a bang.
Enter Norinchukin: according to the Nikkei, the company’s net loss for the year ending March 2025, which was previously forecast to top 500 billion yen, will rise to the 1.5 trillion yen level with the bond sales.
“We plan to sell low-yield [foreign] bonds in the amount of 10 trillion yen or more,” Norinchukin Bank CEO Kazuto Oku told Nikkei, an amount just above $60 billion.
Facing a problem that is very familiar to all US banks, Oku said the bank “acknowledged the need to drastically change its portfolio management” to reduce unrealized losses on its bonds, which totaled roughly 2.2 trillion yen as of the end of March. Oku explained bank’s intention to shift its investments, saying, “We will reduce [sovereign] interest rate risk and diversify into assets that take on corporate and individual credit risk.”
Now, if Nochu, as it is affectionately known by bankruptcy lawyers, was a US bank circa one year ago, it would not have to sell anything: it could just pledge all of its sharply depreciated bonds at the Fed’s BTFP facility, and get a par value for them.
Unfortunately, Nochu is not US but Japanese, and it is not 2023 but rather 2024, when the high-rate disaster of 2023 was supposed to be over. Supposed to be… but instead it’s only getting worse. Regular readers will hardly need it, but for novices Nikkei gives the following quick primer: “Interest rates in the U.S. and Europe have risen and bond prices are down. This reduced the value of high-priced (low-yielding) foreign bonds that Norinchukin purchased in the past, causing its paper losses to swell.”
So faced with no other options, Nochu is doing the only thing it can: an orderly liquidation of tens of billions of securities now, when they are still liquid and carry a high price, in hopes of avoiding a disorderly liquidation and much worse, in a few months when the bond market freezes up.
And yes, the Japanese rates canary is quite, quite massive: as of the end of March, Norinchukin had approximately 23 trillion yen of foreign bonds (about $150 billion), amounting to 42% of its total 56 trillion yen of assets under management.
To get some sense of the scale, according to the Bank of Japan, outstanding foreign bonds held by depositary financial institutions amounted to 117 trillion yen as of the end of March. Norinchukin, which is a major institutional investor in Japan, holds as much as 20% of the total on its own! And those asking, yes: once Nochu begins selling, all others will have to join the club!
But why start the selling now? Because, as we warned last October when we predicted that the next bank crisis will be in Japan, the Japanese mega-bank now believes interest rate cuts in the U.S. and Europe are likely to take longer than it previously expected, it will try to significantly cut its unrealized losses by selling foreign bonds in fiscal 2024.
And so, Norinchukin plans to sell over 10 trillion yen in foreign bonds, in addition to its normal trading activities.
The rest of the story is filler: in attempt to divert attention from the 10 trillion yen elephant in the room, the Nikkei then wastes time discussing the bank’s other “alternatives” to wit:
The company is now considering investment alternatives, including equities, corporate bonds, corporate loans and private equity, as well as securitized products such as corporate loan-backed securities and mortgage-backed securities. By diversifying its portfolio, it aims to prevent unrealized losses from expanding to the point where they become a concern for management. It will also try to replace some low-yielding foreign government debt with other such bonds offering higher interest rates.
What are you talking about? What diversification? Once the selling begins, the bank will be lucky if it can get even a fraction of the proceeds it hopes for (because all the other banks won’t just be standing there twiddling their thumbs, as they wait to see how massively Nochu reprices the market).
And it’s not just banks: if and when the selling begins by a bank that holds 20% of all foreign bonds in Japan, the liquidation cascade will quickly spread to Mrs Watanabe. According to the U.S. Treasury Department, Japanese investors held $1.18 trillion of U.S. government bonds as of March, the largest slice among foreign holders.
Needless to say, but the Nikkei does so anyway, “Massive sales by Norinchukin could have a sizable effect on the U.S. bond market.”
And since we now know what is happening, it is only a matter of time before everyone else frontruns Norinchukin.
What happens next will be even uglier: since the bank will no longer be able to mask its fixed income losses under the guise of accounting sleight of hand, the bank’s financial results for the period ending March 2025 will “deteriorate significantly as a result of the huge divestment of foreign bonds and turn paper losses into real ones.” As of May, Norinchukin put its final loss at more than 500 billion yen, but this is now expected to reach the 1.5 trillion yen level.
A little more context: back in the immediate aftermath of the global financial crisis, in the year ending March 2009, Norinchukin posted a final loss of about 570 billion yen due to impairment of securitized products. The forecast loss for this fiscal year is expected to top the previous record by roughly 1 trillion yen. Nevertheless, Oku said that putting the losses on the books in the year ending next March will “improve [the bank’s] finances and portfolio, thus enabling to move into the black in the period ending March 2026.”
Spoiler alert: no it won’t… and that’s why the bank is now scrambling to share the pain with even greater fools, i.e., “investors.”
According to the Nikkei, Norinchukin Bank is considering raising 1.2 trillion yen to shore up its finances. It has already started discussions with Japan Agriculture Cooperatives, one of its main investors, and others. Of course, the question of who in their right mind would lend the bank good money to plug an even bigger hole that is about to open up, is anyone’s guess.
But that won’t stop the bank from doing what it has to, now that it has picked the liquidation route: and once the selling flood begins, it won’t end as these flashing red headlines from Bloomberg just confirmed:
*NORINCHUKIN TO SELL US, EUROPEAN SOVEREIGN BONDS GRADUALLY
*NORINCHUKIN ALSO WEIGHS LOCAL, OVERSEAS BONDS, PROJECT FINANCE
*NORINCHUKIN EYES ASSETS INCLUDING CLOS, STOCKS AFTER BOND LOSS
There’s a name for this: a firesale, but – drumroll – a “gradual” one, because that’s how firesales supposedly go in Japan.
Luckily, the one thing nobody has to guess, is what happens next: as the wonderful movie Margin Call laid out so very well, once you realize that the music has stopped, you have three choices: i) be first, ii) be smarter, or iii) cheat. In the case of Japan’s Norinchukin, it has decided the time has come to liquidate before everyone else. We wonder how “everyone else” will take this particular news…
US Treasury Secretary (and former Fed Chair) Janet Yellen says the US economy is in excellent shape. Is she a genius and sees something that rest of us don’t? Or is she a partisan thug like Shap Shot’s Gilmore Tuttle?
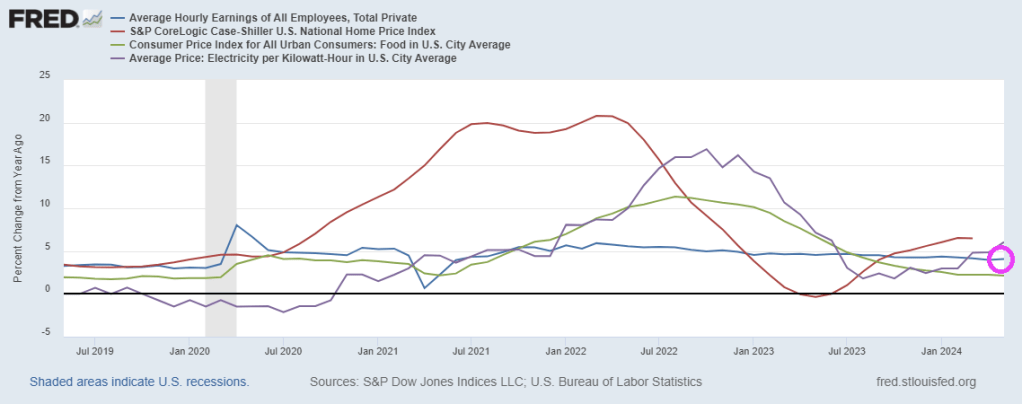
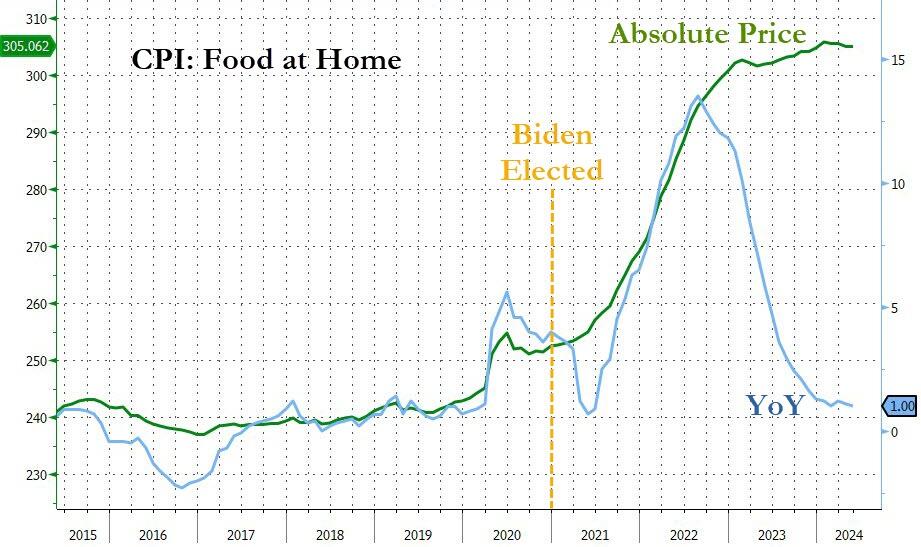
Yellen brags about rising wages and declining inflation. Well, average hourly earnings YoY are now 4.1%. However, home prices are growing at 6.5% year-over-year (YoY) and electricity prices are up 6.1% YoY. Food CPI grew at 2.1% in May. Yellen ignores the string of 10%+ increases in 2022-2023 making eating unaffoprdable for millions.
I doubt if Yellen could run a lemonade stand in my neighborhood. But like Gilmore Tuttle, maybe she could run a donut shop!
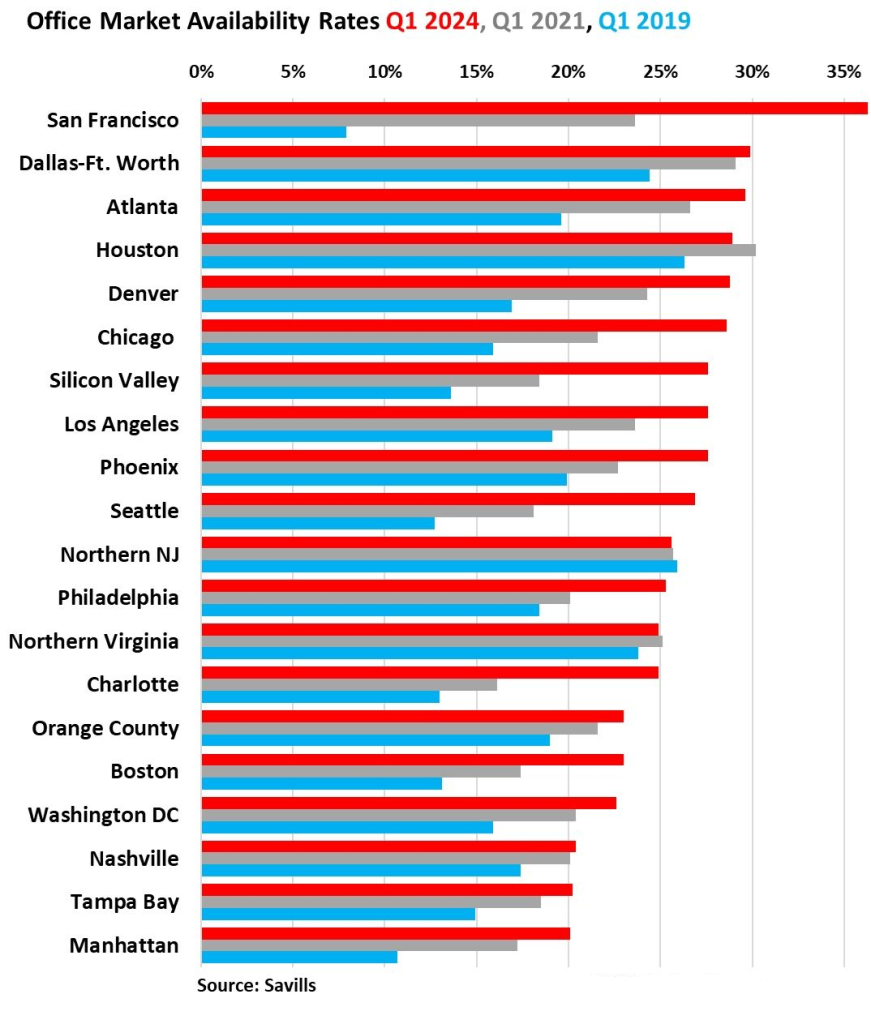
And the CRE office market is showing disaster. San Francisco office market availability rates have soared in Q1 2024 to over 35%, up from less than 10% in Q1 2019.
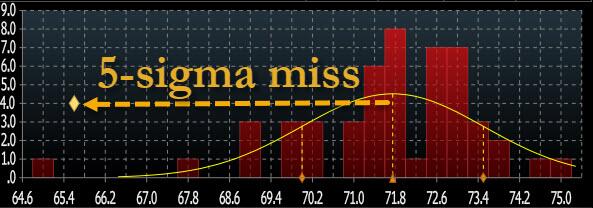
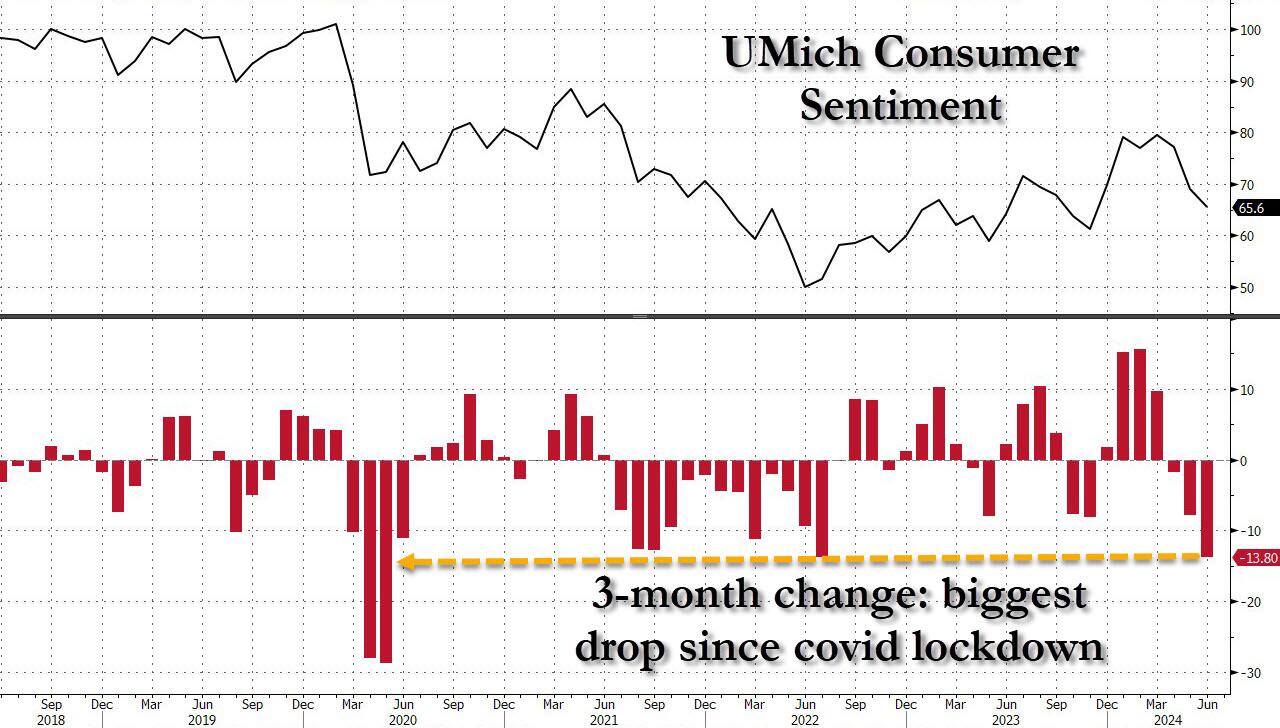
One month after the May Consumer Sentiment printed at a record 7-sigma miss to expectations, consumer sentiment once again “unexpectedly” slumped, this time from an upward revised 68.8 to 67.6, the lowest print since last November, and the biggest 3-month drop in sentiment (-13.8 points) going back to the covid lockdowns.
… which was not only a 5-sigma miss to the median estimate (an improvement from last month’s 7-sigma)…
… but also the biggest miss of 2024.
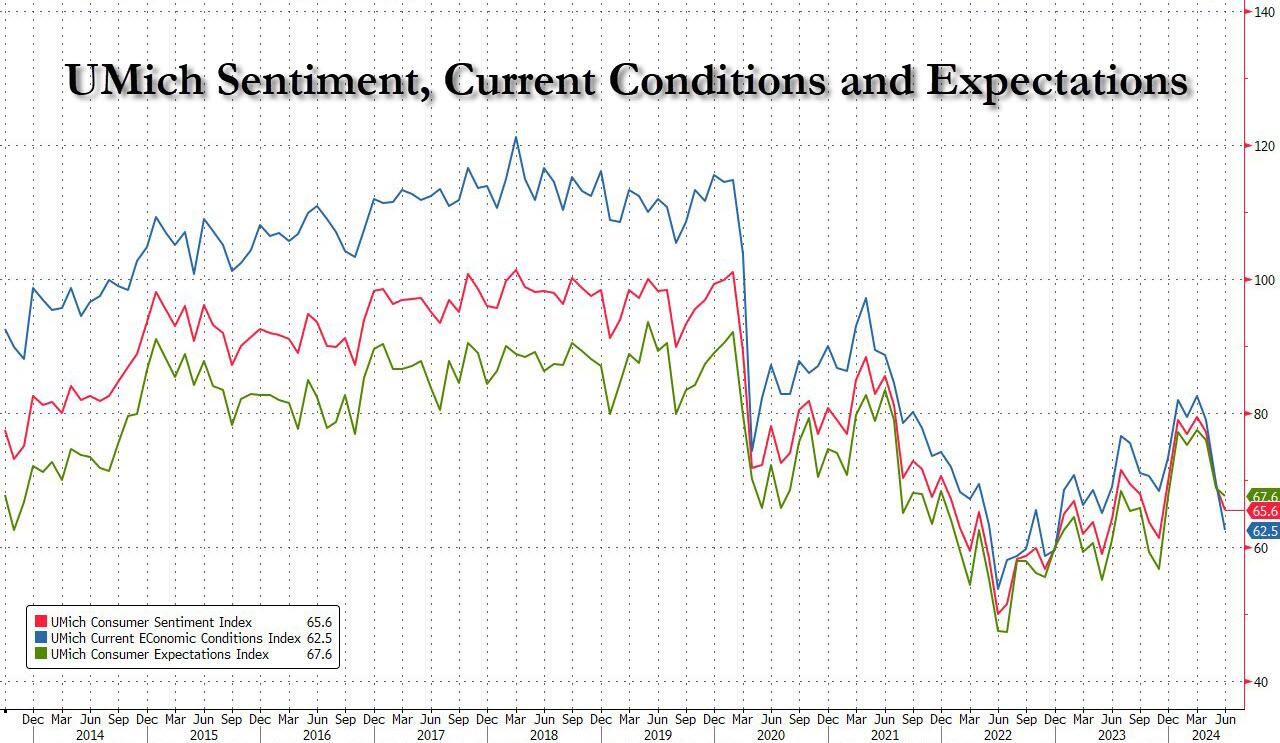
The collapse in sentiment was broad based, and hammered both current conditions – which plunged from 69.6 to 62.5, the lowest since 2022 and badly missing estimates of 72.2 – and also expectations, which dropped from 68.8 to 67.6 (and also far below the 72.0 estimate).
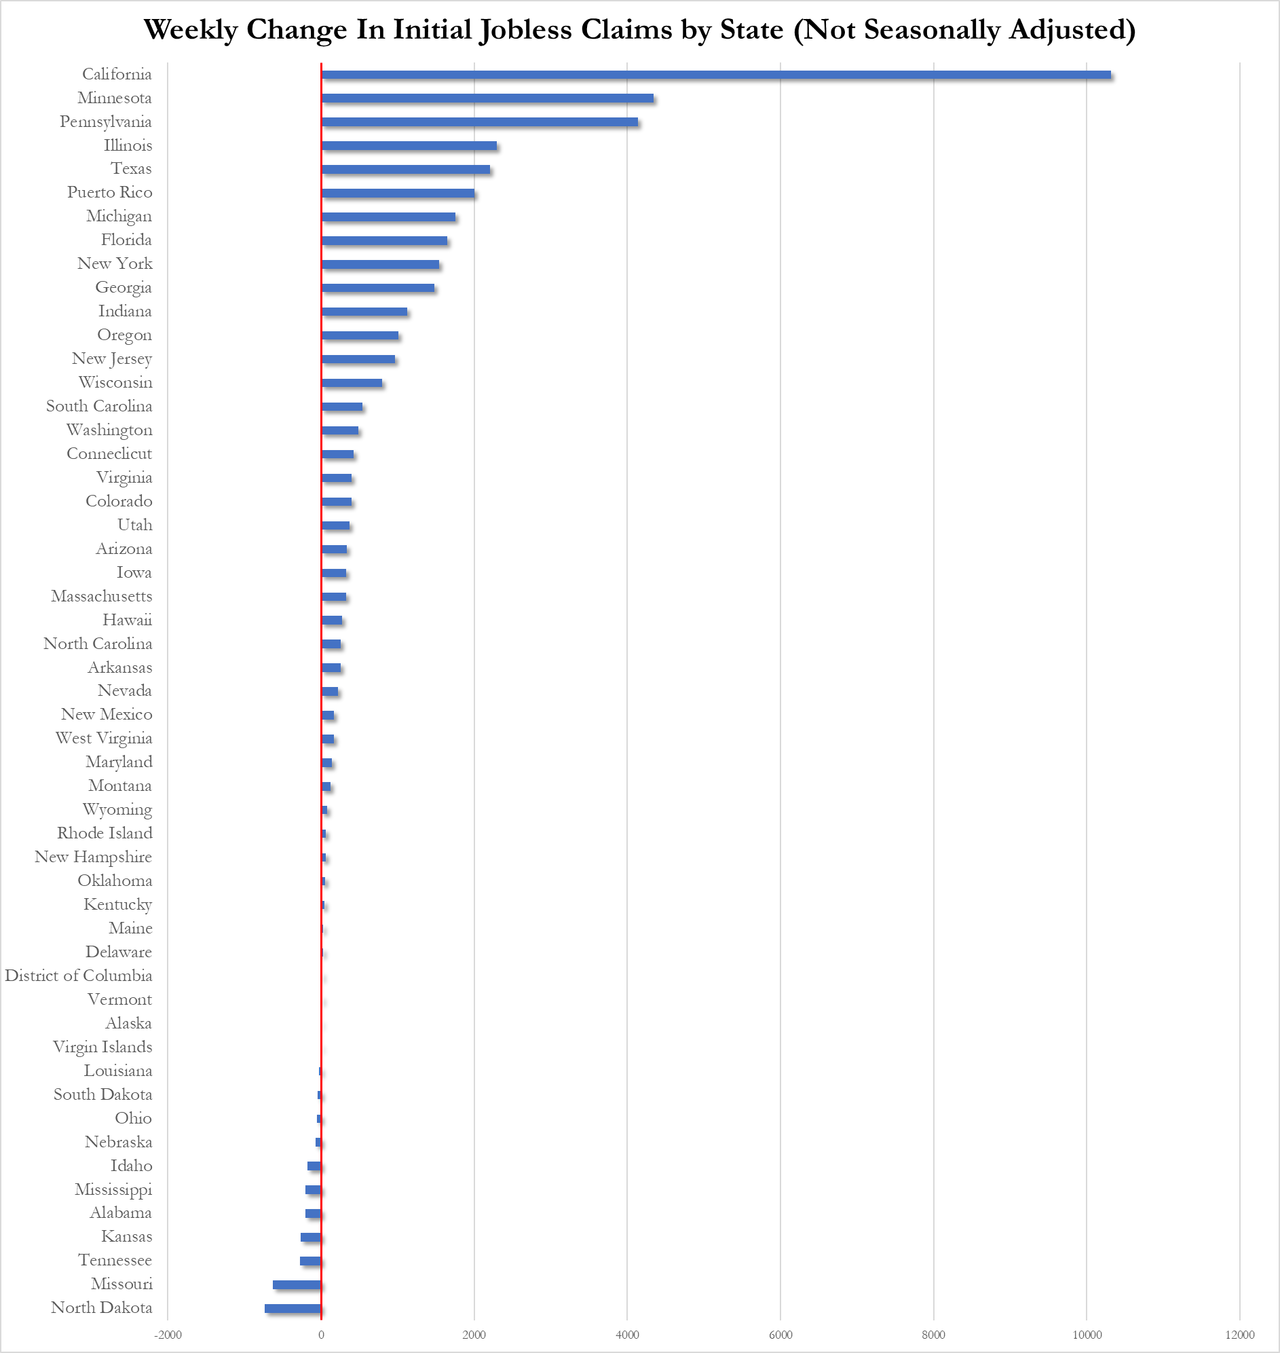
The decline in sentiment coincides with signs that the labor market, which has driven consumer spending over the last year, is also falling apart. The unemployment rate rose to 4% last month, the highest in more than two years, while jobless claims unexpectedly soared following a firing frenzy out of California.
“While lower-income families have, as a group, seen notable wage gains in a strong labor market, their budgets remain tight amid continued high prices even as inflation has slowed,” Joanne Hsu, director of the survey, said in a statement.
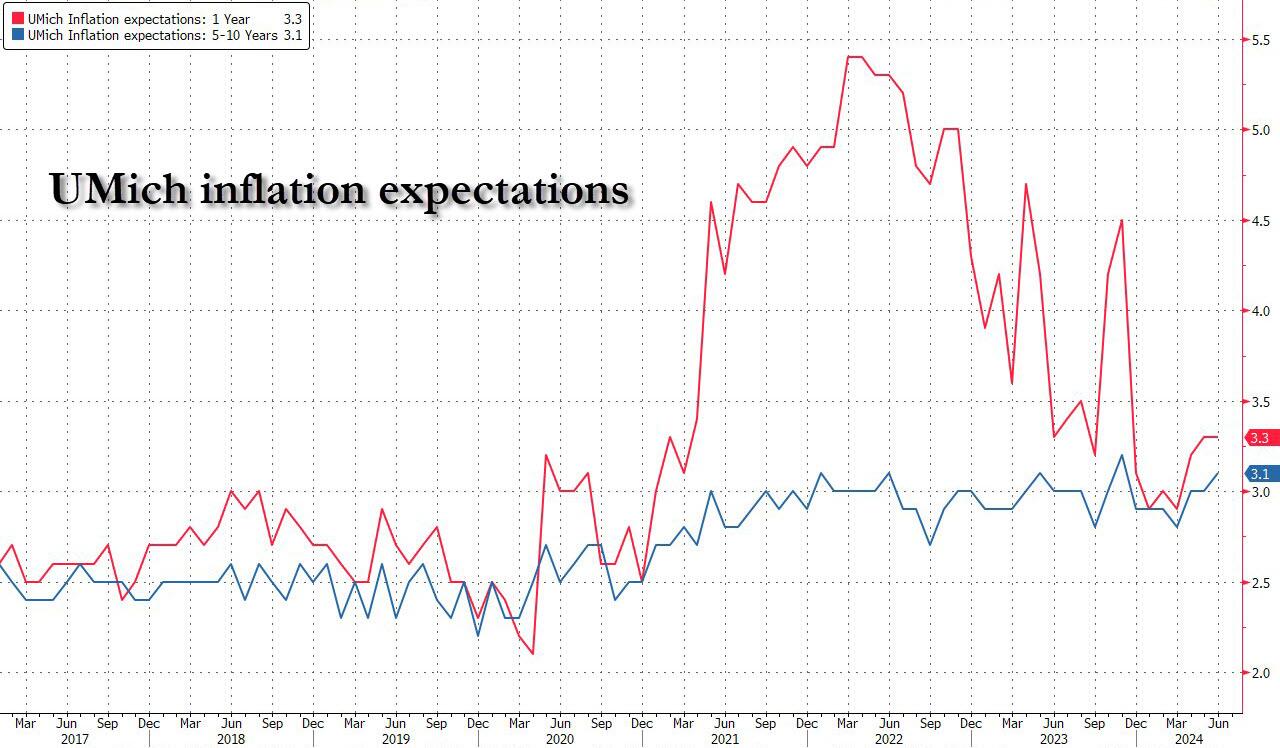
But wait there’s more, because if that was the “stag” part of the report, the UMich report also confirmed that the “flation” isn’t far behind, as the inflation outlook continued its recent deterioration, to wit: 1 Year inflation expectations remained unchanged at 3.3%, beating estimates of a drop back 3.2%, while 5-10 Year inflation expectations rose from 3.0% to 3.1%, the highest since November.
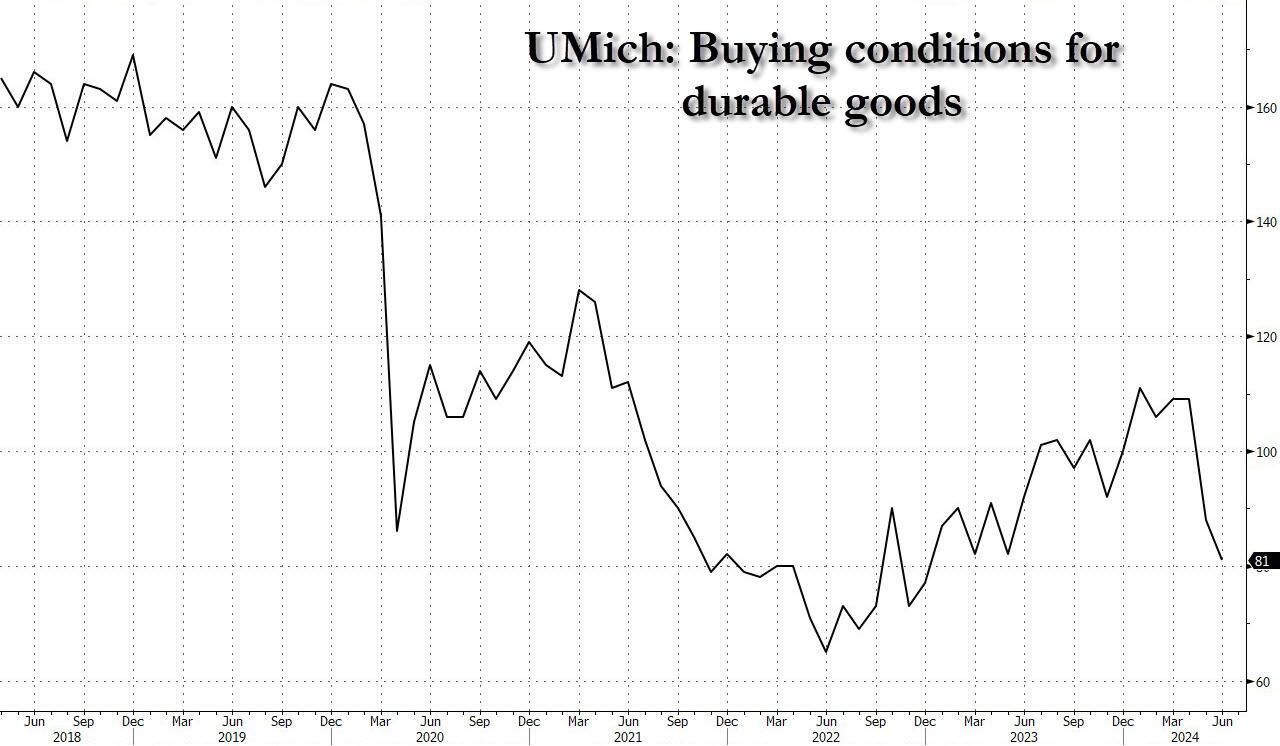
If that wasn’t enough, the slide in sentiment suggests restrained consumer demand in coming months. The university’s measure of buying conditions for durable goods decreased to the lowest level since December 2022, a glowing testament to just how tapped out the US consumer truly is.
In short: the verdict for Bidenomics is in, and it’s a complete disaster, as for Powell’s recent laughable comment that he can’t see the “stag” nor the “flation”… well, Fed chair, they just bit you on the ass.
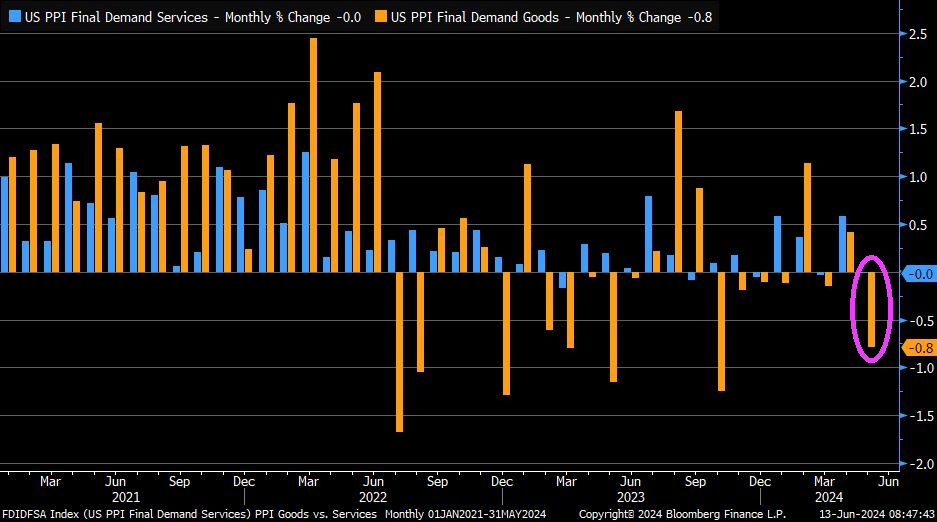
On top of a poor consumer sentiment report, the PPI Final Demand index was down … again.
Joe Biden is a dishonest politician, so it is no wonder that he ignores actual data. Like claiming that crime is down under his leadership, when it is actually large cities like New York and Los Angeles not reporting their crime data to the FBI.
Take the May jobs numbers. The BLS reports that 272k jobs were added. However, the more accurate Household Survery reported a loss of -408k jobs in May.
While the Establishment Survey did indeed report that 272K “jobs” were added, this number also included multiple job holders; stripping those out, we get that the actual number of “employed” workers plunged by -408K.
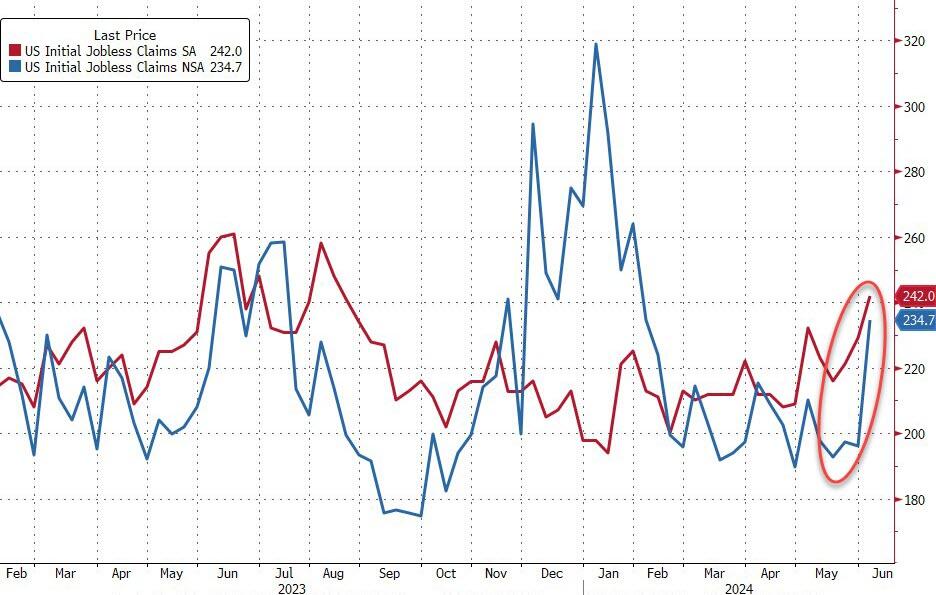
On the jobless claims side, the number of Americans applying for jobless benefits for the first time surged last week to 242k (up from 229k and well above the 225k exp). That is the highest since August 2023…
Source: Bloomberg
On an NSA basis, claims exploded higher.
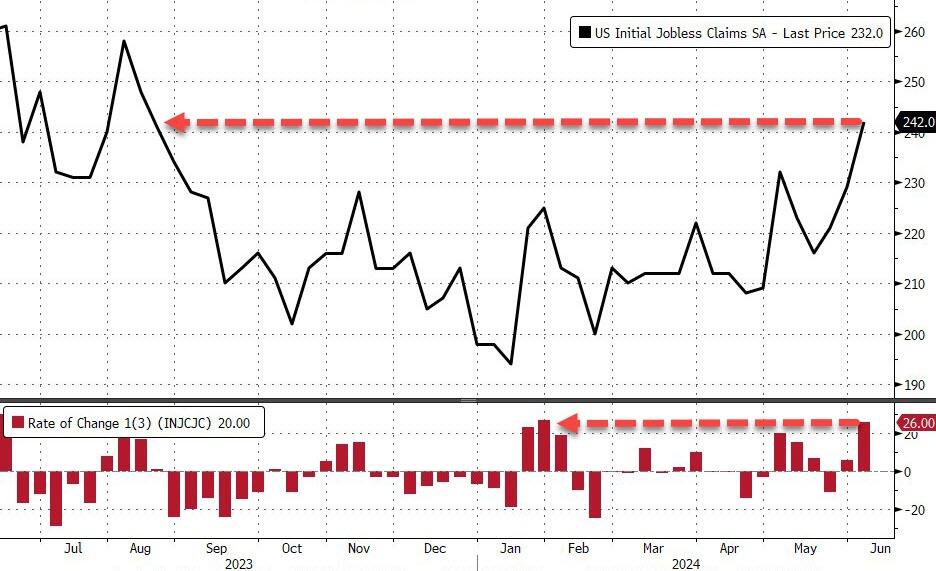
The last three weeks have seen the largest surge in claims since January…
Source: Bloomberg
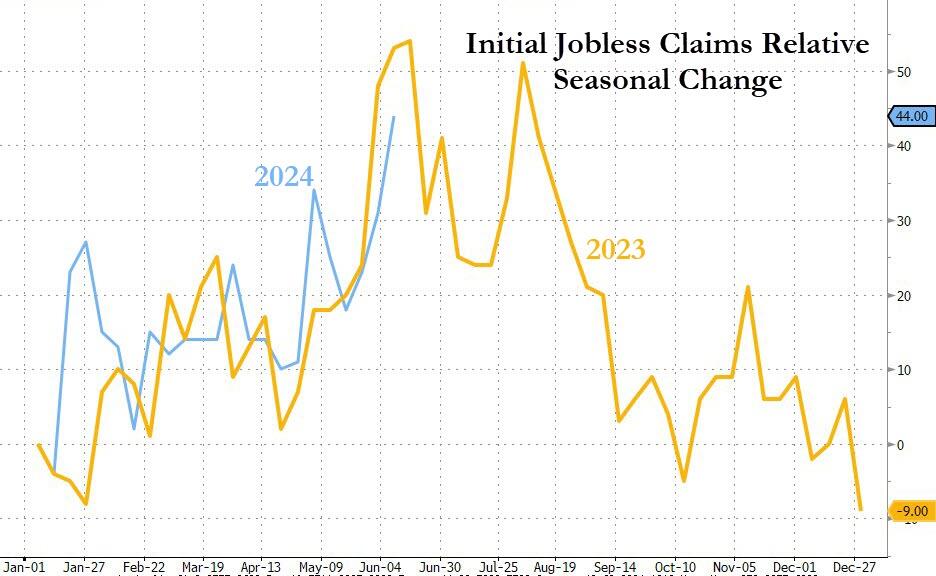
Notably this surge is very VERY similar to what we saw last year (but not the prior few years, so not a ‘seasonal’ pattern per se)…
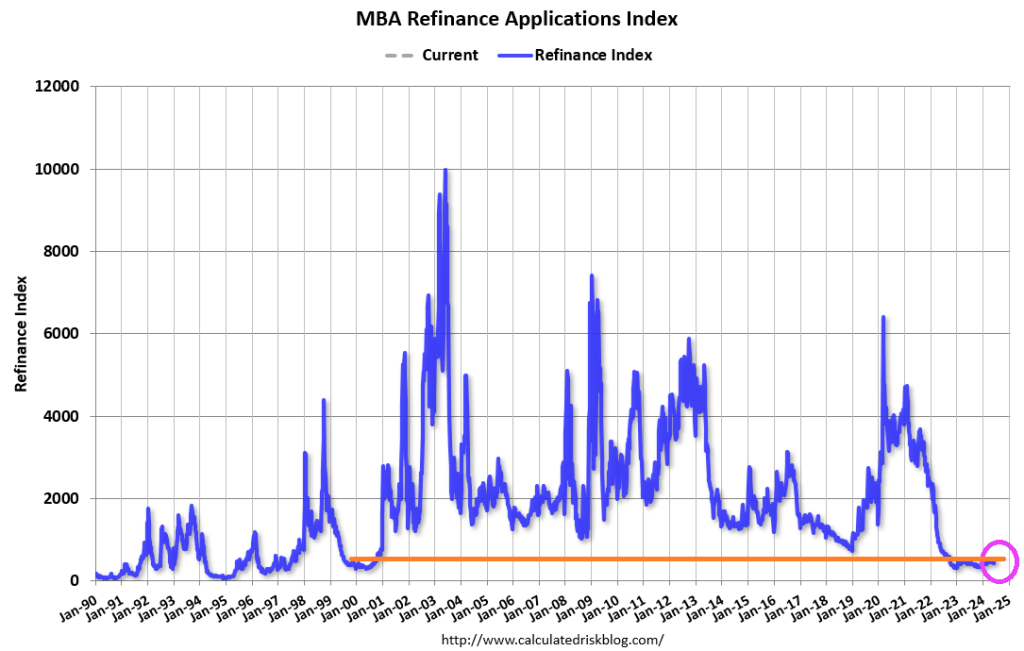
Well, it was the first week of June. Mortgage applications usually peak in May, so we are on the historic “dark side of the moon” for mortgage demand.
Mortgage applications increased 15.6 percent from one week earlier, according to data from the Mortgage Bankers Association’s (MBA) Weekly Applications Survey for the week ending June 7, 2024.
The Market Composite Index, a measure of mortgage loan application volume, increased 15.6 percent on a seasonally adjusted basis from one week earlier. On an unadjusted basis, the Index increased 26 percent compared with the previous week. The seasonally adjusted Purchase Index increased 9 percent from one week earlier. The unadjusted Purchase Index increased 19 percent compared with the previous week and was12 percent lower than the same week one year ago.
Beware of getting too excited about the19% WoW increase. It is 19% off an extremely low number.
The Refinance Index increased 28 percent from the previous week and was 28 percent higher than the same week one year ago.
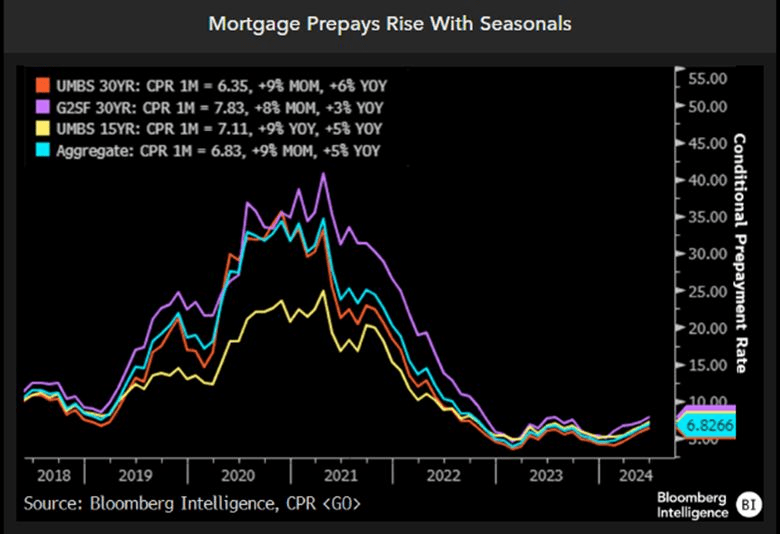
This charts sums up the seasonal component to prepays.
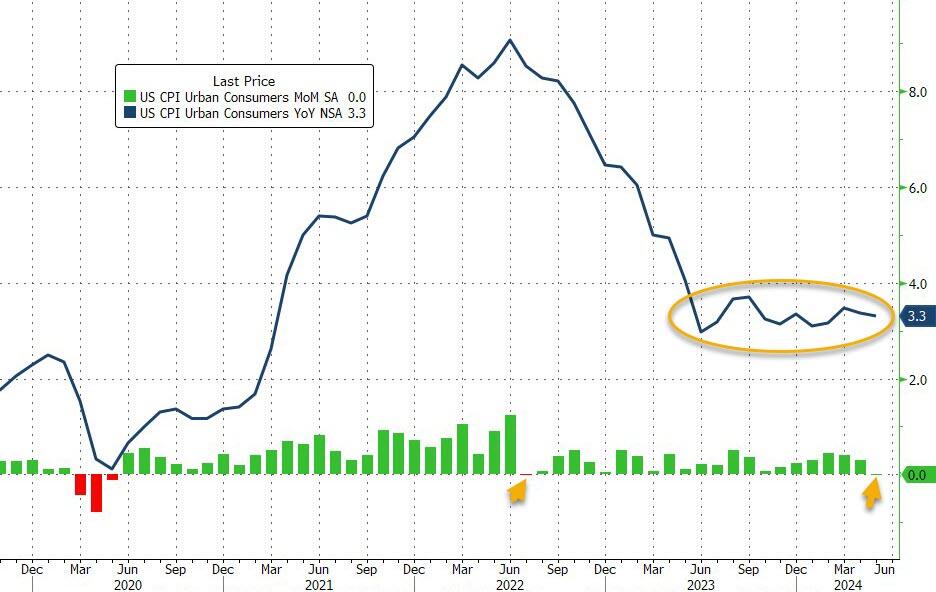
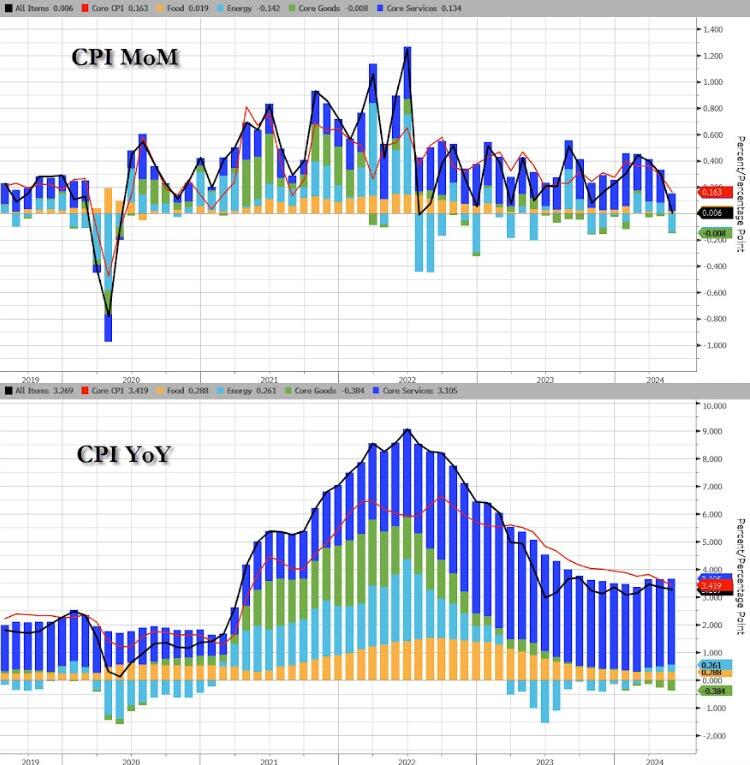
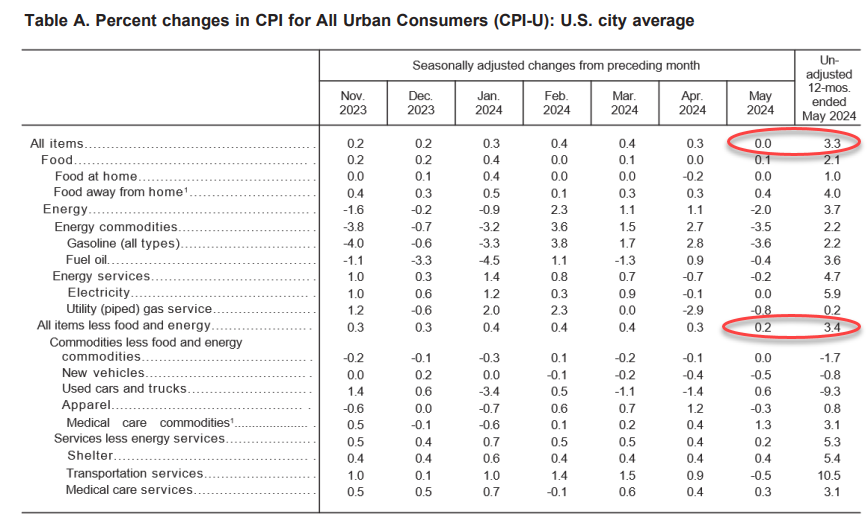
Energy was the biggest drag on the headline CPI MoM…(Gasoline prices tumbled 3.6% in May from April, one key reason why the headline CPI was flat on the month. )
Source: Bloomberg
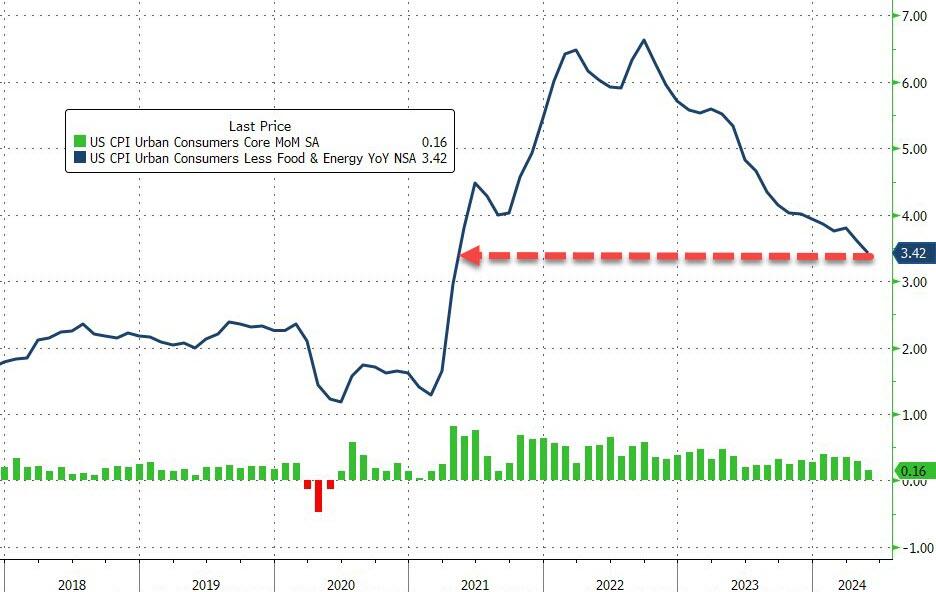
Core CPI rose 0.2% MoM (below the 0.3% exp) pulling the YoY change down to 3.4% (from 3.6% and below the 3.5% exp). That is the lowest Core CPI YoY since April 2021…
Source: Bloomberg
Core CPI has not had a down-month since President Biden was elected.
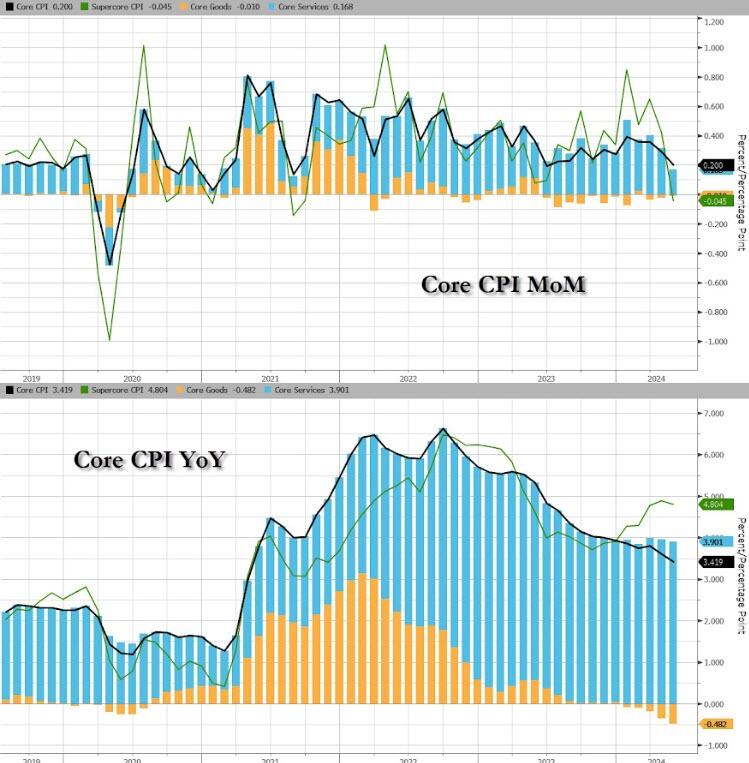
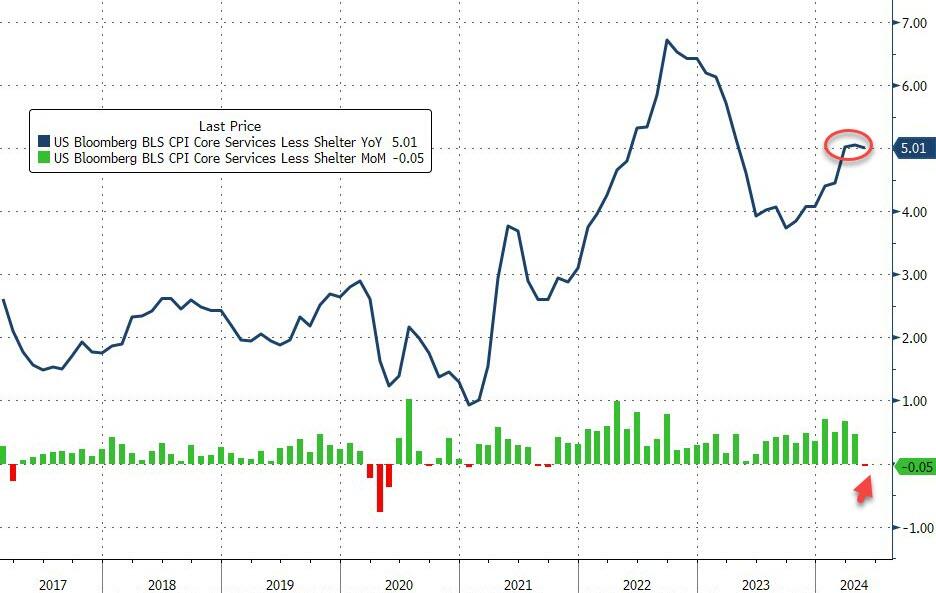
Core Services inflation slowed notably MoM…
Source: Bloomberg
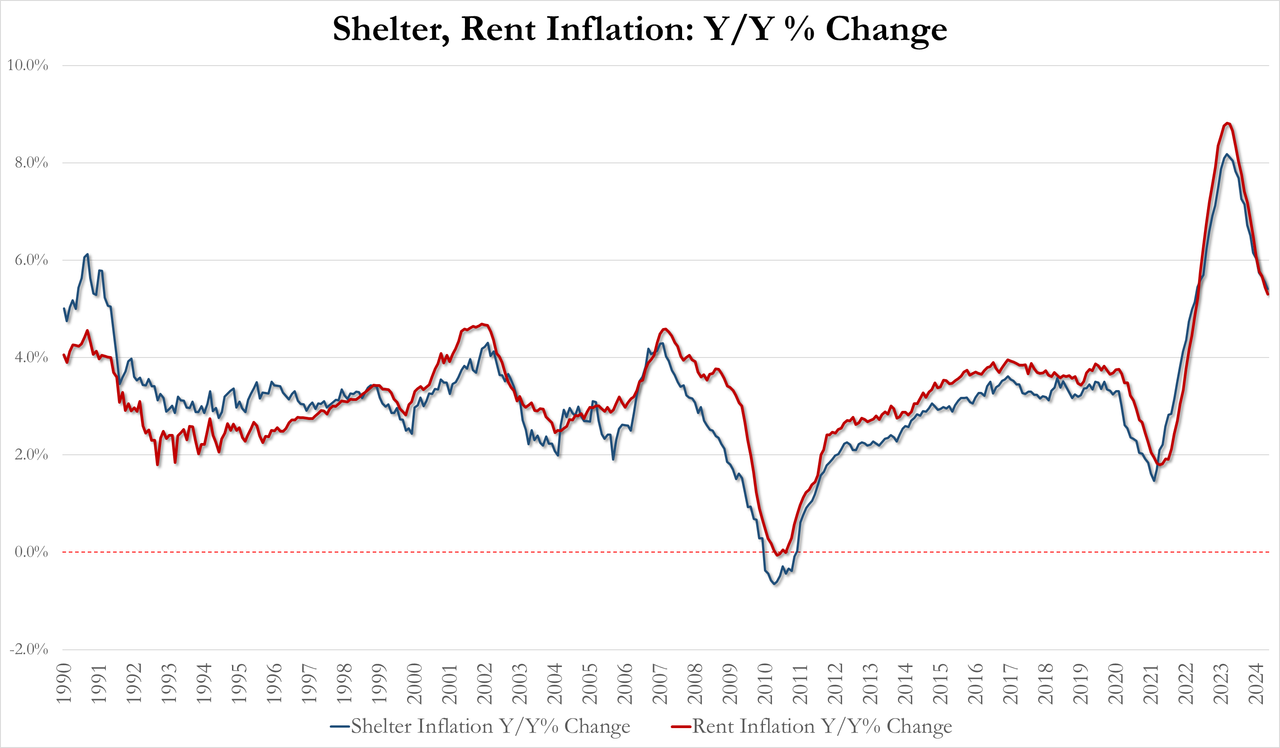
The shelter index increased 0.4 percent in May and was the largest factor in the monthly increase in the index for all items less food and energy.
May Shelter inflation 5.41% YoY, down from 5.55% in April and lowest since April 2022
May Rent inflation 5.30% YoY, down from 5.44% and lowest since May 2022
For context on how important housing costs are to US inflation data, the shelter index rose 5.4% over the last year, making up over two thirds of the total 12-month increase in the all items less food and energy index.
Source: Bloomberg
It does make one wonder were exactly the BLS is getting their BS OER data from…
The full breakdown…
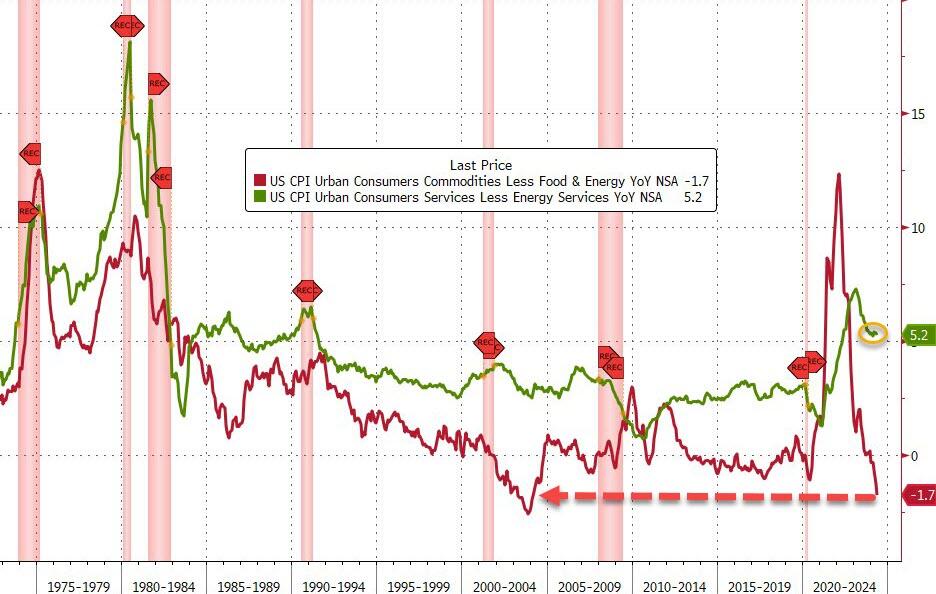
Services INflation remains awkwardly stuck above 5% while Goods DEflation is at its weakest since January 2004…
Source: Bloomberg
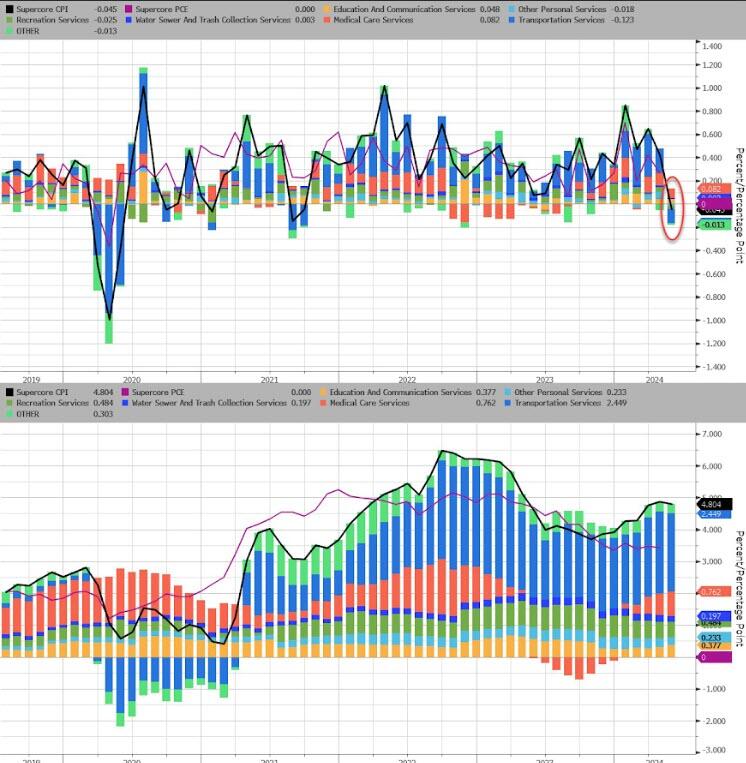
SuperCore CPI fell 0.05% MoM – its first drop since Sept 2021, but that left the YoY level still above 5.0%…
Source: Bloomberg
Transportation Services costs tumbled MoM to drag SuperCore lower MoM…
Source: Bloomberg
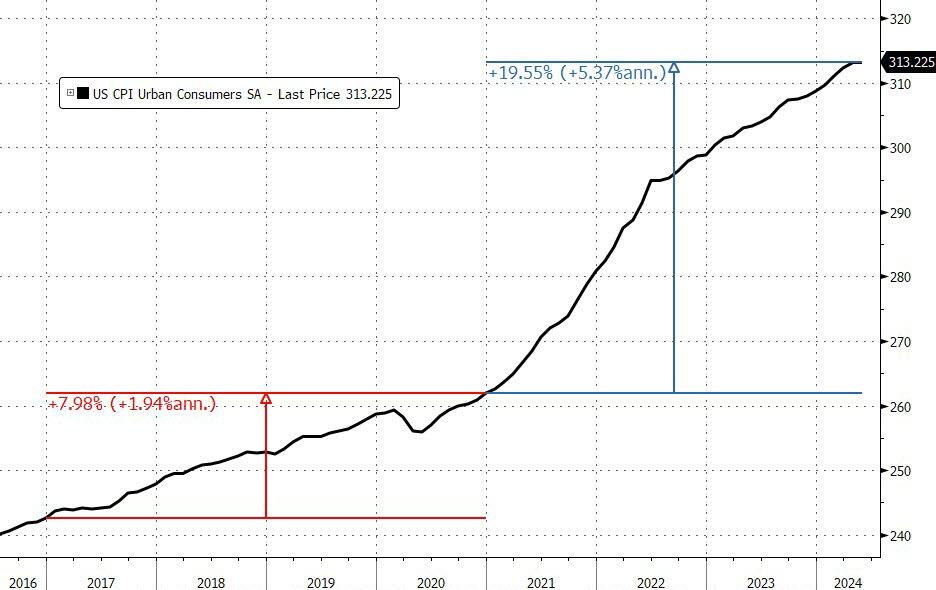
We note that consumer prices have not fallen in a single month since President Biden’s term began (July 2022 and May 2024 was the closest with ‘unchanged’), which leaves overall prices up over 19.5% since Bidenomics was unleashed (compares with +8% during Trump’s term).
And prices have never been more expensive…
That is an average of 5.4% per annum (almost triple the 1.9% average per annum rise in price during President Trump’s term).
Source: Bloomberg
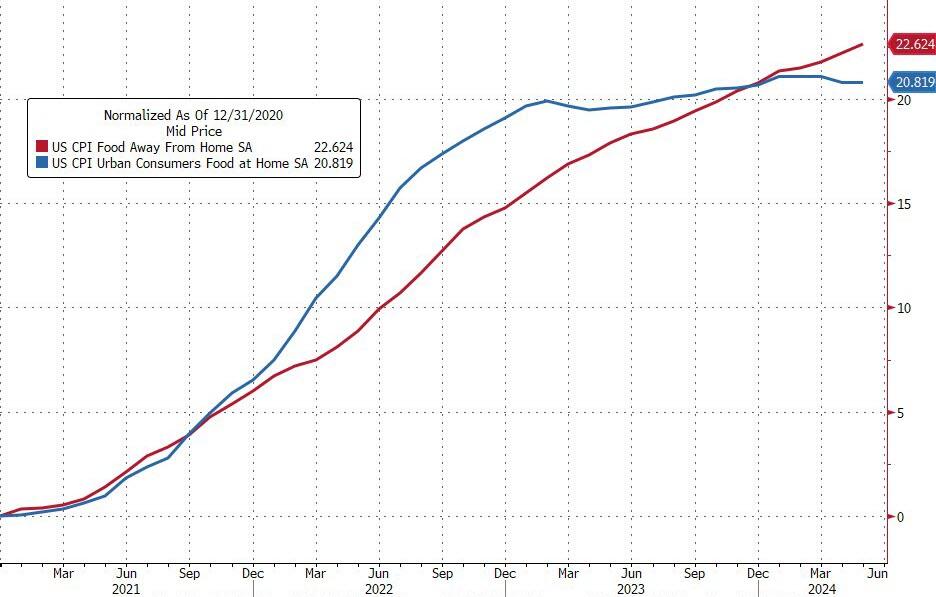
Since President Biden was elected, food prices at home are up around 21% and food prices away from home are up almost 23%…
And while the Biden administration will continue to gaslight voters with comments like “inflation is tumbling”… every man, woman, and child who actually buys food knows prices have NEVER been higher…
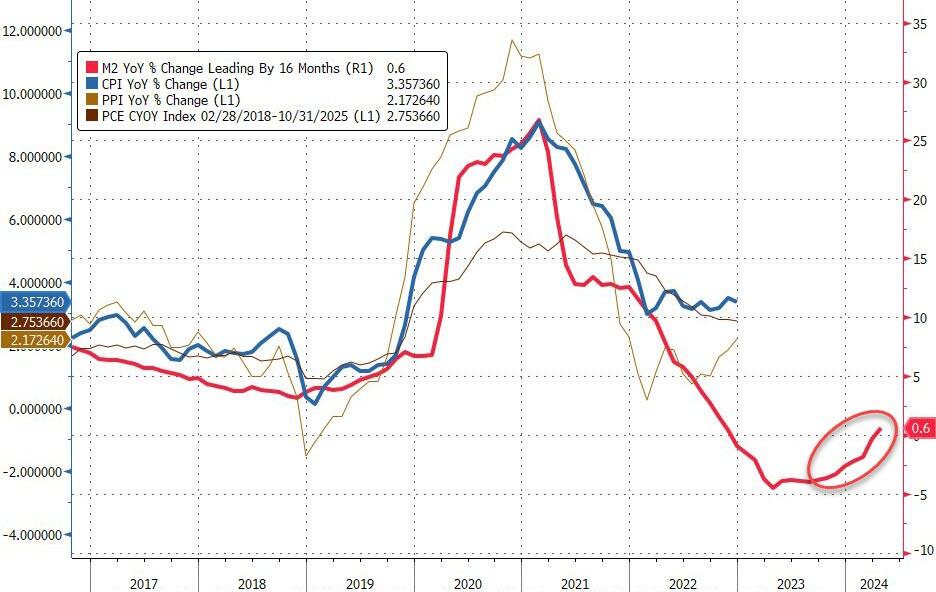
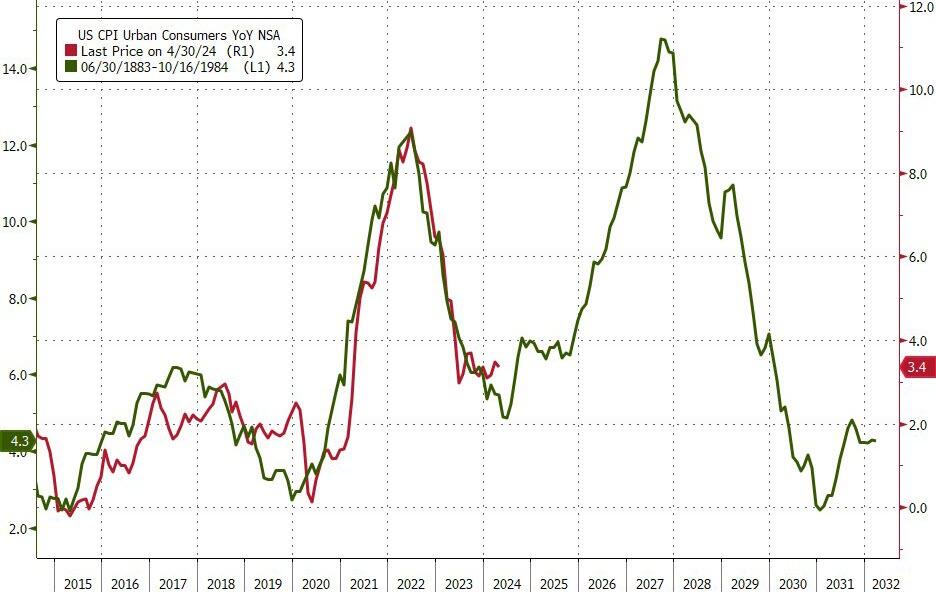
Finally, while the ‘flations’ have broadly tracked M2 lower, we note that M2 YoY is now starting to turn back higher once again…
Source: Bloomberg
Will the next President and Fed head face a 70s redux?
Source: Bloomberg
And is this guaranteed if Powell decides “insurance” cuts are required (for Biden?)
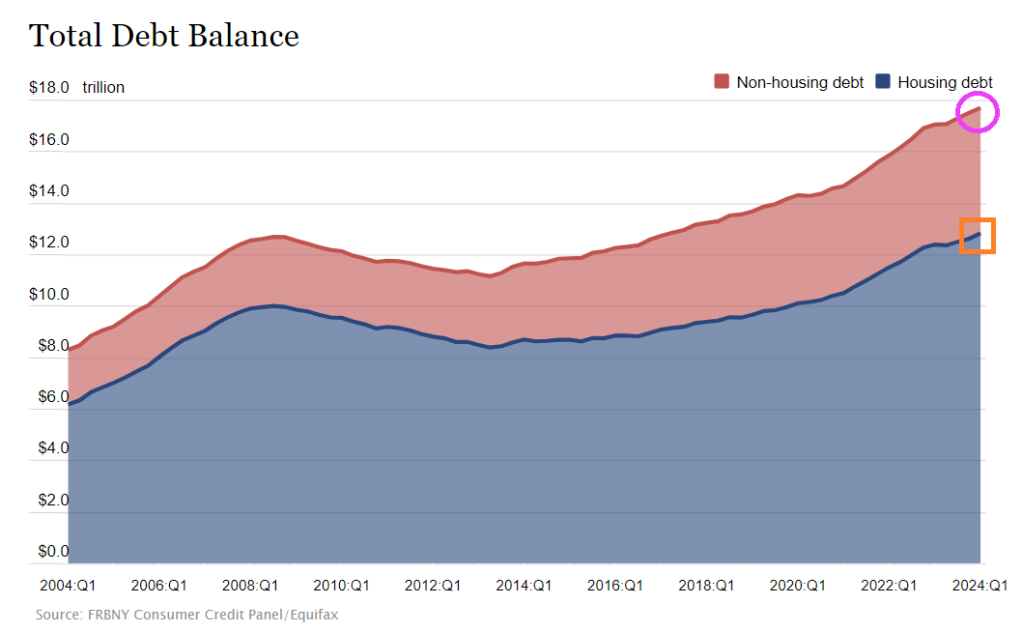
Too much debt should be the theme song for the US! Both for consumers and the Feral government (not a typo!)
Consumer credit increased by +$6.403 billion in April, much softer than consensus estimate of +$10 billion … more notable, however, was March data, given initial read of +$6.274 billion was revised down to -$1.099 billion.
Not to mention $13 trillion in mortgage debt (1-4 unit housing), but at least that is backed by property. Unlike The Feral government who borrows/prints with only a promise.
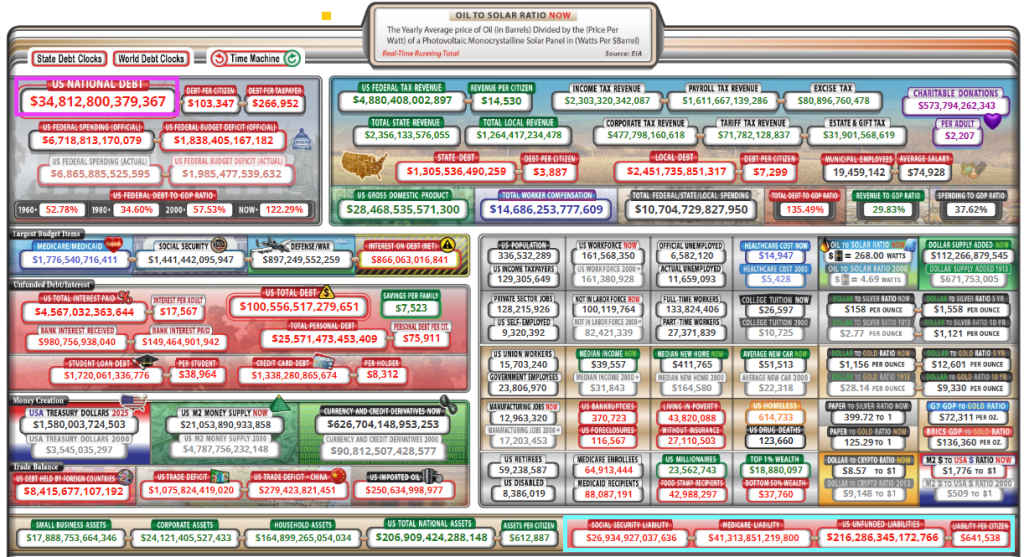
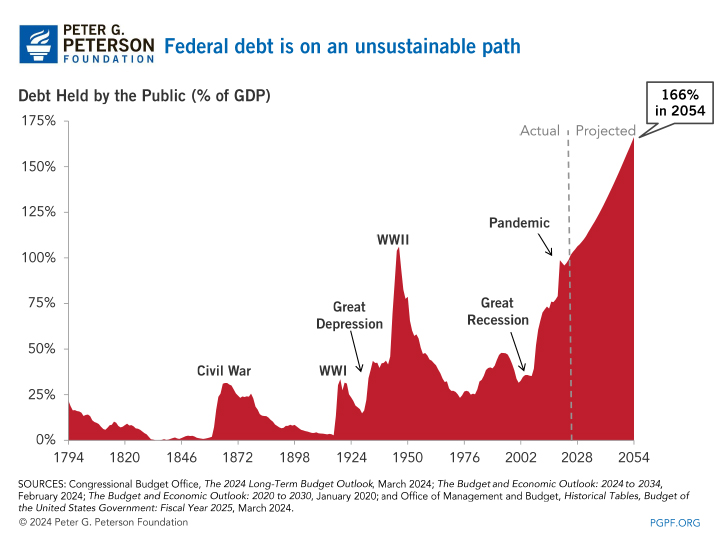
And growing awfully fast. Note that since the “pandamic”, debt as % of GDP has exceeded 100% and is projected to hit 166% by 2054. But look at the UNFUNDED LIABILITIES the need to be paid ($216+ TRILLION ($641.5k per citizen!). Pretty soon, we (the 99%) will be back on the chain gang paying for endless wars and government corruption. I wish Biden, Schumer, McConnell and other swamp creatures would consider all the spending the government is on the hook for rather than focus on spending that will help them get elected perpetually. There is no middle of the road anymore. The US is broke and has too much debt.
Of course, President Biden wants endless spending on wars (Ukraine, Israel, etc) and now wants an unlimited check to pay for the next pandemics. The Pretenders’ song “My City Was Gone” seems to be appropriate for the US as “My County Is Gone.”
Of course, some “economists” claim that the US can borrow/print unlimited amounts of money … until they can’t.
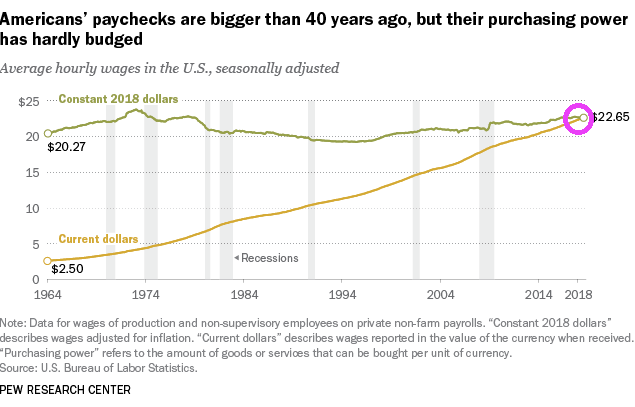
To begin with, America’s paychecks are bigger than 40 years ago, but purchasing power of those larger paychecks is about the sames as it was 40 years ago. Great job Washington DC!!! … NOT!!!!
Meanwhile, credit card delinquencies are at the highest level since 1991.


You must be logged in to post a comment.