“Two-job Joe” should be Biden’s new nickname for his economy wrecking ball known as Bidenomics.
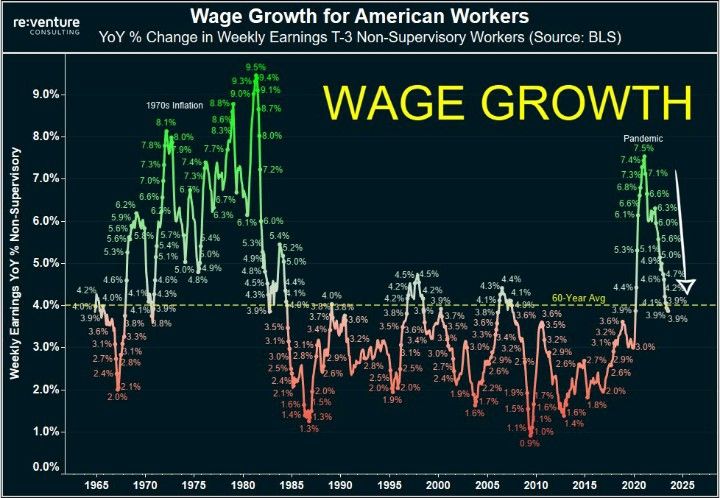
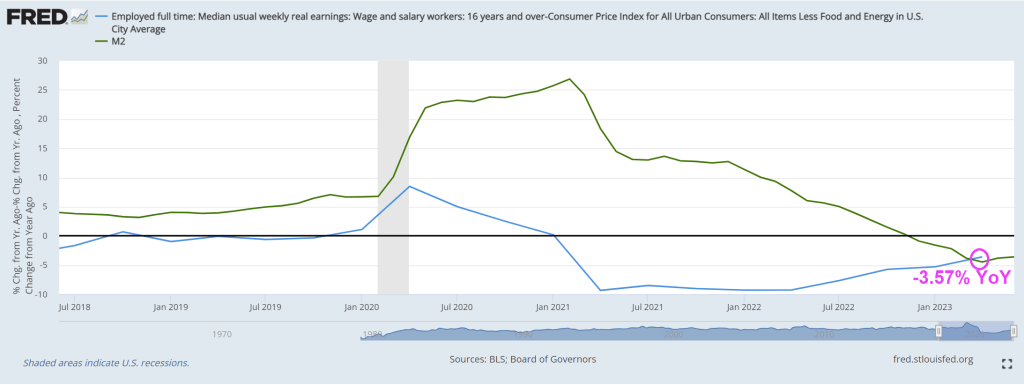
The economic disaster known as Bidenomics (code for wealth transfers to the donor class) can be seen in the following chart. Non-elite households are struggling to cope with higher gasoline, food and house prices (rent) under Bidenomics.
As a result, the number of people holding 2 FULL-TIME JOBS hit an all-time high of 447,000 people. Biden spokesperson Karine Jean Pierre is likely to say “See? Bidenomics is working! Not every person is holding 2 full-time jobs to afford that Ford all-electric Lightning F-150 pickup truck!”
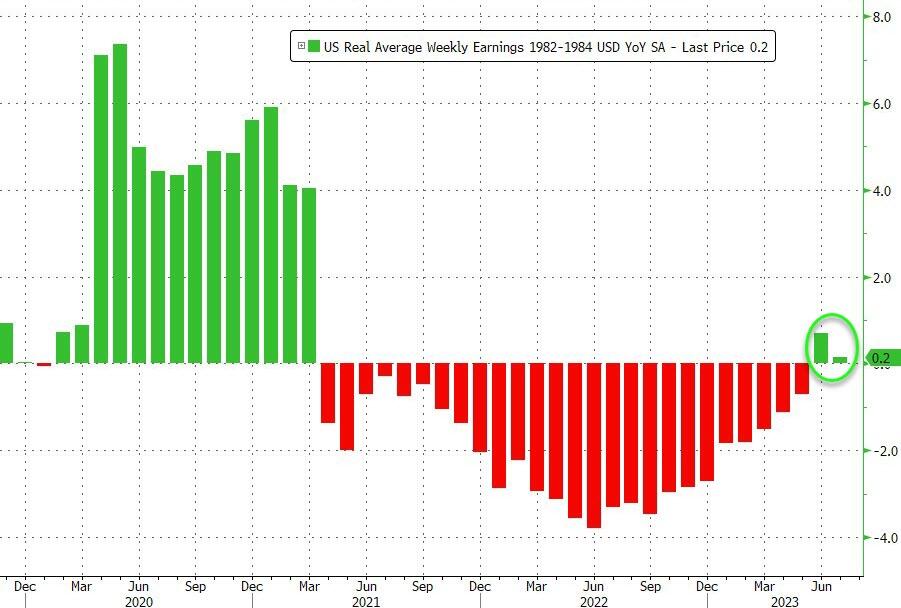
At the same time, wage growth YoY is crashing from Covid stimulus highs to pre-Covid levels.
It is getting harder and harder for non-elites to buy that Ford F1-150 all-electric Lightning Platinum for $94,000 plus tax. And you still have to pay $500 for the Ford Mobile Power Cord. OMG! For $94k, they couldn’t throw in the power cord?????
Does F stand for Failed? The honorary vehicle for Bidenomics!!
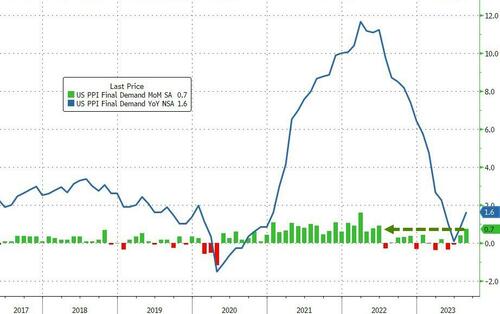
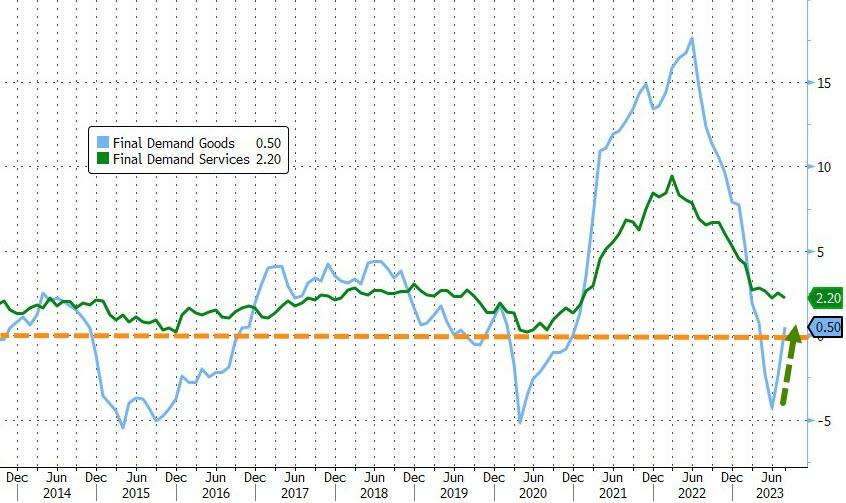
Producer Prices rose 0.7% MoM in August (up from +0.3% in July and hotter than the +0.4% exp). That is the hottest PPI since June 2022, and pushed YoY prices up 1.6%…
Source: Bloomberg
Goods prices are reaccelerating fast, now back into inflation YoY (as Services cost growth slowed only modestly)…
Source: Bloomberg
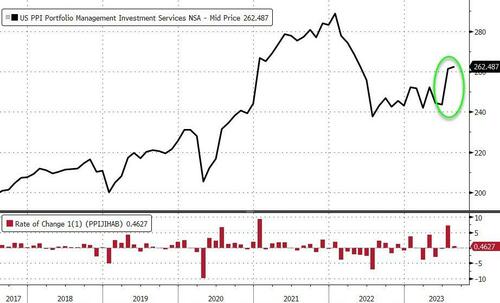
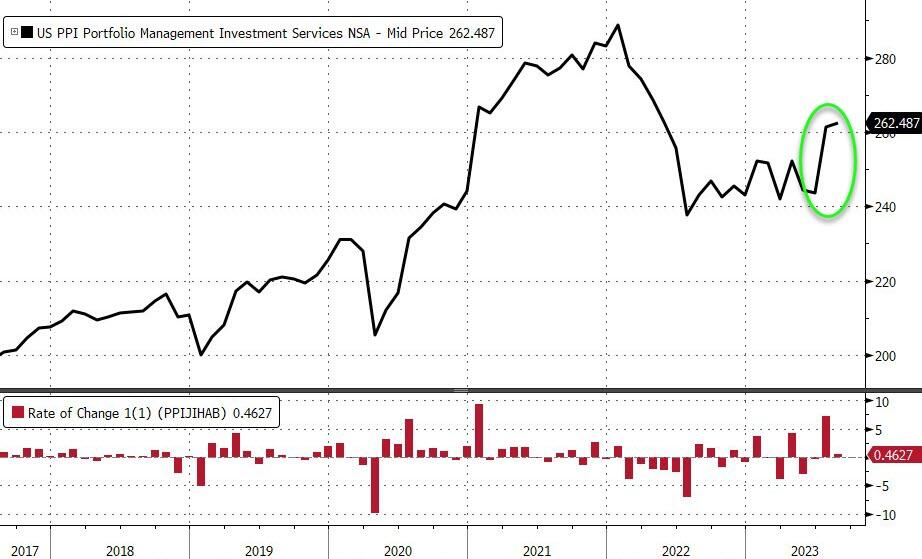
As a reminder, much of last month’s PPI rise was driven by a big jump in portfolio management costs – as stocks soared. August saw a further rise in those costs…
Source: Bloomberg
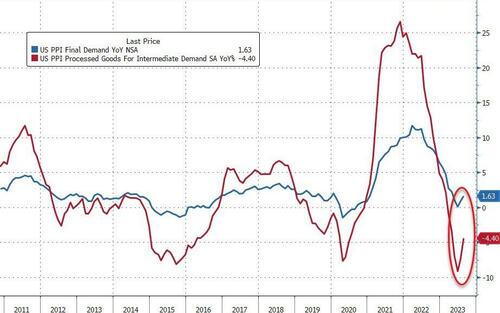
More problematically, the pipeline for PPI appears to have inflected as intermediate demand is re-accelerating…
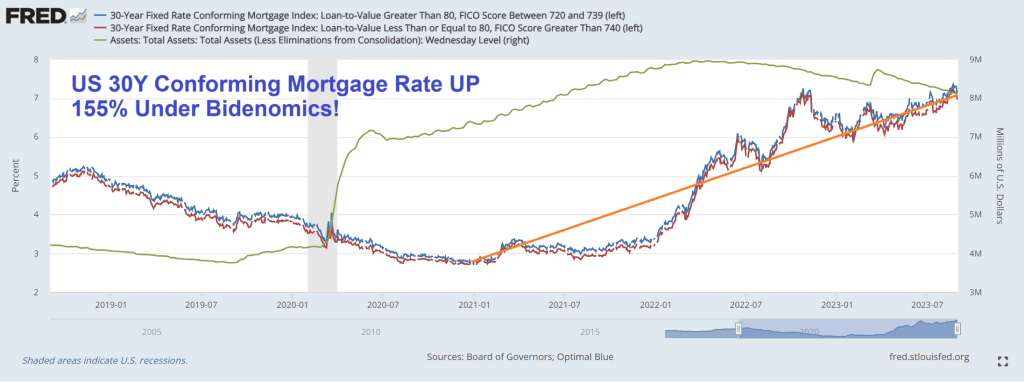
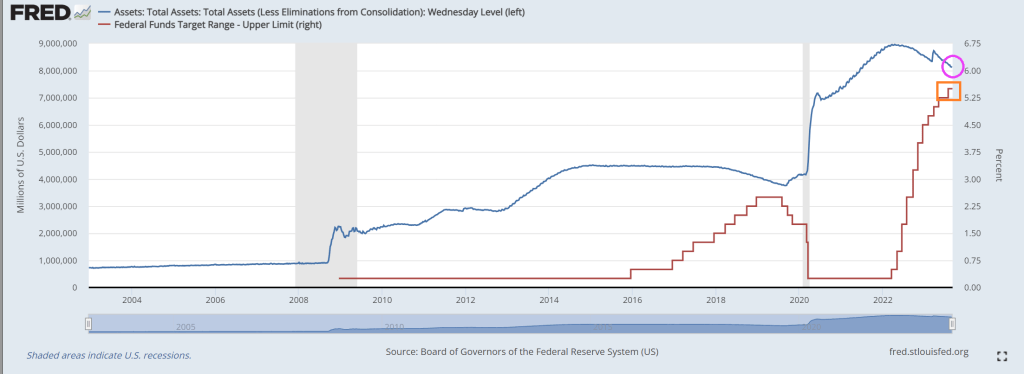
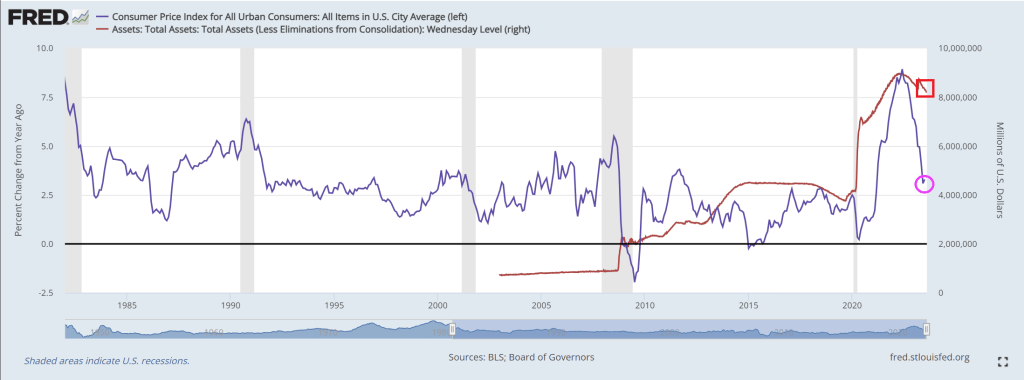
Under Bidenomics, there is still too much Fed monetary stimulus in the form of >$8 trillion on its balance sheet. While the biggest surge in Fed activity occurred with Covid, The Fed has added 10% to its balance sheet under Billions Biden.
Despite not backing off the assets purchases by The Fed, conforming 30Y mortgage rate is still up 155% under Bidenomics.
Yes, The Fed is raising its target rate to cool inflation, but doing little with its balance sheet.
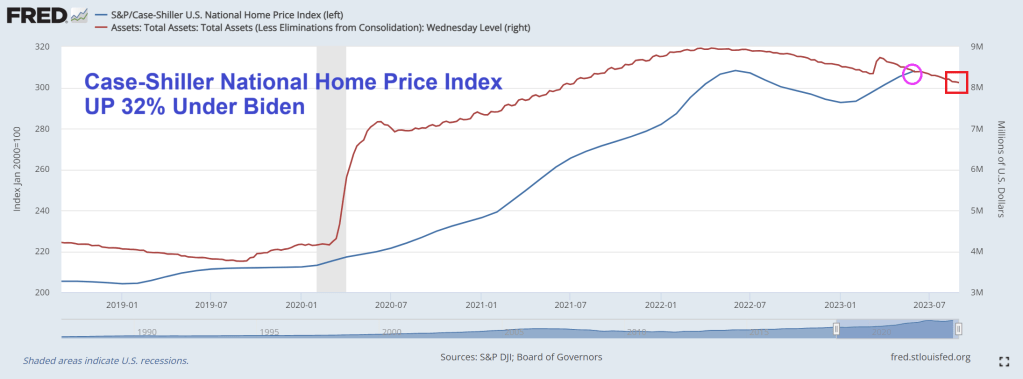
The Case-Shiller national home price index is up 32% under Vacation Joe!
It seems prices are out of control and The Fed refuses to trim its balance sheet. But don’t worry, Vacation Joe is probably on yet another vacation while Maui and Flordia suffer and The Ukraine war is seeing bodies pile up. Meanwhile, he still hasn’t visited East Palestine Ohio like promised.
Preliminary benchmark revision smaller than some had projected
Biggest payrolls adjustment in transportation and warehousing
Are you surprised that the Biden Administration has been lying about job creation?? Not really since Biden compulsively lies about everything. Including his corruption.
US job growth was probably less robust in the year through March than previously reported, according to government data released Wednesday.
The number of workers on payrolls will likely be revised down by 306,000 for March of this year, according to the Bureau of Labor Statistics’ preliminary benchmark revision.
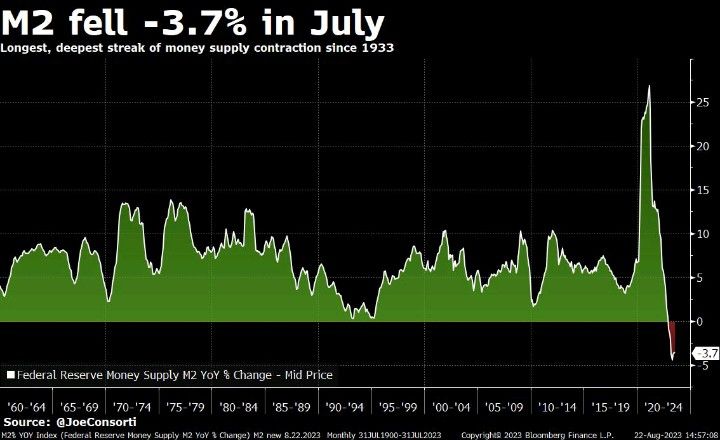
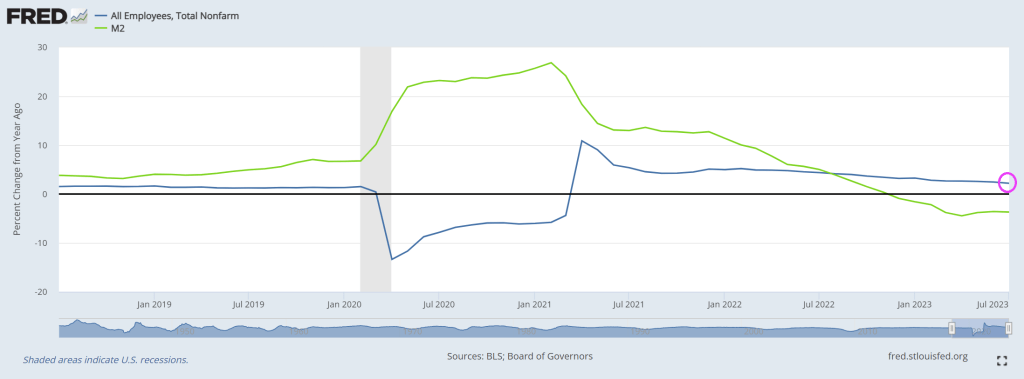
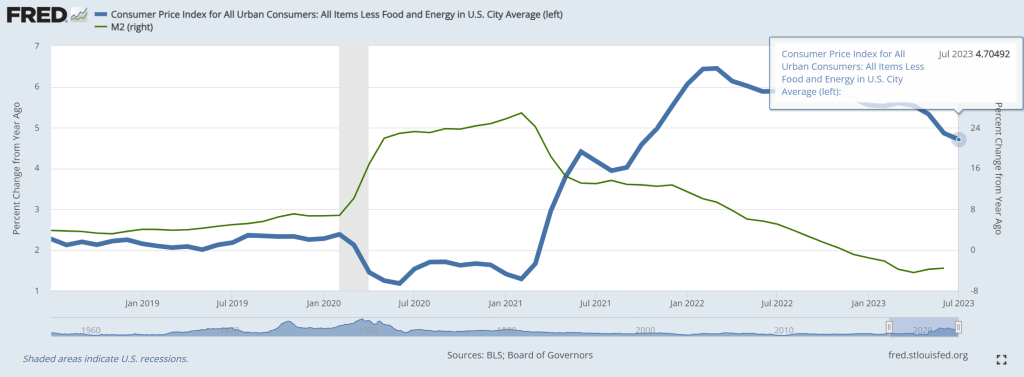
Even without the revision, job growth has slowed to 2.2% YoY in July as M2 Money growth slowed to -3.7% YoY.
Let see what our Overlords say at the Jackson Hole Fed symposium.
Between The Federal Reserve’s outrageous overreaction to Covid (printing like there was no tomorrow), and Biden’s massive spending spree (lots of moldy (green) spending, we have see horrid inflation.
And The Fed trying (sort of) to combat inflation, we see that 30-year CONFORMING mortgage rate for 80% LTV or lower credit borrowers is up 163.5% under Bidenomics.
Under Bidenomics, public debt (owed by the US Treasury) is up 19% or greater than $5 triillion. Now wonder Biden throws are billions like it is water.
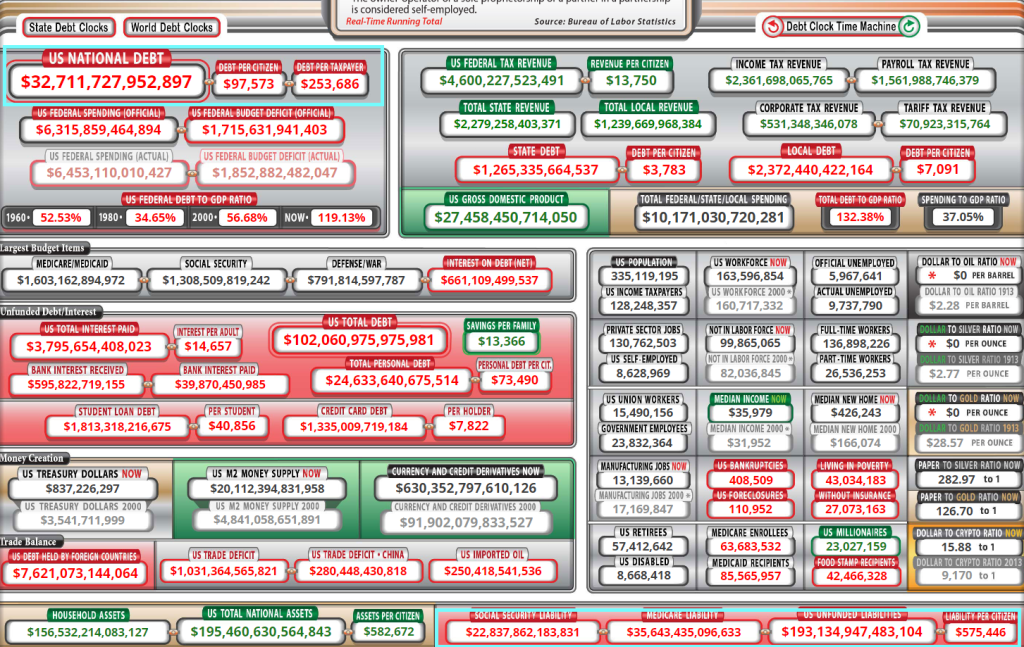
I seriously want the Biden Administration (and almost every member of Congress) why we are sending billions of dollars to Ukraine while barely giving Maui fire victims barely anything. The US is already $33 trillion in debt with >$193 trillion in unfunded liabilites. I want to ask Biden and Congress HOW the US is going to afford $193 trillion in unfunded liabilites?
Of course, NO ONE wants to face the reality of the disastrous fiscal poliicies of Washington DC politicians. Not McConnell, not McCarthy, not Schumer and especially not Billions Biden. Remember 10% for The Big Guy where Democrats argue that is meaningless. Or mini-me, Robert Reich (Clinton’s labor secretary) who claimed that the US economy is the best he has ever seen! Yes, Reich, for the top 1%. Of couse, no one will ask fools like Reich how we will pay for $33 trillion in debt and the $193 trillion in unfunded liabilies … and fund a war in Ukreiane in seeming perpetuity.
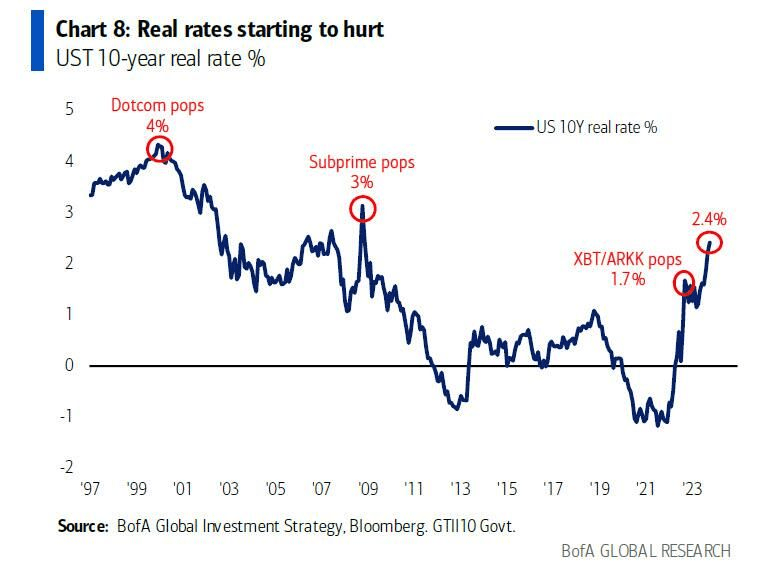
Before I look at Berenson’s plea for more inflation, let’s see where Federal spending and Fed Monetary policies have left us. As of this morning, the REAL US Treasury 10-year yield (nominal yield less inflation), is now the highest since two crises ago, meaning The Great Recesssion and the first major overreaction of The Federal Reserve in late 2008.
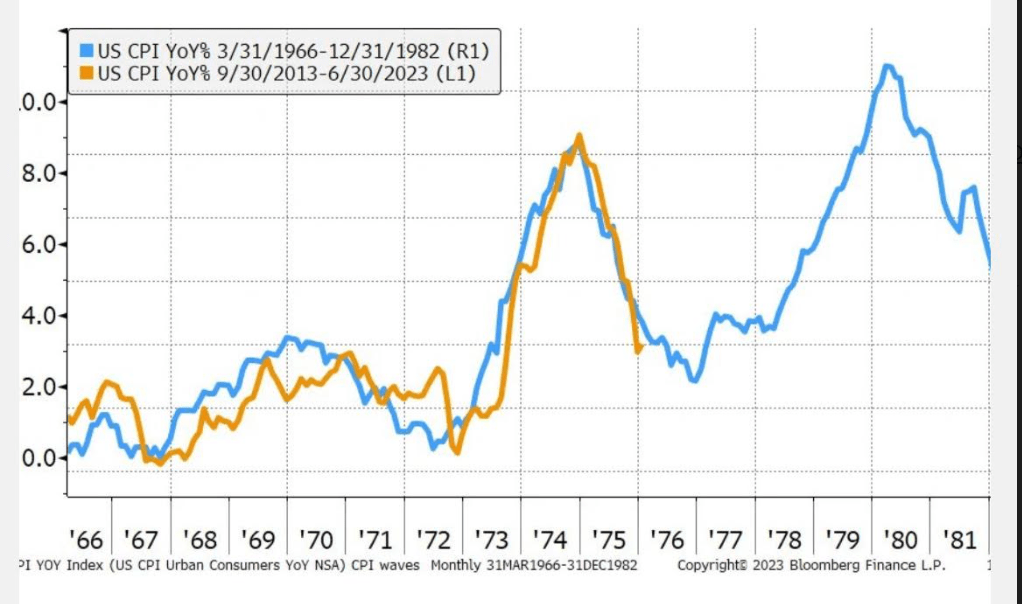
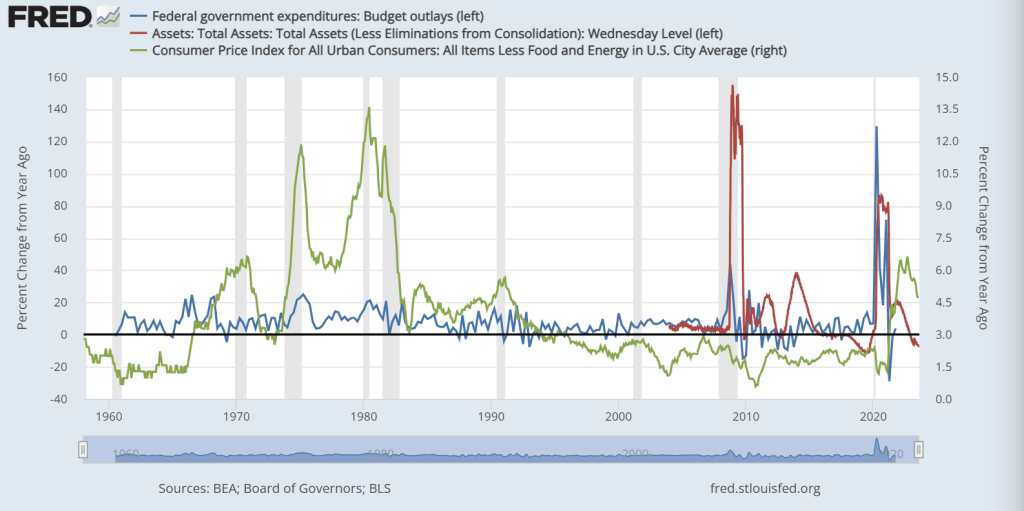
Here is Berenson’s chart showing changes in inflation (CPI YoY) from 1966-1982 compared with recent inflation (orange) from 9/30/2013 – 06/30/2023. A charist might get confused and assume that inflation is will start rising again. But it is far more complicated than a simple projection.
Since 1982 and the Carter recessions, we have seen incredible growth in Federal spending and when the proved insufficient, a massive increase in Fed monetary stimulus in late 2008 and then again in 2020 due to Covid. Remember Winston Churchill’s quote regarding water, “Never let a good crisis go to waste.” That has morphed into a battle cry for more government spending and regulation, not to mention Federal Reserve monetary policies.
Notice that core inflation under Carter (green line) was gut wrenching (yet Berenson just shrugs it off). Core inflation is still at a horrible 4.7% YoY. But you can see the spikes in Federal spending (blue line) and Fed Monetary stimulus (red line) associated with the financial crisis of 2008-2009 and Covid 2020-2021.
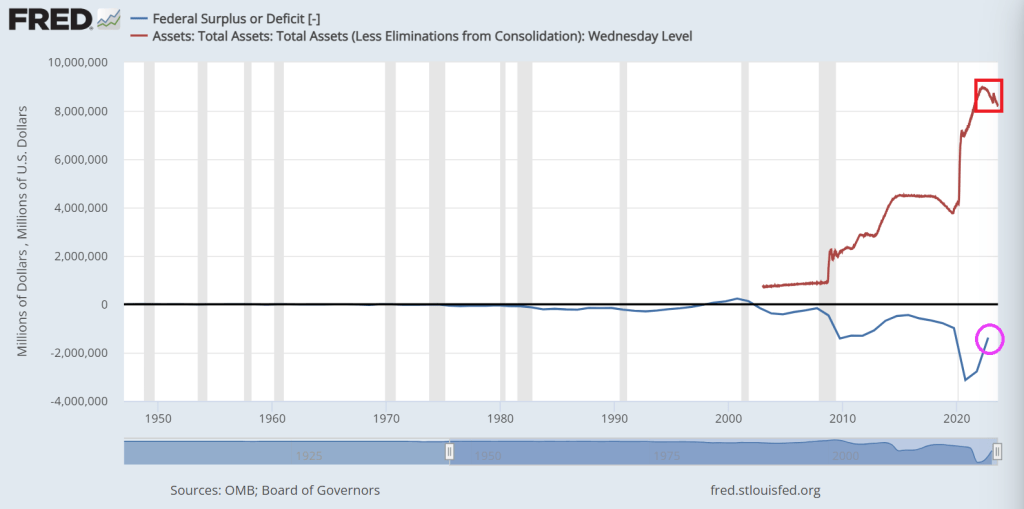
Then we have the Federal budget deficit, still over $1 trillion (despite perpetually confused President Biden claiming he got rid of the deficit). Meanwhile, The Federal Reserve still has over $8 TRILLION in monetary stimulus sloshing around the financial system.
Inflation is a horrifying by-product of Federal spending and Fed monetary policy (especially under Fed Chair Janet Yellen). Unfortunately, Yellen is now the US Treasury Secretary. For example, REAL average hourly earnings are declining thanks to inflation.
Berenson closes his piece with this sobering statement: “Ultimately, this pattern is why inflation is so problematic. It is addictive, and breaking the addiction means damaging the economy.”
Its Federal spending that addictive, and eventually Congress has to cut its insane spending levels. Even if it lowers GDP and increases unemployment. Take a look at China, a command economy, that is really suffering despite massive government spending.
Berenson is saying “all the Biden defenders are saying we’ve won the battle with inflation. But how can that be so with how much we’ve spent?” I agree, but will Washington DC ever learn? I doubt it.
Under Obama/Biden, the US economy is transitioning from a demand economy to a Soviet/Chinese-style command economy where central government directs economic traffic. We need to bite the bullet and return to a deamnd economy.
I don’t know whether Cap’n (Credit) Crunch is Fed Chair Powell or the big spender Boss (Tweed) Biden?
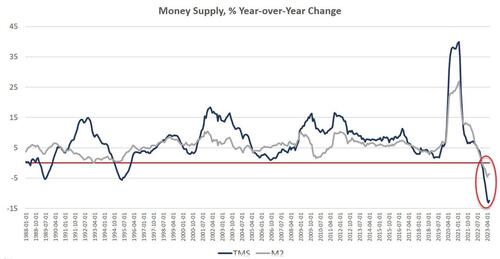
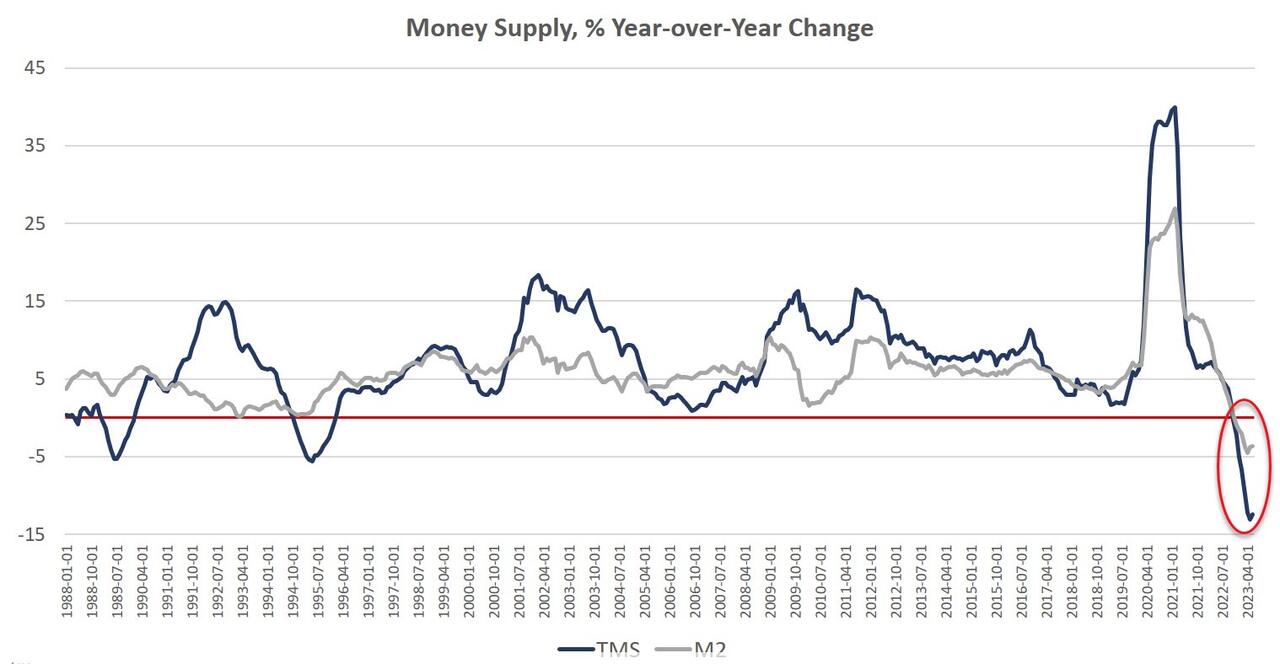
Money supply growth fell again in June, remaining deep in negative territory after turning negative in November 2022 for the first time in twenty-eight years. June’s drop continues a steep downward trend from the unprecedented highs experienced during much of the past two years.
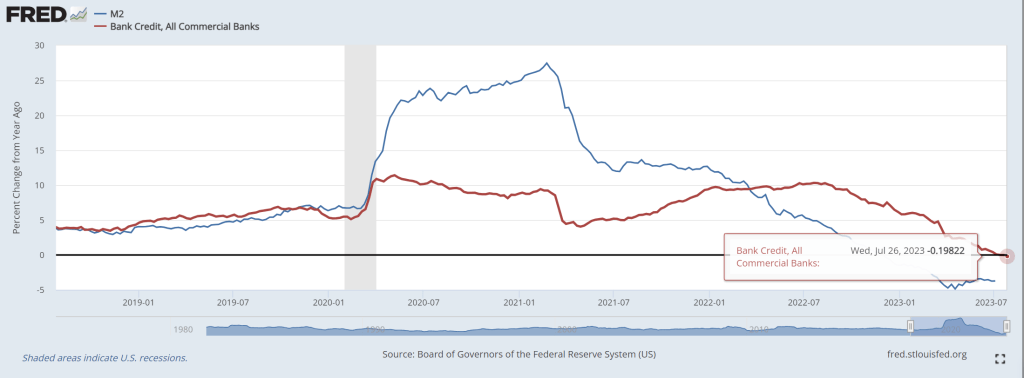
And with M2 Money growth down for 8 consecutive months, bank credit down -0.2% YoY.
Since April 2021, money supply growth has slowed quickly, and since November, we’ve been seeing the money supply repeatedly contract—year-over-year— for six months in a row. The last time the year-over-year (YOY) change in the money supply slipped into negative territory was in November 1994. At that time, negative growth continued for fifteen months, finally turning positive again in January 1996.
Money-supply growth has now been negative for eight months. During June 2023, the downturn continued as YOY growth in the money supply was at –12.4 percent. That’s up slightly from May’s rate of –13.1 percent, and was far below June’s 2022’s rate of 5.7 percent. With negative growth now falling near or below –10 percent for the third month in a row, money-supply contraction is the largest we’ve seen since the Great Depression. Prior to March through June of this year, at no other point for at least sixty years has the money supply fallen by more than 6 percent (YoY) in any month.
The money supply metric used here—the “true,” or Rothbard-Salerno, money supply measure (TMS)—is the metric developed by Murray Rothbard and Joseph Salerno, and is designed to provide a better measure of money supply fluctuations than M2.
The Mises Institute now offers regular updates on this metric and its growth. This measure of the money supply differs from M2 in that it includes Treasury deposits at the Fed (and excludes short-time deposits and retail money funds).
In recent months, M2 growth rates have followed a similar course to TMS growth rates, although TMS has fallen faster than M2. In June 2023, the M2 growth rate was –3.5 percent. That’s slightly up from May’s growth rate of –3.7 percent. June 2023’s growth rate was also well down from June 2022’s rate of 5.6 percent.
Money supply growth can often be a helpful measure of economic activity and an indicator of coming recessions. During periods of economic boom, money supply tends to grow quickly as commercial banks make more loans. Recessions, on the other hand, tend to be preceded by slowing rates of money supply growth.
It should be noted that the money supply does not need to actually contract to signal a recession and the boom-bust cycle. As shown by Ludwig von Mises, recessions are often preceded by a mere slowing in money supply growth. But the drop into negative territory we’ve seen in recent months does help illustrate just how far and how rapidly money supply growth has fallen. That is generally a red flag for economic growth and employment.
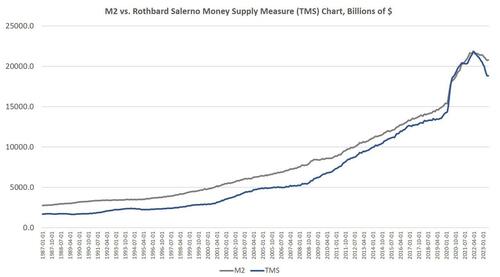
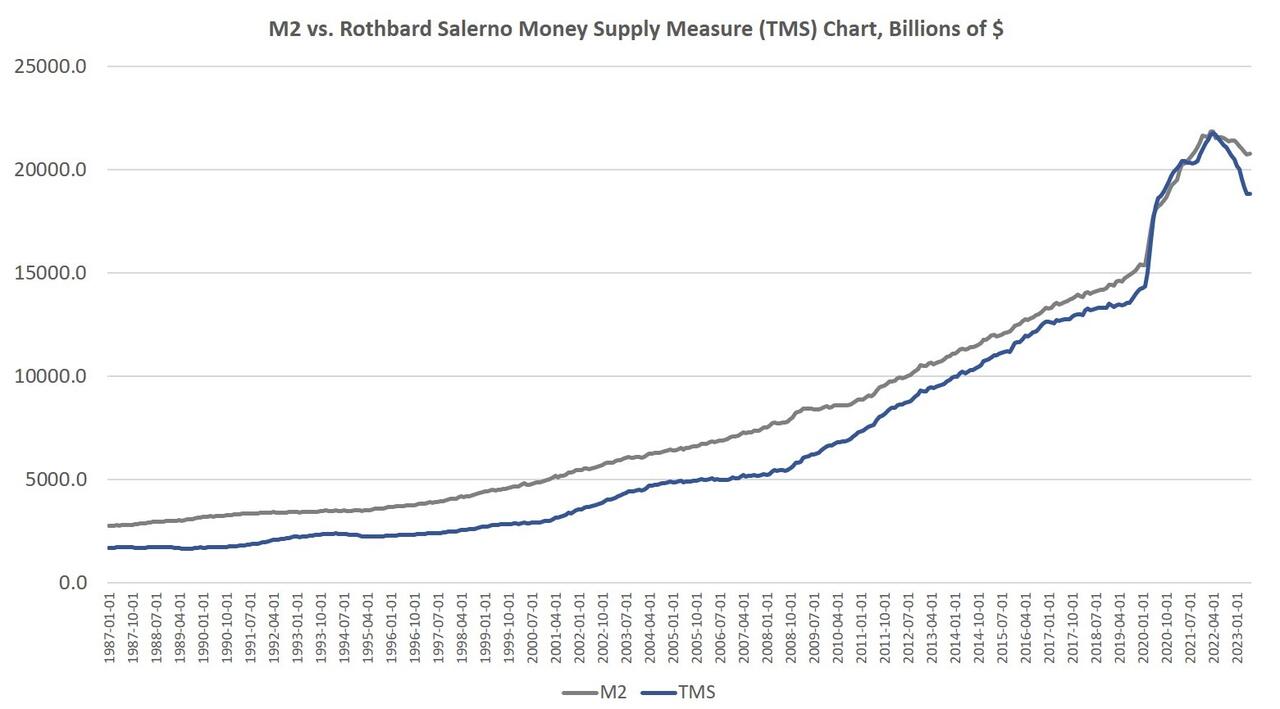
The fact that the money supply is shrinking at all is so remarkable because the money supply almost never gets smaller. The money supply has now fallen by $2.8 trillion (or 15.0 percent) since the peak in April 2022. Proportionally, the drop in money supply since 2022 is the largest fall we’ve seen since the Depression. (Rothbard estimates that in the lead up to the Great Depression, the money supply fell by 12 percent from its peak of $73 billion in mid-1929 to $64 billion at the end of 1932.)
In spite of this recent drop in total money supply, the trend in money-supply remains well above what existed during the twenty-year period from 1989 to 2009. To return to this trend, the money supply would have to drop at least another $4 trillion or so—or 22 percent—down to a total below $15 trillion.
Since 2009, the TMS money supply is now up by nearly 184 percent. (M2 has grown by 146 percent in that period.) Out of the current money supply of $18.8 trillion, $4.5 trillion of that has been created since January 2020—or 24 percent. Since 2009, $12.2 trillion of the current money supply has been created. In other words, nearly two-thirds of the money supply have been created over the past thirteen years.
With these kinds of totals, a ten-percent drop only puts a small dent in the huge edifice of newly created money. The US economy still faces a very large monetary overhang from the past several years, and this is partly why after fourteen months of slowing money-supply growth, we are not yet seeing a sizable slowdown in the labor market.
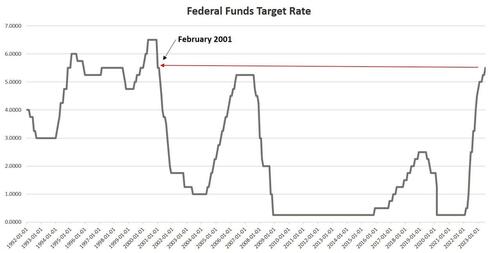
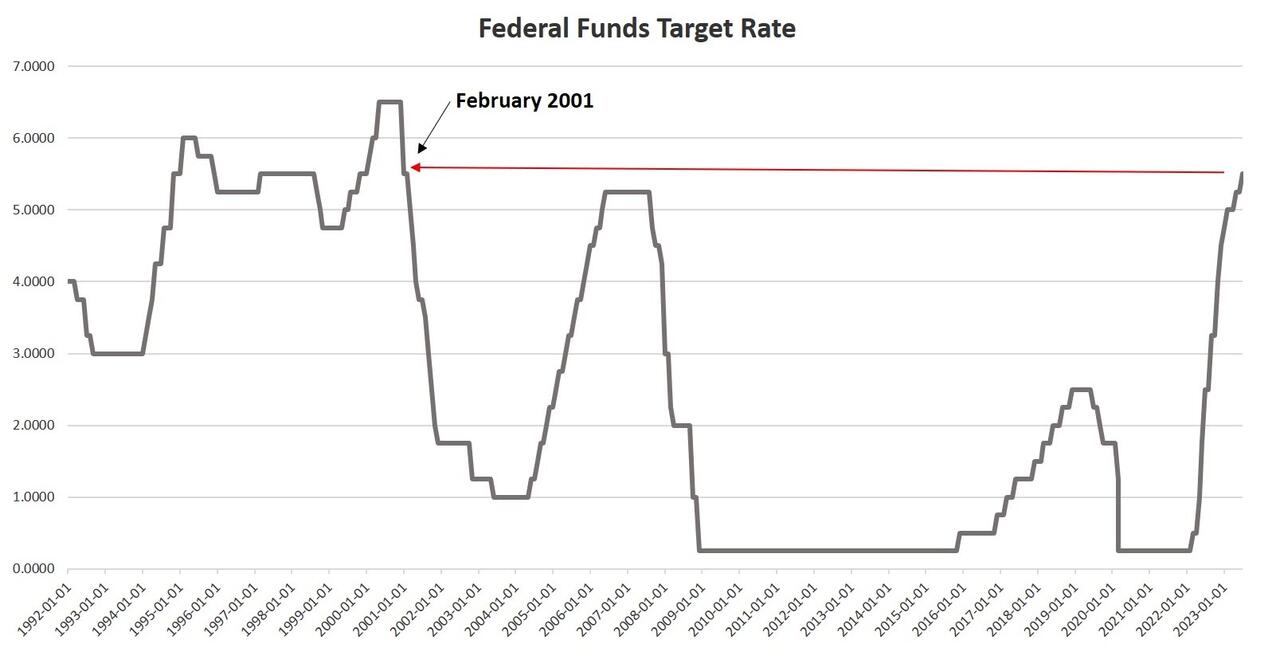
An inflationary boom begins to turn to bust once new injections of money subside, and we are seeing this now. Not surprisingly, the current signs of malaise come after the Federal Reserve finally pulled its foot slightly off the money-creation accelerator after more than a decade of quantitative easing, financial repression, and a general devotion to easy money. As of July, the Fed has allowed the federal funds rate to rise to 5.50 percent, the highest since 2001. This has meant short-term interest rates overall have risen as well. In June, for example, the yield on 3-month Treasurys remains near the highest level measured in more than 20 years.
Without ongoing access to easy money at near-zero rates, however, banks are less enthusiastic about making loans, and many marginal companies will no longer be able to stave off financial trouble by refinancing or taking out new loans. For example, Yellow Corporation, a trucking company, has declared bankruptcy and will lay off 30,000 workers. Tyson Foods announced this week it is closing four chicken processing plants in an effort to cut costs. 3,000 workers are likely to lose their jobs as a result. These firms have experienced financial problems for years, but rising interest rates preclude additional delays of the inevitable. We will see more of this as more companies face the realities of higher rates. (In another sure sign of a slowing economy, state and local tax revenues have been falling.)
Meanwhile, as lenders get spooked by tightening cash availability, it’s getting more difficult to qualify for a home loan, and credit availability is the tightest its been in a decade. Meanwhile, the average 30-year mortgage rate rose in July to nearly the highest point since 2002.
One of the most troubling indicators is soaring credit card debt even as interest rates soar. As of May 2023, the commercial bank interest rate rose to the highest rate measured in at least 30 years. Just last year, the interest rate hovered around 15 percent. In May 2023, it reached over 20 percent. This is happening as credit card debt and other revolving loans have reached a new all-time high.
These factors all point toward a bubble that is in the process of popping. The situation is unsustainable, yet the Fed cannot change course without reigniting a new surge in price inflation. Any surge in prices would be especially problematic given the rising cost of living. Both new and used cars are becoming increasingly unaffordable. Ordinary Americans face a similar problem with homes. According to the Atlanta Fed, the housing affordability index is now the worst it’s been since 2006, in the midst of the Housing Bubble.
If the Fed reverses course now, and embraces a new flood of new money, prices will only spiral upward. It didn’t have to be this way, but ordinary people are now paying the price for a decade of easy money cheered by Wall Street and the profligates in Washington. The only way to put the economy on a more stable long-term path is for the Fed to stop pumping new money into the economy. That means a falling money supply and popping economic bubbles. But it also lays the groundwork for a real economy—i.e., an economy not built on endless bubbles—built by saving and investment rather than spending made possible by artificially low interest rates and easy money.
Either Powell is Cap’n (Credit) Crunch or Boss Biden because of his insane spending spree helping inflation hit 40 year high is Cap’n (Credit) Crunch.
While looking up baseball statistics, I found this picture of former Cincinnati Reds outfielder Wally Post. Or is that actor Nick Searcy from “Justified”?
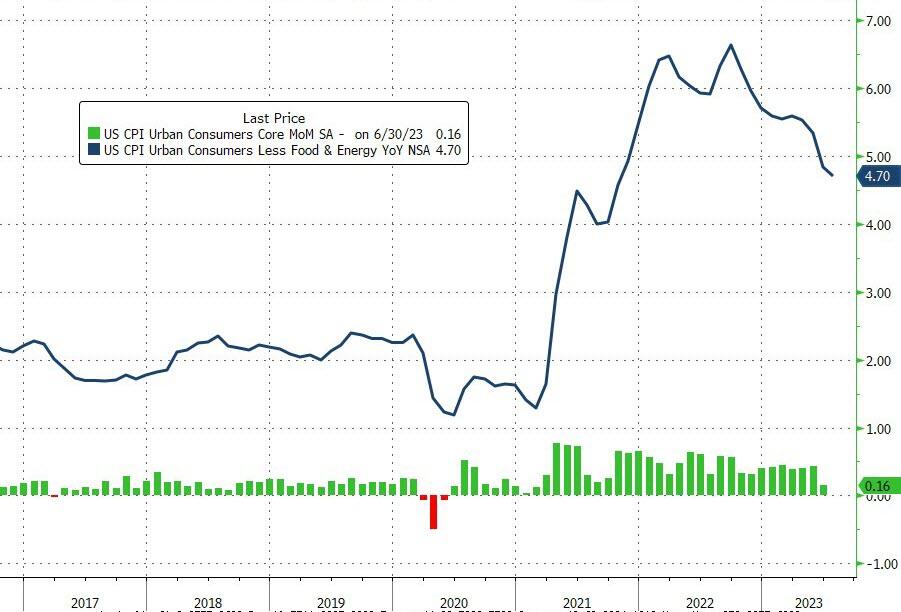
Welcome to Boss Biden’s America! It reminds of woefully corrupt Boss Tweed and Tammany Hall in New York City. Today’s inflation report revealed that core CPI YoY was 4.7%. Ugh!
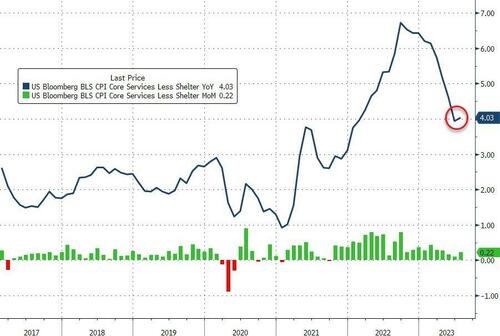
Expectations for this morning’s must-watch CPI print were for a MoM and YoY rise in the headline, and modest slowing of the core YoY. However, The Fed will be watching its new favorite signal – Core Services CPI Ex-Shelter – which reaccelerated in July (+0.2% MoM, and from +3.9% to +4.0% YoY).
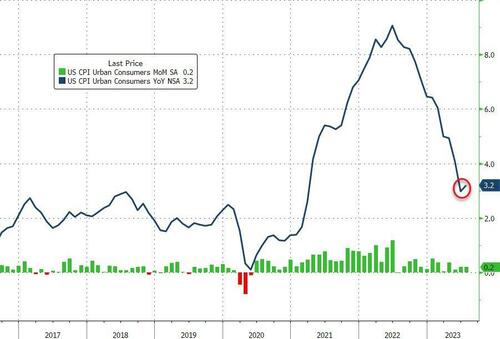
The headline CPI rose 0.2% MoM in July (as expected), the same as in June, pushing the YoY up to 3.2% (from 3.0% in June) but below the 3.3% expected…
Source: Bloomberg
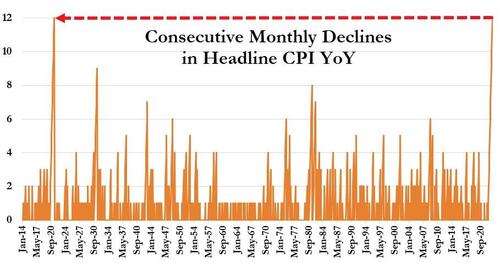
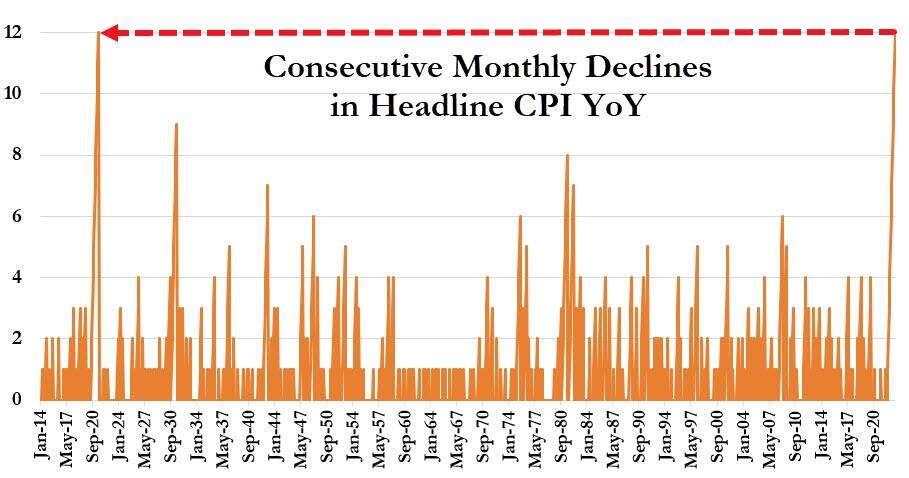
Today’s increase in CPI YoY broke the record-equaling streak of 12 straight months of declines.
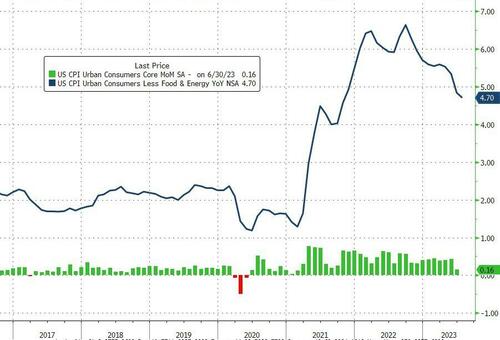
Core CPI rose 0.16% MoM, with the YoY growth in prices slowing to 4.7%.
Source: Bloomberg
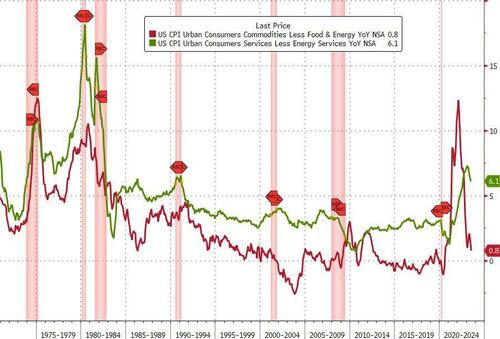
Both Goods and Services inflation (YoY) slowed in July – but Services remain extremely high at +6.1%…
Source: Bloomberg
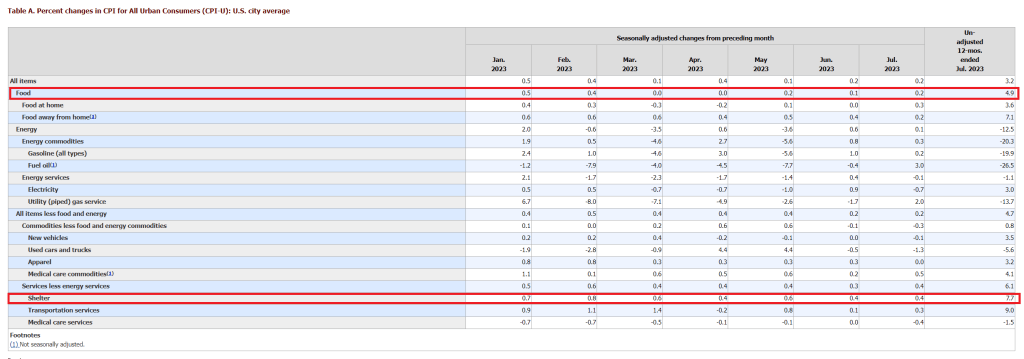
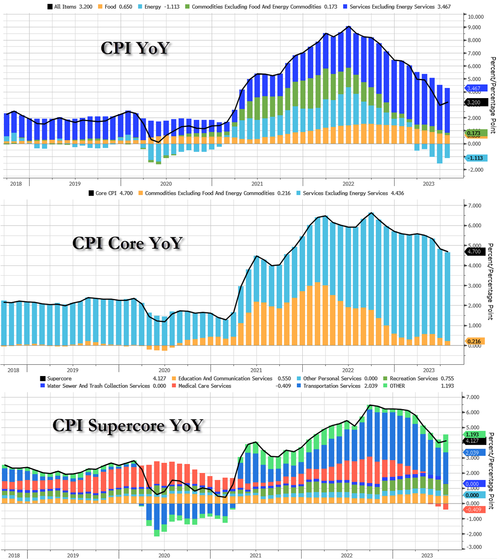
On an annual basis, the index for all items less food and energy rose 4.7% over the past 12 months with the shelter index rising 7.7% over the last year, accounting for over two-thirds of the total increase in all items less food and energy.
Other indexes with notable increases over the last year include motor vehicle insurance (+17.8 percent), recreation (+4.1 percent), new vehicles (+3.5 percent), and household furnishings and operations (+2.9 percent).
Source: Bloomberg
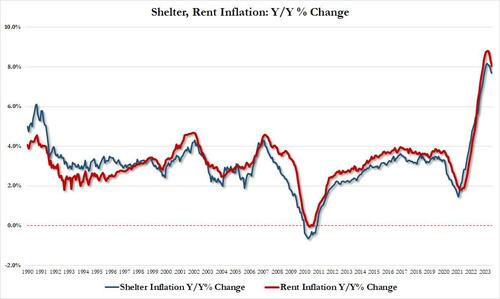
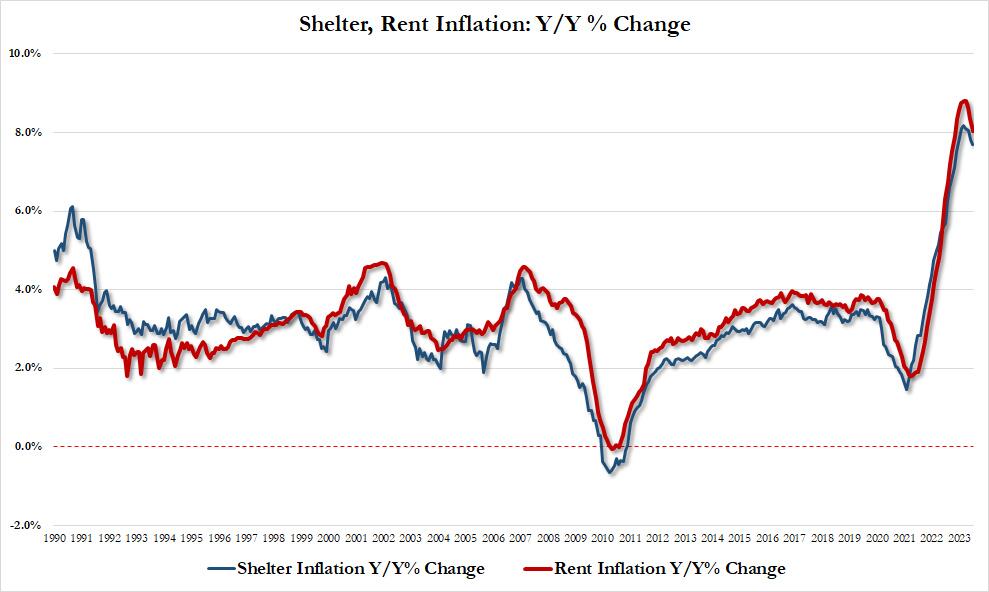
Taking a closer look at the all important shelter index, while it is still growing both sequentially and annually, the slowdown in growth is increasing more visible:
Shelter inflation up 7.69% YoY in July vs 7.83% in June, lowest since Dec 22; also up 0.43% MoM, lowest monthly increase since Jan 22
Rent inflation up 8.03% in July vs 8.33% in June, lowest since Nov 22; also up 0.41% MoM, lowest since March 22
The silver lining here, as noted by former Fed staffer Julia Coronado, is that “we are seeing core inflation slow before the expected big step down in rent/oer” which is great news as “lots of price sensitivity in travel and core goods that was slow to take hold but is now fully coming through.” In other words, if and when rent/shelter inflation actually post a decline (with the usual 12-18 month BLS lag), the Fed will be scrambling to fight inflation.
Turning to the wage aspect, for the second month in a row, ‘real’ wages rose YoY in July (but barely, +0.2%), and it appears that we are about to dip back into real contraction next month.
Source: Bloomberg
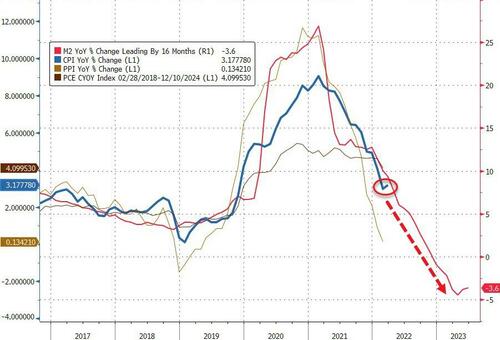
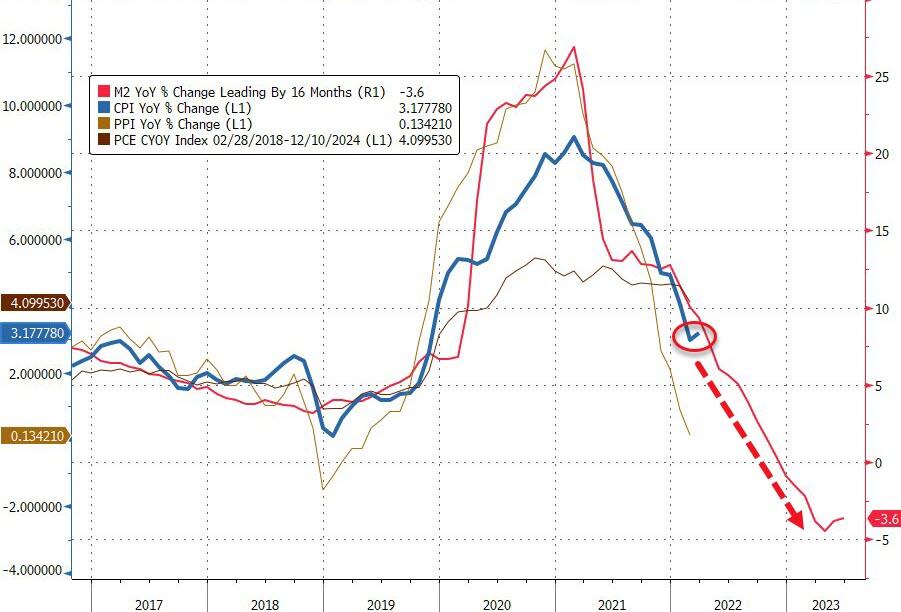
So the question becomes – is this an inflection point in inflation? (or is M2 still leading the way?)
Source: Bloomberg
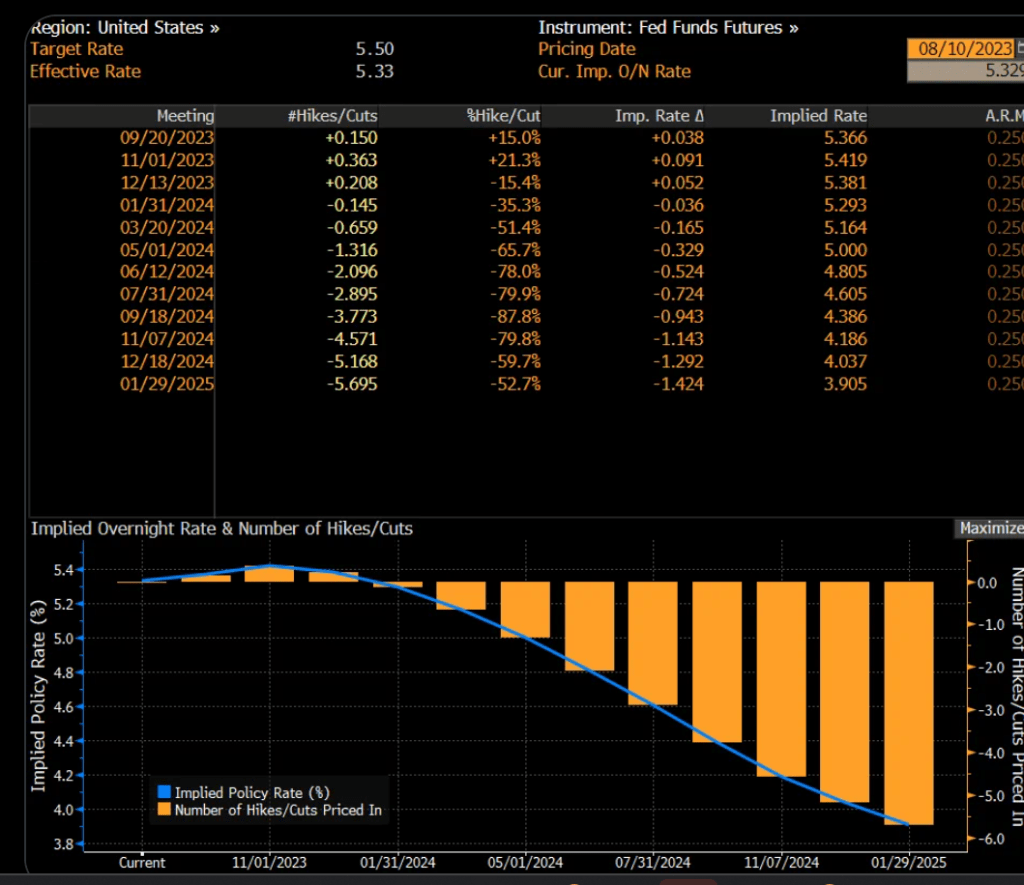
Yet, Fed Funds Futures are pointing to no further Fed rate hikes.
With House Republicans releasing bank records showing over $20 million in payments to Biden family, associates, and Democrats denying any wrongdoing, I think we are seeing the Biden Administration as a rebirth of New York City’s Tammany Hall corrupt political machine led by Boss Tweed. Since Biden’s malfeasance/influence peddling occurred when he was Vice President under Barack Obama (aka, Barry Soetoro), Obama is the new Bathhouse John Coughlin the woefully corrupt Chicago Alderman and Hunter Biden is the new Hinky Dink (Michael Kenna, also a woefully corrupt Chicago Alderman).
Bathhouse Barry Soetoro, Boss Biden and Hinky Hunter at a basketball game.
US average hourly earnings continued at 4.4% year-over-year (YoY). However, the last core inflation reading was 4.8% YoY, so real wages continue to decline.
Rent CPI for June was 7.8% YoY.
Here is the rest of the story.
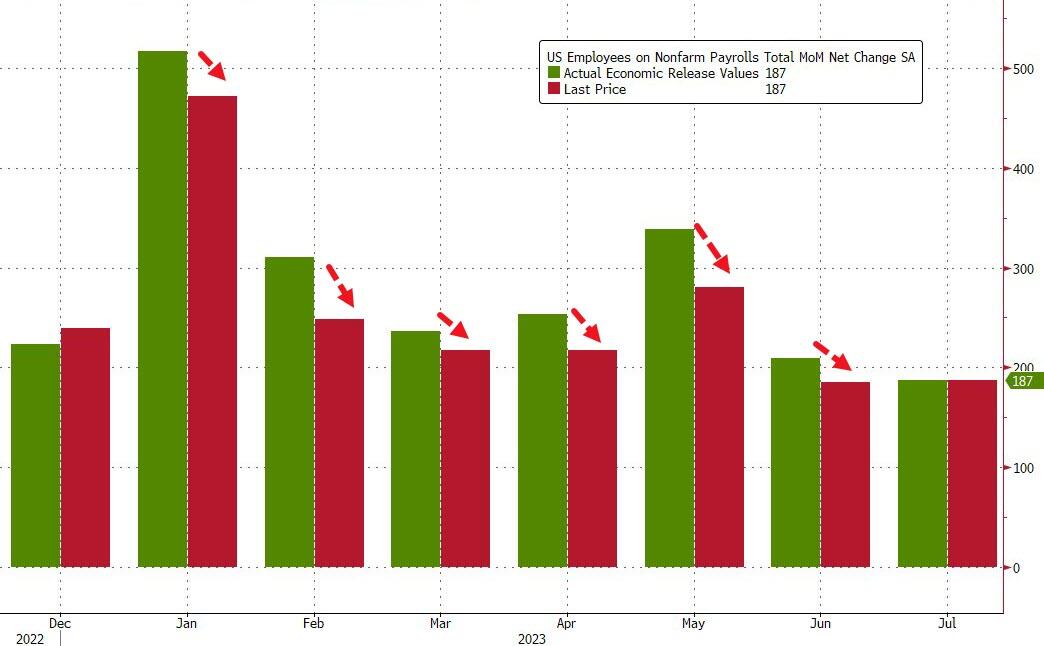
In keeping in with Biden admin’s penchant of constantly fabricating data, both May and June numbers were revised sharply lower of course:
May revised down by 25,000, from +306,000 to +281,000
June was revised down by 24,000, from +209,000 to +185,000.
To show just how ridiculous the data manipulation is, consider this chart – every monthly payrolls report in 2023 has been revised lower.
And on the disappointing jobs report and massive revisions of past data (the REAL inflation plaguing the nation is The Federal goverment lying about data), the US Treasury 2 year yield dropped like Biden on a flight of stairs.
Here are the faces of Washington DC. Lies, corruption, government for sale to highest bidder, cynacism, oppression, fear mongering, etc. This is Biden’s legacy.


You must be logged in to post a comment.