The US is already at $35+ trillion with unfunded liabilties totalling $218+ trillion. Of course, the Biden Administration is attempting to cut Medicare for seniors and raise the price while handing out unlimited benefits to illegal immigrants.
.Given the financial burden of war, the country suspended interest payments on international debt over the last two years, which was set to expire on August 1, 2024.
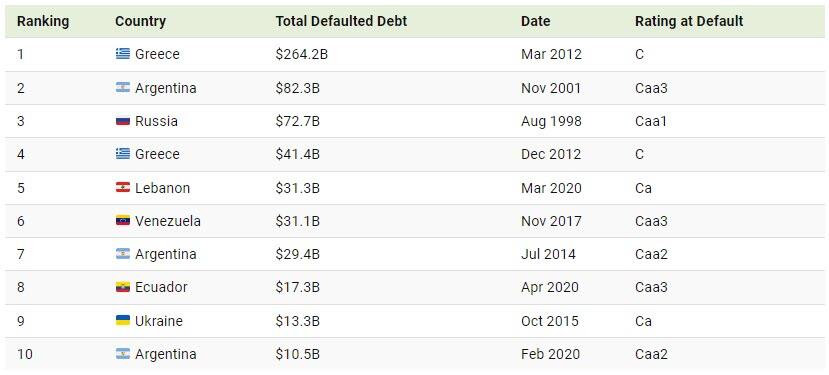
Without this new debt restructuring, this default would have ranked among the 10 largest in recent history. The last time Ukraine defaulted on its debt was in 2015, after Russia’s invasion of Crimea.
Below, we show the biggest sovereign debt defaults between 1983 and 2022:
Greece’s $264.2 billion default in 2012 stands as the largest overall, unfolding when the country was mired in recession for the fifth consecutive year.
The country defaulted again just nine months later, making it the fourth-largest ever. Leading up to the crash, Greece ran significant deficits despite being one of the fastest-growing countries in Europe. Furthermore, in 2009, the newly elected prime minister revealed that the country was $410 billion in debt—substantially more than previous estimates.
With the second-highest default recorded, Argentina failed to repay interest on $82.3 billion in foreign debt in 2001. Like Greece, it is a repeat offender, defaulting numerous times since independence in 1816. Today, Argentina is the largest debtor to the International Monetary Fund, despite being Latin America’s third-largest economy.
Following next in line is Russia’s 1998 default on $72.7 billion in loans, coinciding with a currency crisis that erased more than two-thirds of the ruble’s value in a matter of weeks. That year, several other countries including Venezuela, Pakistan, and Ukraine defaulted on their debts after the Asian Financial Crisis of 1997 spurred instability in global financial markets.
Just as 1998 saw a wave of defaults, 2020 was a year marked by major debt upheavals. Due to the pandemic and collapsing oil prices, it was a record year for sovereign defaults, reaching seven in total. Among these, Lebanon, Ecuador, and Argentina saw the largest defaults amid deepening fiscal pressures.
Harris is just another free-spending politician who will eventually lead the US into default. But at least Harris/Walz exude joy.
At least Harris/Walz haven’t adopted (stolen) the phrase “Work makes one free”.
The jointly signed letter, first reported by Axios, says the economic agenda of U.S. President Joe Biden, a Democrat, is “vastly superior” to Trump’s, the former Republican president seeking a second term.
Read the source article from Reuters for the rest of the Marxist clown show. What Joe Stiglitz and other Leftist economists are cheerleading in the excessive post Covid spending spree that Biden and Congress went on. There is a different between a free market system and government directed spending, usually on large donors.
One source of crippling inflation under Biden is (wasteful) government spending, up 37.7% under Biden. Federal debt is up a nauseating 50% under Biden. These levels of spending and debt are NOT sustainable!
Another souce of inflation under Biden has been The Federal Reserve. With Covid. The Fed entered like gangbusters dropping their target rate to 25 basis points and massively increasing their balance sheet. Call this BIDEN 1. Then to squelch inflation, The Fed raised their target rate and slowly started to unwind the balance sheet. We saw a slowing of inflation. Nothing to do with Biden, although I am sure he will take credit for it at Thursday’s debate with Trump.
Inflation was growing rapidly in Biden 1, but inflation started to slow (Biden 2) as The Fed rapidly raised their target rate.
Well, perhaps bot a genuine surprise. We are aware that the US economy has been slowing as the massive fiscal and monetary stimulus from Covid is wearing out.
The economics surprise index slumped to -28.10, the lowest since 2022.
I feel like the US economy is experiening a Ragnarok change. With the giants (World Economic Forum/UN. etc) winning.
Now you know why Joe Biden has fund raisers in Hollywood and New York where the elites (the top 1%) live. Biden is the President of The Elites, not the middle class.
How bad it is? The top 1% now have more household wealth than the entire middle class. Note that the recent surge occurred under Trump, but Biden is doing nothing about it.
Further evidence? 46% of households are struggling.
In terms of housing prices, home prices are growing FASTER than average hourly earnings. Again!
Politicians. You can’t trust ANY of them with our money. Or a cookout.
Here is New Yprk Senator Chuck Schumer posing as a middle class American cooking gray hamburgers at super low heat with cheese on top of raw meat. What a fraud!
This prediction only got warmer two months later when, inexplicably, Japan’s Norinchukin bank, best known as Japan’s CLO whale, was quietly added to the list of counterparties for the Fed’s Standing Repo Facility, a/k/a the Fed’s foreign bank bailout slush fund.
But if that was the first, and still distant, sign that something was very wrong at one of Japan’s biggest banks (Norinchukin is Japan’s 5th largest bank with $840 billion in assets) today the proverbial canary stepped on a neutron bomb inside the Japanese coalmine, because according to Nikkei, Norinchukin Bank “will sell more than 10 trillion yen ($63 billion) of its holdings of U.S. and European government bonds during the year ending March 2025 as it aims to stem its losses from bets on low-yield foreign bonds, a main cause of its deteriorating balance sheet, and lower the risks associated with holding foreign government bonds.”
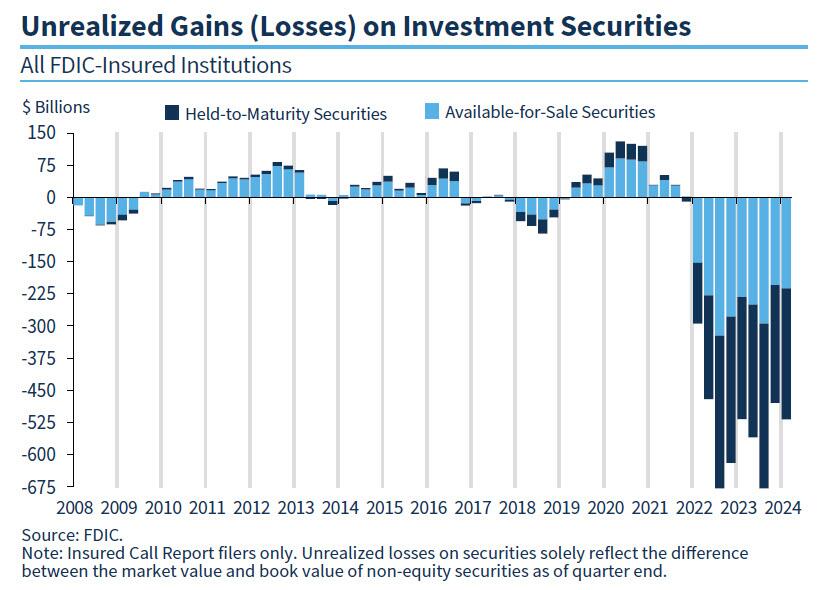
See, what’s happened in Japan is not that different from what is happening in the US, where as the FDIC keeps reminding us quarter after quarter, US banks are still sitting on over half a trillion dollars in unrealized losses, as a result of the huge jump in interest rates which has blown up the banks’ long-duration fixed income holdings, sending them trading far below par and forcing banks (and the Fed, see BTFP) to come up with creative ways of shoving these massive losses under the rug.
And while Japanese rates have barely budged – the BOJ only just raised rates for the first time in decades in April – the move is already cascading into the form of huge losses for domestic banks, which have been hammered twice as hard due to their holdings of offshore debt which until 2021 was viewed as risk free, only to blow up in everyone’s face two years ago when the bull market since the early 1980s ended with a bang.
Enter Norinchukin: according to the Nikkei, the company’s net loss for the year ending March 2025, which was previously forecast to top 500 billion yen, will rise to the 1.5 trillion yen level with the bond sales.
“We plan to sell low-yield [foreign] bonds in the amount of 10 trillion yen or more,” Norinchukin Bank CEO Kazuto Oku told Nikkei, an amount just above $60 billion.
Facing a problem that is very familiar to all US banks, Oku said the bank “acknowledged the need to drastically change its portfolio management” to reduce unrealized losses on its bonds, which totaled roughly 2.2 trillion yen as of the end of March. Oku explained bank’s intention to shift its investments, saying, “We will reduce [sovereign] interest rate risk and diversify into assets that take on corporate and individual credit risk.”
Now, if Nochu, as it is affectionately known by bankruptcy lawyers, was a US bank circa one year ago, it would not have to sell anything: it could just pledge all of its sharply depreciated bonds at the Fed’s BTFP facility, and get a par value for them.
Unfortunately, Nochu is not US but Japanese, and it is not 2023 but rather 2024, when the high-rate disaster of 2023 was supposed to be over. Supposed to be… but instead it’s only getting worse. Regular readers will hardly need it, but for novices Nikkei gives the following quick primer: “Interest rates in the U.S. and Europe have risen and bond prices are down. This reduced the value of high-priced (low-yielding) foreign bonds that Norinchukin purchased in the past, causing its paper losses to swell.”
So faced with no other options, Nochu is doing the only thing it can: an orderly liquidation of tens of billions of securities now, when they are still liquid and carry a high price, in hopes of avoiding a disorderly liquidation and much worse, in a few months when the bond market freezes up.
And yes, the Japanese rates canary is quite, quite massive: as of the end of March, Norinchukin had approximately 23 trillion yen of foreign bonds (about $150 billion), amounting to 42% of its total 56 trillion yen of assets under management.
To get some sense of the scale, according to the Bank of Japan, outstanding foreign bonds held by depositary financial institutions amounted to 117 trillion yen as of the end of March. Norinchukin, which is a major institutional investor in Japan, holds as much as 20% of the total on its own! And those asking, yes: once Nochu begins selling, all others will have to join the club!
But why start the selling now? Because, as we warned last October when we predicted that the next bank crisis will be in Japan, the Japanese mega-bank now believes interest rate cuts in the U.S. and Europe are likely to take longer than it previously expected, it will try to significantly cut its unrealized losses by selling foreign bonds in fiscal 2024.
And so, Norinchukin plans to sell over 10 trillion yen in foreign bonds, in addition to its normal trading activities.
The rest of the story is filler: in attempt to divert attention from the 10 trillion yen elephant in the room, the Nikkei then wastes time discussing the bank’s other “alternatives” to wit:
The company is now considering investment alternatives, including equities, corporate bonds, corporate loans and private equity, as well as securitized products such as corporate loan-backed securities and mortgage-backed securities. By diversifying its portfolio, it aims to prevent unrealized losses from expanding to the point where they become a concern for management. It will also try to replace some low-yielding foreign government debt with other such bonds offering higher interest rates.
What are you talking about? What diversification? Once the selling begins, the bank will be lucky if it can get even a fraction of the proceeds it hopes for (because all the other banks won’t just be standing there twiddling their thumbs, as they wait to see how massively Nochu reprices the market).
And it’s not just banks: if and when the selling begins by a bank that holds 20% of all foreign bonds in Japan, the liquidation cascade will quickly spread to Mrs Watanabe. According to the U.S. Treasury Department, Japanese investors held $1.18 trillion of U.S. government bonds as of March, the largest slice among foreign holders.
Needless to say, but the Nikkei does so anyway, “Massive sales by Norinchukin could have a sizable effect on the U.S. bond market.”
And since we now know what is happening, it is only a matter of time before everyone else frontruns Norinchukin.
What happens next will be even uglier: since the bank will no longer be able to mask its fixed income losses under the guise of accounting sleight of hand, the bank’s financial results for the period ending March 2025 will “deteriorate significantly as a result of the huge divestment of foreign bonds and turn paper losses into real ones.” As of May, Norinchukin put its final loss at more than 500 billion yen, but this is now expected to reach the 1.5 trillion yen level.
A little more context: back in the immediate aftermath of the global financial crisis, in the year ending March 2009, Norinchukin posted a final loss of about 570 billion yen due to impairment of securitized products. The forecast loss for this fiscal year is expected to top the previous record by roughly 1 trillion yen. Nevertheless, Oku said that putting the losses on the books in the year ending next March will “improve [the bank’s] finances and portfolio, thus enabling to move into the black in the period ending March 2026.”
Spoiler alert: no it won’t… and that’s why the bank is now scrambling to share the pain with even greater fools, i.e., “investors.”
According to the Nikkei, Norinchukin Bank is considering raising 1.2 trillion yen to shore up its finances. It has already started discussions with Japan Agriculture Cooperatives, one of its main investors, and others. Of course, the question of who in their right mind would lend the bank good money to plug an even bigger hole that is about to open up, is anyone’s guess.
But that won’t stop the bank from doing what it has to, now that it has picked the liquidation route: and once the selling flood begins, it won’t end as these flashing red headlines from Bloomberg just confirmed:
*NORINCHUKIN TO SELL US, EUROPEAN SOVEREIGN BONDS GRADUALLY
*NORINCHUKIN ALSO WEIGHS LOCAL, OVERSEAS BONDS, PROJECT FINANCE
*NORINCHUKIN EYES ASSETS INCLUDING CLOS, STOCKS AFTER BOND LOSS
There’s a name for this: a firesale, but – drumroll – a “gradual” one, because that’s how firesales supposedly go in Japan.
Luckily, the one thing nobody has to guess, is what happens next: as the wonderful movie Margin Call laid out so very well, once you realize that the music has stopped, you have three choices: i) be first, ii) be smarter, or iii) cheat. In the case of Japan’s Norinchukin, it has decided the time has come to liquidate before everyone else. We wonder how “everyone else” will take this particular news…
Mortgage applications increased 0.1 percent from one week earlier, according to data from the Mortgage Bankers Association’s (MBA) Weekly Mortgage Applications Survey for the week ending April 5, 2024.
The Market Composite Index, a measure of mortgage loan application volume, increased 0.1 percent on a seasonally adjusted basis from one week earlier. On an unadjusted basis, the Index increased 0.2 percent compared with the previous week. The seasonally adjusted Purchase Index decreased 5 percent from one week earlier. The unadjusted Purchase Index decreased 4 percent compared with the previous week and was 23 percent lower than the same week one year ago.
The Refinance Index increased 10 percent from the previous week and was 4 percent higher than the same week one year ago.
We are living in the USA where corruption, favoritism, open borders and an out-of-control Federal budget and debt are destroying this once great nation.
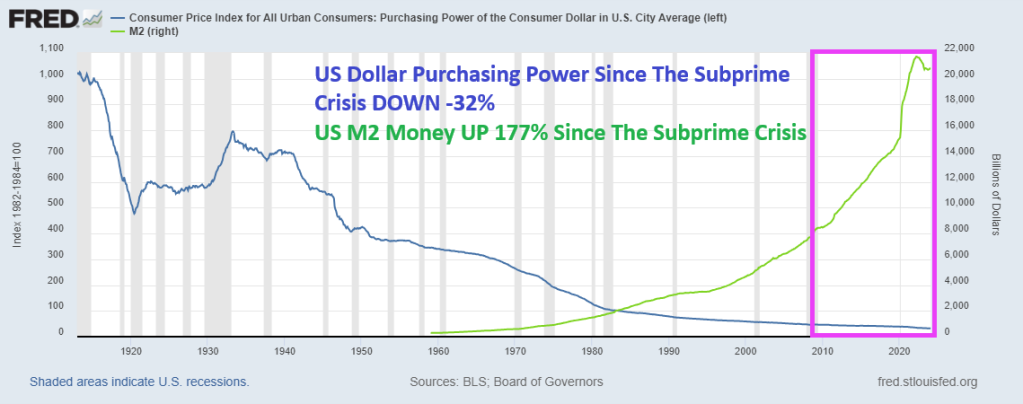
Former Kansas City Fed President Thomas M. Hoenig was absolutely right when he said recently that The Federal Reserve panders to Wall Street, Congress and special interest groups, prioritizing immediate relief over financial stability. Bernanke’s zero-interest rate policies (ZIRP) and Quantitative Easing (QE) were short-term fixes that never went away. Indeed, since the subprime mortgage crisis of 2008-2009, US Dollar purchasing power is DOWN -32% and M2 Money is up a staggering 177%. While Yellen stuck with zero-interest policies until Trump was elected, then raised The Fed Funds Target Rate 8 times. Yellen only raised the target rate once under Obama. Clearly playing political favoritism.
The Federal Reserve’s lack of transparency comes amidst reports that countries are removing their gold and other assets from the U.S. in the wake of the unprecedented Western sanctions imposed on Russia over its invasion of Ukraine. According to a 2023 Invesco survey, a “substantial percentage” of central banks expressed concern about how the U.S. and its allies froze nearly half of Russia’s $650 billion gold and forex reserves.Headline USA filed a FOIA request with the Fed for records reflecting how much gold the Federal Reserve Bank of New York currently holds in its vault, as well as records reflecting the ownership stake that each of FRBNY’s central bank/government clients have in that gold. The FOIA request also sought records about the Fed’s gold holdings prior to Russia’s February 2022 invasion of Ukraine. However, the Federal Reserve denied the FOIA request on Wednesday.
It influences the price of nearly everything, as well as the availability of jobs, the stability of our banking system, and the purchasing power of our money.
When the Fed Chair speaks, the entire world stops to listen.
But the average person has a poor understanding of how this colossally important entity operates. Or even why it exists.
And after a series of asset price bubbles — which some argue we’re in another one now — a chorus skeptical of the Fed’s actions has emerged.
So today we’re doing our best to shine as bright a light as possible on the Fed: how & why it operates, the good & as well as the shortcomings of its actions to date, what direction its policies are likely to take from here, and how all of this impacts the households of regular people like you and me.
Here are my top takeaways from from a speech by former KC Fed President Thomas Hoenig:
Dr Hoenig admits the Federal Reserve has experienced substantial “mission creep” since its creation as a lender of last resort. Its track record is very much “mixed” in terms of delivering on the intent of its policies. In Dr. Hoenig’s opinion, its efforts to add stability sometimes instead only create more instability.
While very critical of the Fed’s QE and ZIRP policies in the wake of the GFC, and more recently in the $trillions in monetary & fiscal stimulus unleashed post-COVID, Dr Hoenig thinks current Fed policy is “about right”. Though he expects the Fed to come under serious pressure soon as ebbing liquidity allows recessionary forces to build. He thinks the Fed will need to make an important decision within the coming year: return to QE and re-flame inflation, or allow a recession to occur.
Dr Hoenig criticizes the Federal Reserve for pandering to various interests, noting that short-term thinking and pressures from Wall Street, Congress, and interest groups often lead to decisions that prioritize immediate relief over long-term stability — a sort of “We’ll act now for optics sake and hopefully figure things out later”
In Dr Hoenig’s opinion, our fiscal policy is a runaway disaster. He criticizes both political parties of Congress for their roles in the cycle of ever-increasing deficits. Democrats advocate increased spending and tax hikes, while Republicans aim to keep taxes low but fail to curb spending. He warns of dire long-term consequences for future generations due to this impasse.
Dr Hoenig is very worried about the current stability of the banking system (and this from a former Direct of the FDIC!). He advocates for essential reforms to address government spending, prioritize essential areas without relying on future borrowed funds or inflationary measures, and communicate transparently with the public. He stresses the importance of reducing debt growth substantially below national income growth to avoid a full-blown crisis scenario in the future.
Dr Hoenig predicts the purchasing power of the US dollar (and other world fiat currencies) will continue to decline due to current policies and the lack of a “discipline” to money creation. Until such a discipline is restored (perhaps a return to some sort of hard backing of the currency), the dollar’s fall in purchasing power won’t abate.
Dr Hoenig suggests investing time in reading history and biographies as a valuable way to learn about leadership and gain insights into what strategies works and which don’t.
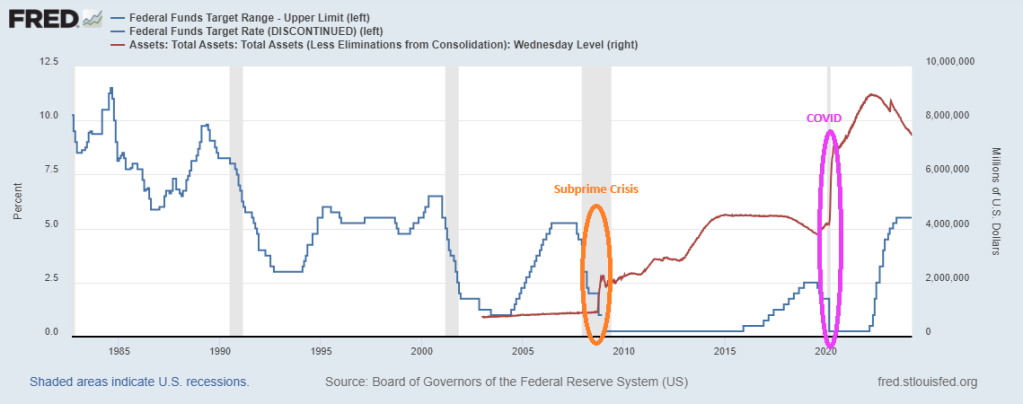
Here is the “Sound Money Parade” in 1896. By the aftermath of the subprime crisis, Janet Yellen (1993-2020) adopted the UNSOUND Money Fest, an orgy of printing and charging near zero interest rates. Powell in 2021 is ever-so-slowly unwinding The Fed’s balance sheet, but Powell has raised The Target Rate to its highest level since 1998 to fight inflation caused by Biden’s policies.
Combine The Fed not telling us how much gold they hold and their overprinting problems since 2008, and you can see why investors are turning to gold and silver and crypto currencies. The adoption of Central Bank Digital Currency (CBDC) is a step towards financial collapse.
Here is a parade you will NEVER see in Washington DC. A Sound Money Parade!
Powell is beginning to act like a sound money fan, but he still is taking his sweet time shriking the balance sheet.
I am thinking of fleeing to Lilliehammer Normay like Frank Tagliano.
Mortgage applications decreased 0.6 percent from one week earlier, according to data from the Mortgage Bankers Association’s (MBA) Weekly Mortgage Applications Survey for the week ending March 29, 2024.
The Market Composite Index, a measure of mortgage loan application volume, decreased 0.6 percent on a seasonally adjusted basis from one week earlier. On an unadjusted basis, the Index decreased 0.1 percent compared with the previous week. The seasonally adjusted Purchase Index decreased 0.1 percent from one week earlier. The unadjusted Purchase Index increased 1 percent compared with the previous week and was 13 percent lower than the same week one year ago.
The Refinance Index decreased 2 percent from the previous week and was 5 percent lower than the same week one year ago.
What a mess! With M2 Money up 8.4% under Biden (green line), home prices are up a staggering 39.2% under Sheriff Joe and his deputy Fed chair Jerome Powell.
And conforming mortgage rates (30Y) are up 148% under Biden’s Reign of Error.
Thanks O’Biden! Although Biden is the figurehead, Obama and his team are still running The White House. Regardess of whether it is Biden or Obama (or Soros/World Economic Forum) calling the shots, the US housing market is on a highway to hell.
Bidenomics “helping” the middle class and low wage workers.
Somehow, Biden left this factoid out of his State of The Union (SOTU) address. In February, immigrants added 1,277 million jobs while native Americans lost -420,000 jobs according to the BLS. Or maybe Biden can change his campaign motto to “Make America Great Again … For Immigrants, NOT Natives.”
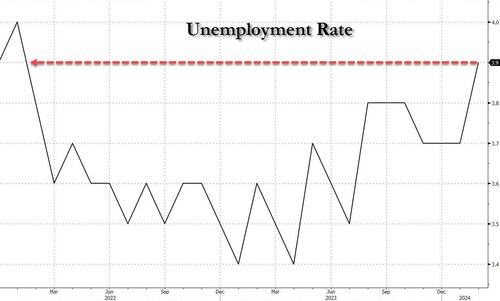
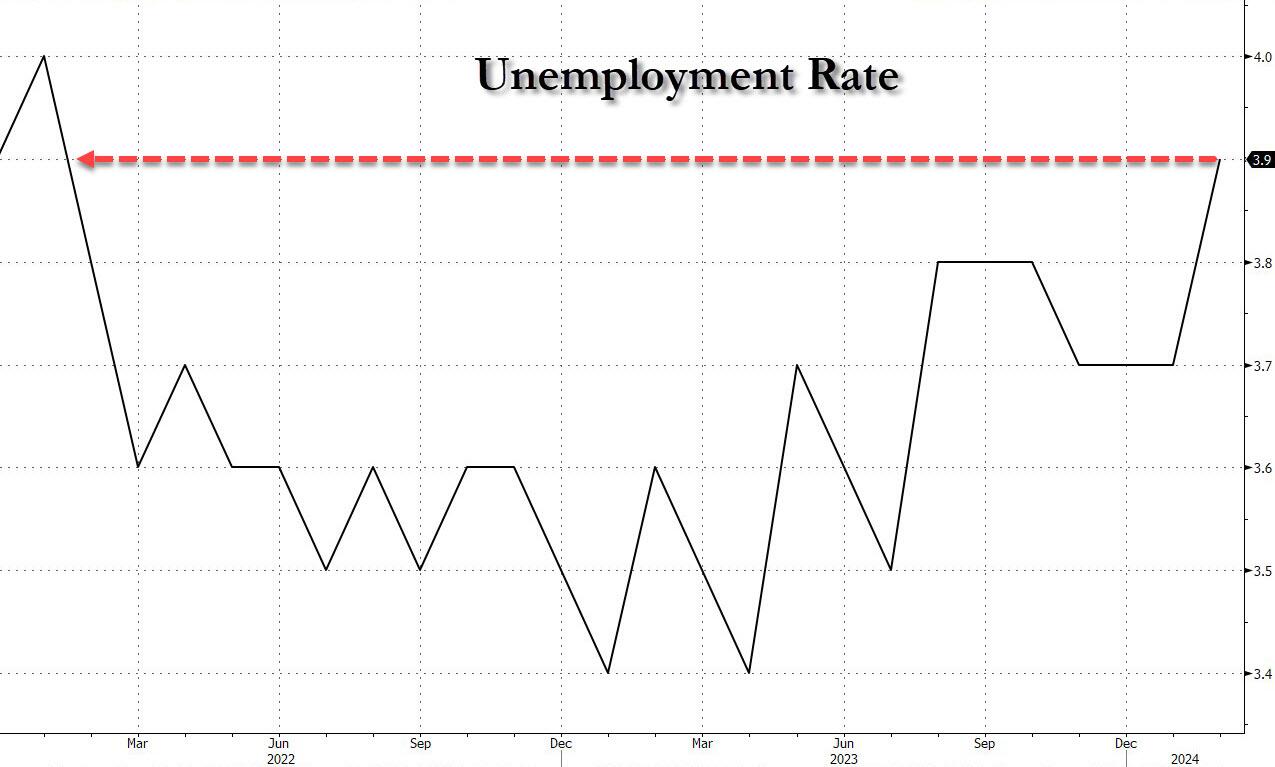
In February, the unemployment rate unexpectedly jumped to 3.9%, the highest since February 2022 (with Black unemployment spiking by 0.3% to 5.6%).
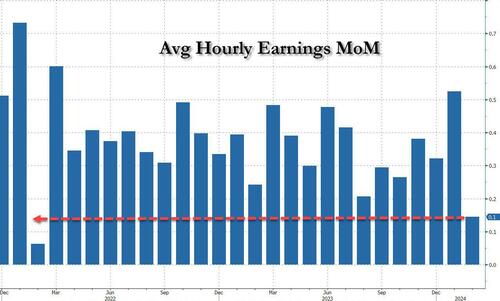
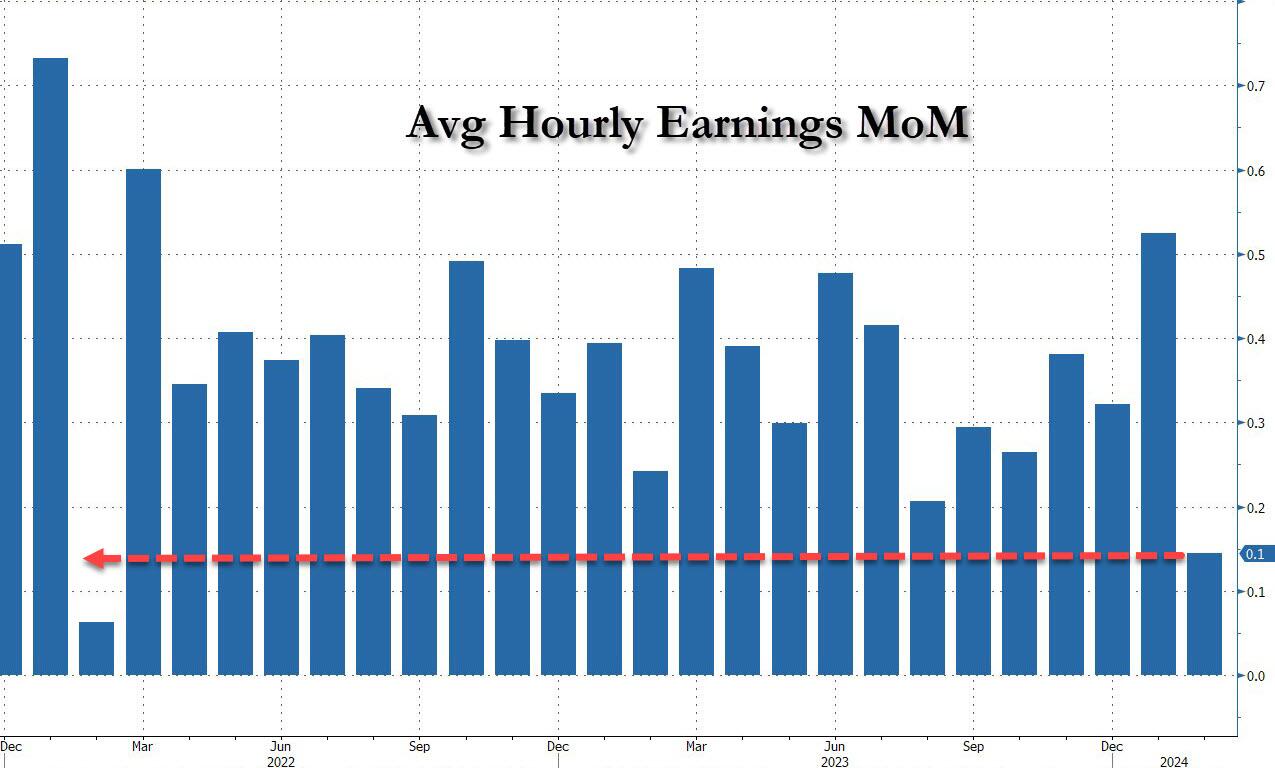
And then there were average hourly earnings, which after surging 0.6% MoM in January (since revised to 0.5%) and spooking markets that wage growth is so hot, the Fed will have no choice but to delay cuts, in February the number tumbled to just 0.1%, the lowest in two years…
It is clear that the labor market is softening, but Biden/Mayorkas will continue to let millions of illegal immigrants pour across the border making the labor market even softer than before. But the top 1% are making out like bandits from the illegal immigration. Bandits benefitting bandits.
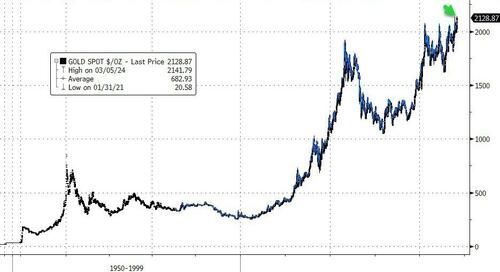
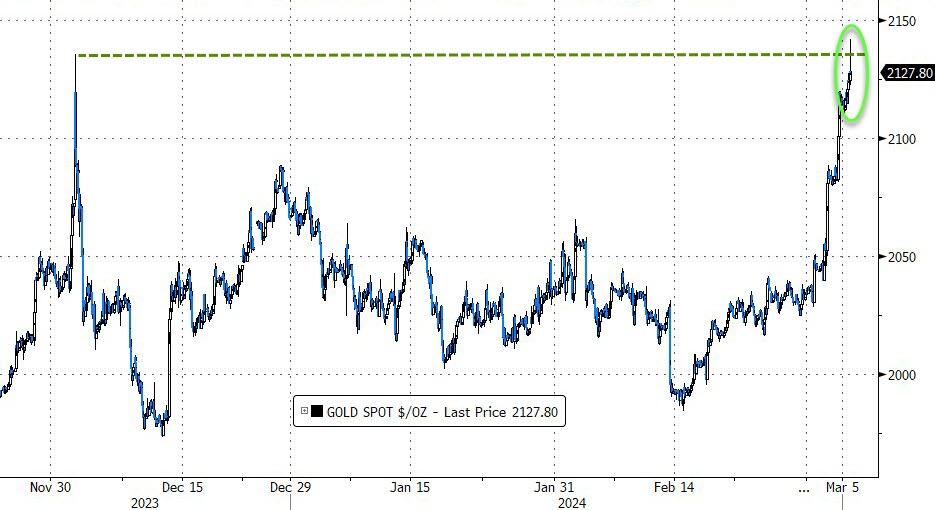
Let’s start with gold. Extending their run of the last few days, spot gold prices just exceeded their all-time highs, topping $2140 for the first time in history…
Source: Bloomberg
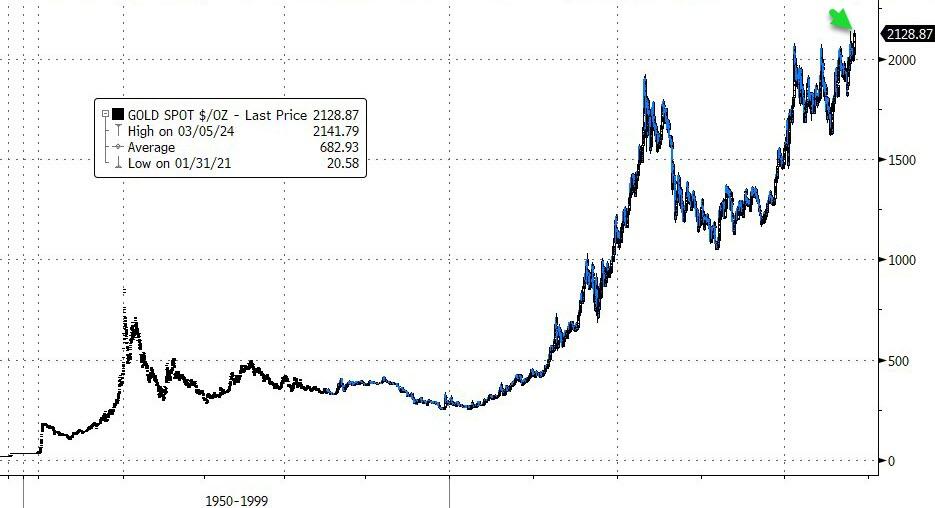
A longer view.
Source: Bloomberg
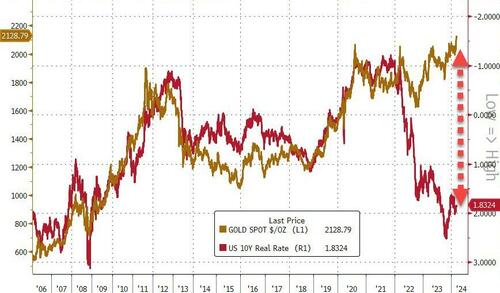
What is gold pricing in about future Fed action? Real rates dramatically negative? As Luke Gromen noted on X:
“When gold rises in your currency DESPITE positive real rates, the gold market is saying ‘Your government will have a debt spiral if real rates remain positive’.“
Source: Bloomberg
Bitcoin just hit $68,567.57, also an all-time high.
The Alt-Assets (gold, silver, Bitcoin) have counterattacked!!


You must be logged in to post a comment.