Bidenomics, which is also Yellenomics (the former Fed Chair and current Treasury Secretary) has The Good, The Bad and The Ugly to say for it.
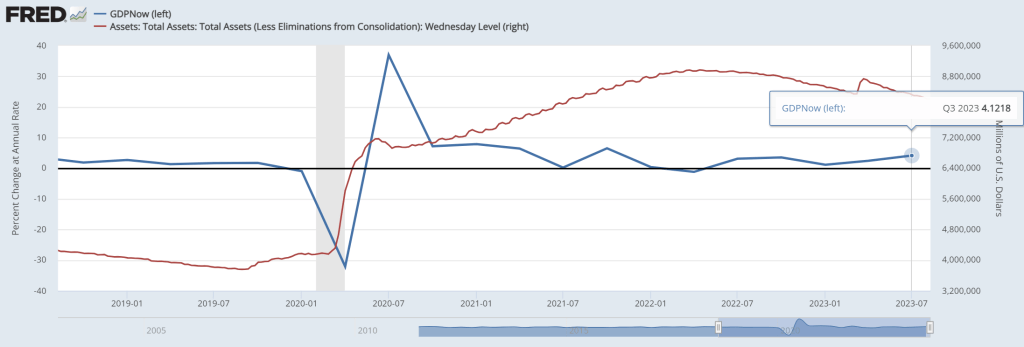
First, The Good! The Atlanta Fed’s GDP Now real time GDP tracker has Q3 GDP at … 4.12%. Pretty good, but bear in mind that there is still more than $8 trillion in Fed Monetary Stimulus outstanding (aka, Yellenomics).
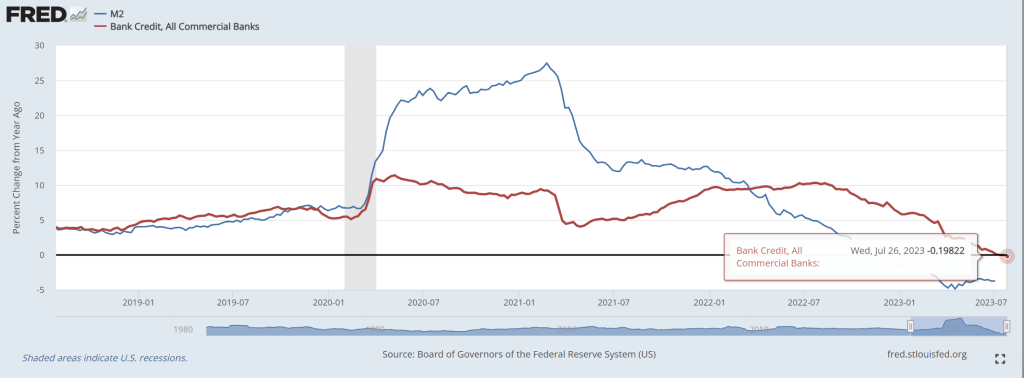
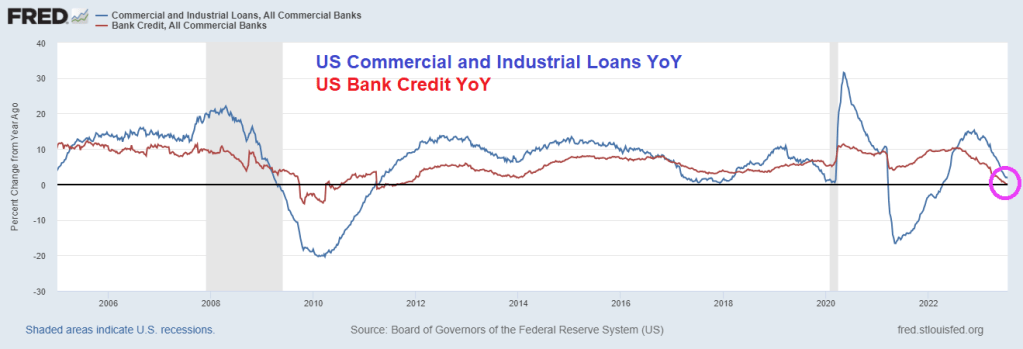
Second, The Bad. Bank credit growth is now negative.
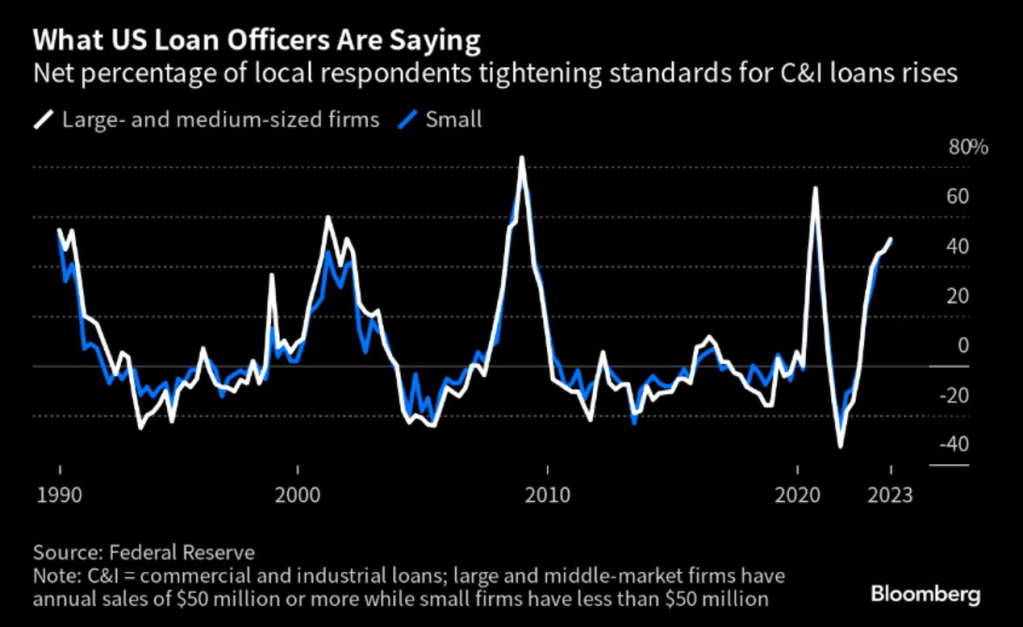
As lenders are tightening credit standards for commercial and industrial loans.
The ugly? There are several candidates for this dishonor.
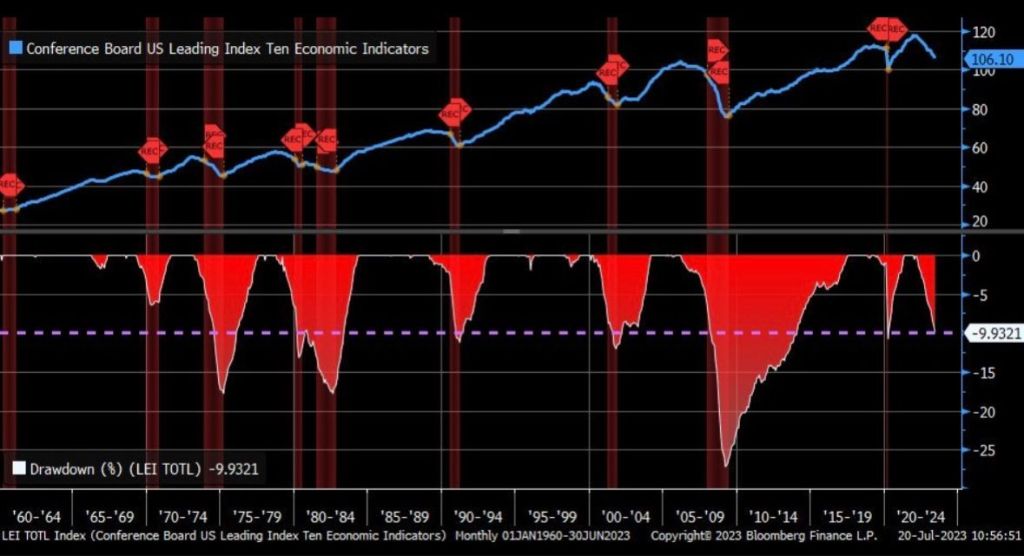
One, The Conference Board’s leading economic indicators is down -10.
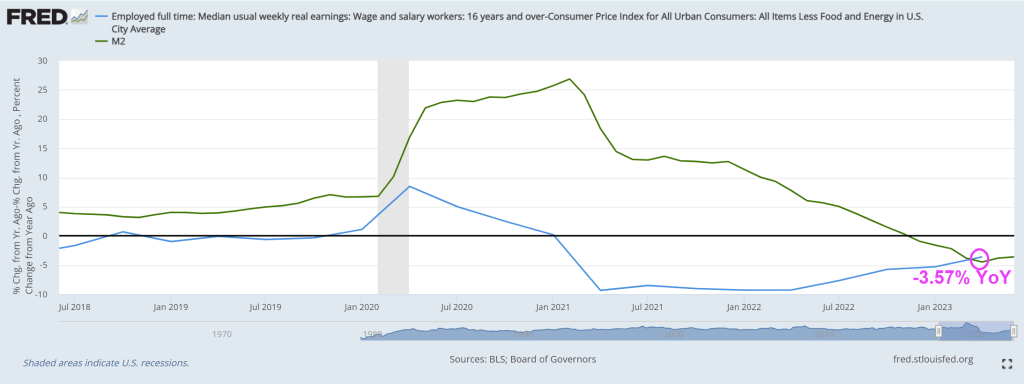
Two, REAL median weekly earnings growth remains negative at -3.57% YoY.
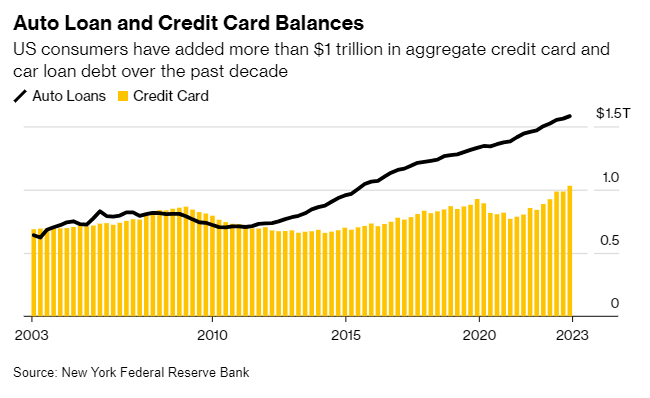
Third, auto loan and credit card balances are at $1.5 TRILLION making further consumer credit more difficult to finance GDP growth.
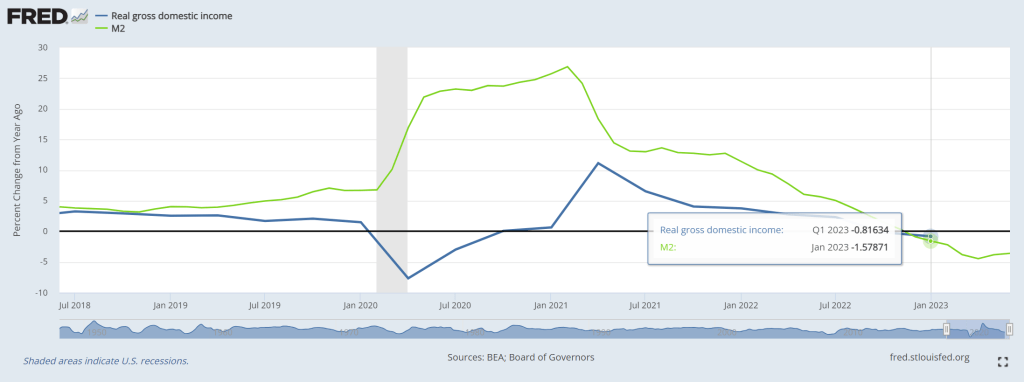
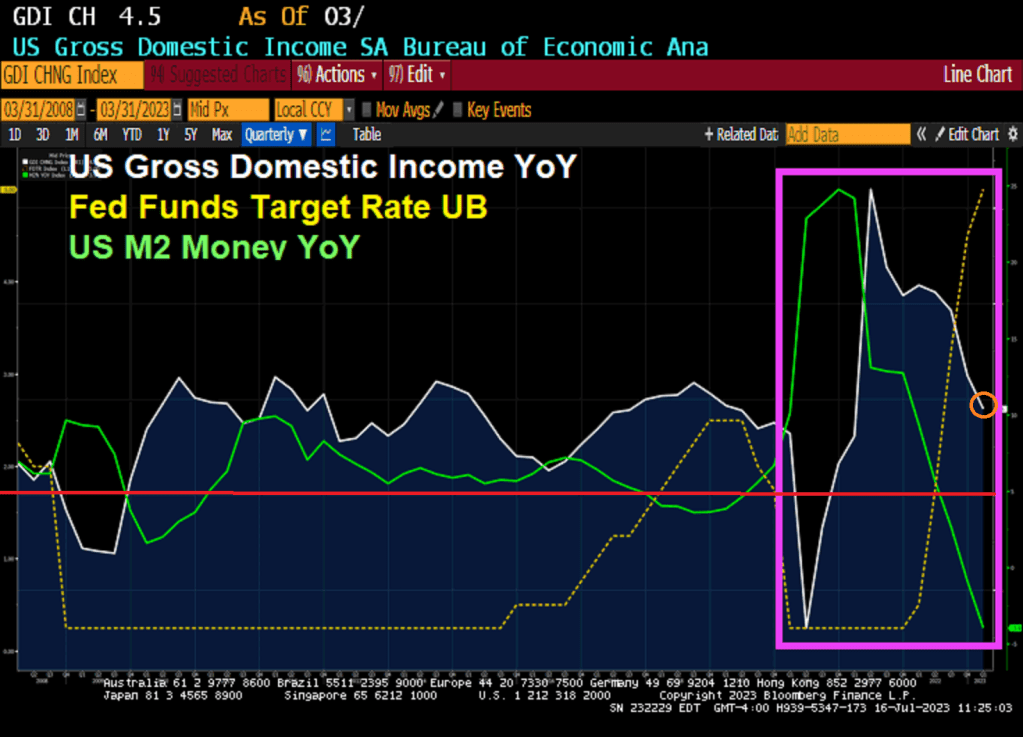
Fourth, Real Gross Domestic Income growth was negative in Q1 2023.
I could go on and on about the negatives of Bidenomics (e.g., massive distortion of Federal spending towards green energy and big donors). Isn’t the earth moving closer to the Sun in its elliptical orbit?? HOW is spending trillions on green energy work as we move closer to the Sun??
The US mortgage market is livin’ la vida Biden! And for the US mortgage market, la vida Biden in ugly.
Mortgage applications decreased 3.1 percent from one week earlier, according to data from the Mortgage Bankers Association’s (MBA) Weekly Mortgage Applications Survey for the week ending August 4, 2023.
The Market Composite Index, a measure of mortgage loan application volume, decreased 3.1 percent on a seasonally adjusted basis from one week earlier. On an unadjusted basis, the Index decreased 4 percent compared with the previous week. The Refinance Index decreased 4 percent from the previous week and was 37 percent lower than the same week one year ago. The seasonally adjusted Purchase Index decreased 3 percent from one week earlier. The unadjusted Purchase Index decreased 3 percent compared with the previous week and was27 percent lower than the same week one year ago.
Here is a chart of mortgage purchase applications with Biden’s record in the orange box.
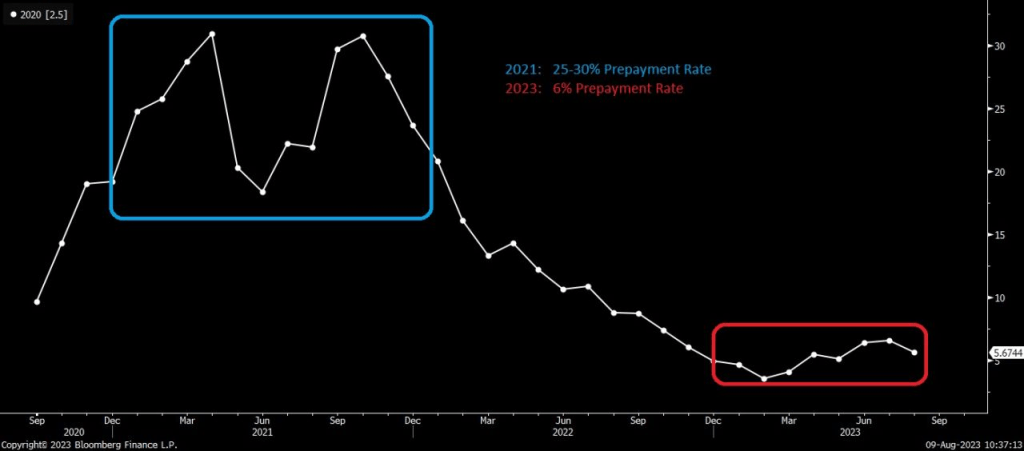
Prepayment rates with rising mortgage rates (to try to cool Bidenflation) are now low by historic standards.
Here is a photo of Joe Biden (or is that Boss Tweed of NYC’s Tammany Hall)? Doesn’t matter because they are both the same corrupt person.
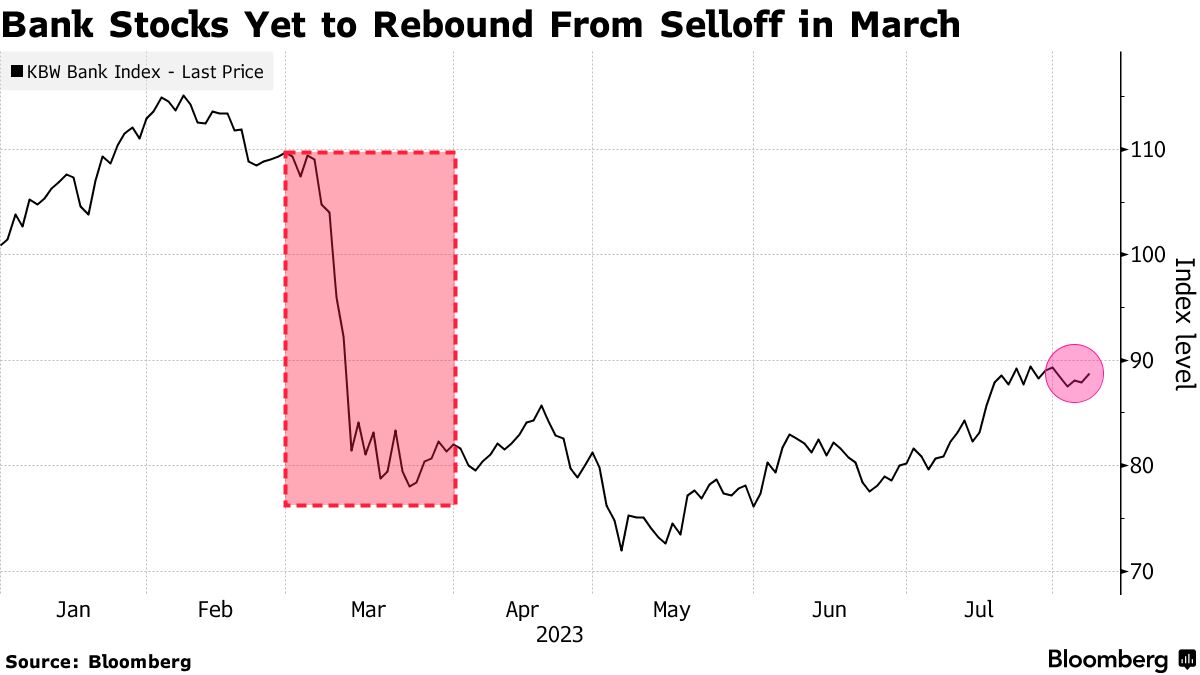
Higher funding costs, potential regulatory capital weaknesses and rising risks tied to commercial real estate are among strains prompting the review, Moody’s said late Monday.
“Collectively, these three developments have lowered the credit profile of a number of US banks, though not all banks equally,” the rating company said.
Moody’s Sees Problems Ahead for US Banks
Rating company issues raft of downgrades, outlook
Source: Moody’s
Shares declined for firms that had their ratings cut, including M&T Bank Corp., down 3.2%, and Webster Financial Corp., which lost 1.3%. Moody’s also adopted a “negative” outlook for 11 lenders, including PNC Financial Services Group, Capital One Financial Corp. and Citizens Financial Group Inc. Among those, PNC was down 2.2% and Capital One lost 2.4%.
Investors, rattled by the collapse of regional banks in California and New York this year, have been watching closely for signs of stress in the industry as rising interest rates force firms to pay more for deposits and bump up the cost of funding from alternative sources. At the same time, those higher rates are eroding the value of banks’ assets and making it harder for commercial real estate borrowers to refinance their debts, potentially weakening lenders’ balance sheets.
“Rising funding costs and declining income metrics will erode profitability, the first buffer against losses,” Moody’s wrote in a separate note explaining the moves. “Asset risk is rising, in particular for small and midsize banks with large CRE exposures.”
Some banks have curbed loan growth, which preserves capital but also slows the shift in their loan mix toward higher-yielding assets, Moody’s said.
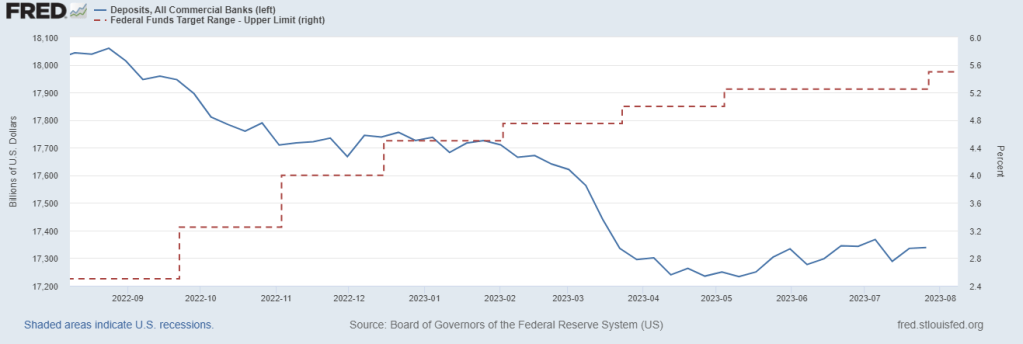
Banks that depend on more concentrated or higher levels of uninsured deposits are more exposed to these pressures, especially banks with high levels of fixed-rate securities and loans.
Deposits are declining as The Fed hikes rates.
So, Bidenomics reminds me of the film “Rollerball” where big corporations run the government and run a game akin to Rome’s gladiator fights.
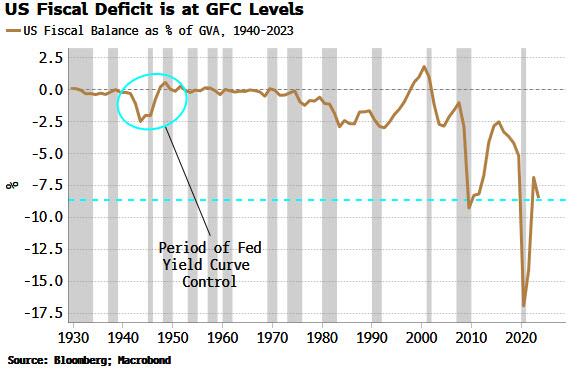
First, the deficit. It’s close to historical wides, bigger than it’s ever been outside of a recession, and almost as wide as it was in the depths of the GFC. It’s the largest in the world in GDP terms, and it is currently heading in the wrong direction. This heaps more pressure on the government debt-to-GDP level, already uncomfortably high at 112%.
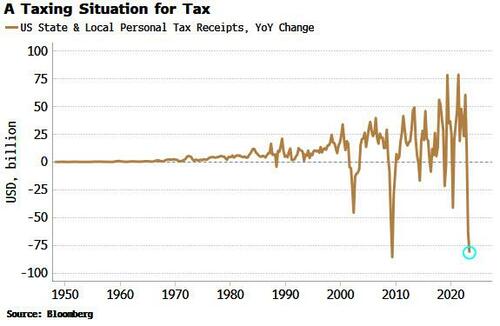
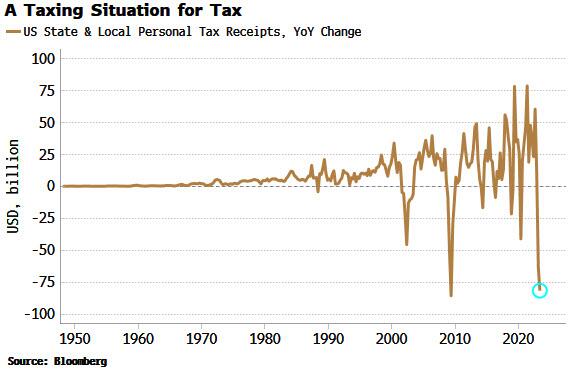
Second, tax revenues. These have seen almost their largest annual fall ever, in an economy that’s supposed to be growing at 2.4%.
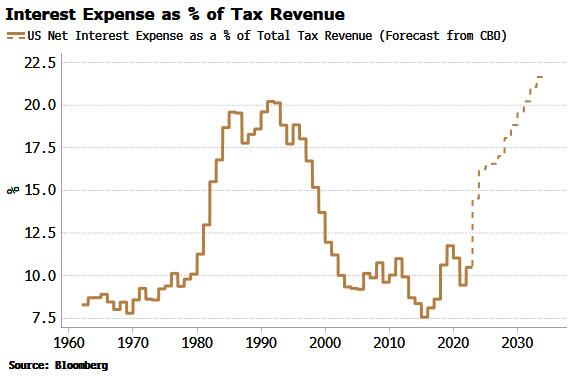
And then there’s rising interest-rate costs. The total interest expense as a percentage of tax revenue is expected to rise sharply in the next year or two, and make new highs by the end of the decade. However, these CBO forecasts should be taken with a grain of salt as they are based on a 10-year yield of only 3.8% (the ten-year average has been higher than that in every decade bar the 2010s and 2020s).
My former student at University of Chicago’s MBA program, Kevin Smith of Crescat Capital, has this charming chart of state and local income tax receipts collapsing.
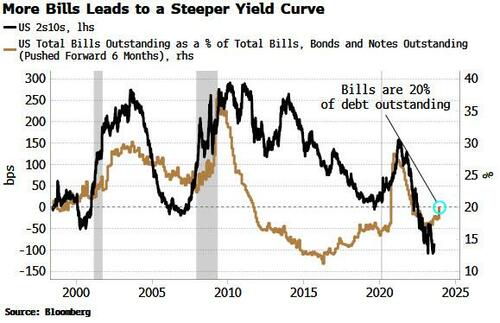
There is a view the Treasury is already implementing YCC, based on the fact it has been skewing its issuance towards bills and away from coupons. But issuing more bills is simply the easiest and fastest way for the Treasury to replenish its account at the Fed (the TGA). It was run down to almost zero in the lead-up to the debt-ceiling limit, and has now risen to over $500 billion.
This level of bill issuance is not unusual. The Treasury has an implicit target of about 20% for the amount of bills outstanding as a percentage of total debt. As we can see from the chart below, bills have often been more than 20% of debt outstanding over the last 30 years. Moreover, the Treasury announced this week it was raising its coupon-issuance amounts.
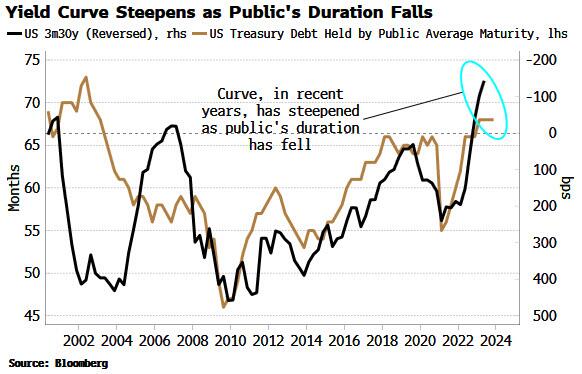
According to the stealth YCC thesis, less longer-dated Treasury issuance implicitly caps longer-term yields, but this has not historically been the case. As the chart above shows, the yield curve typically steepens – not flattens – when there is greater bill issuance – the opposite of what is desired by YCC.
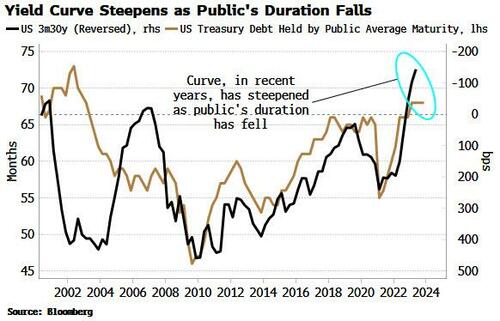
We see the same relationship if we look the duration of US government debt outstanding. When the average duration falls – as it would if issuance is skewed toward bills – the yield curve tends to steepen. The current average duration held by the public is consistent with a steeper, not a flatter, yield curve.
This sounds counter-intuitive. If issuance drives yields, then more issuance at the front-end of the curve versus the longer end – equating to a fall in duration – implies the yield curve should flatten.
But the fact the relationship is the other way implies it’s likely that demand is the more dominant driver of yields in the medium term. There is ready-made demand for bills, from MMFs, etc, so when supply increases, demand rises to meet it, suppressing the yield-curve impact.
It’s thus hard to argue the Treasury is engaging in yield curve control. But that does not detract from the rising possibility it will need to be implemented in some shape or form eventually.
Banks and the Fed are reducing their Treasury holdings, while foreigners now collectively own about $5 trillion less USTs – about 10% – than they did in 2021. At the same time the “Treasury put” means large fiscal deficits are likely to become a feature, not a bug. That means inflation is likely to become embedded.
Fiscal profligacy and elevated price growth are a combustible mix and a road to prohibitively high yields via rising term premium. Yield capping thus starts to look like the endgame.
How it’s done is another matter, whether it’s the Fed co-opted to cap yields as it was in WWII, Treasury buybacks, or financial repression, whereby domestic institutions are forced to hold more government debt. Whatever way, at some point yield curve control in the US is becoming increasingly likely – by stealth or otherwise.
But never fear! Janet “Too Low For Too Long Creating Asset Bubbles” Yellen is still US Treasury Secretary.
Bidenomics is where the Attorney General Garland gives Hunter Biden blanket amnesty and arrests Biden’s Presidential opponent. Welcome to the United Venezuelan States of America!e
But while Fitch cited “the expected fiscal deterioration over the next three years, a high and growing general government debt burden, and the erosion of governance relative to ‘AA’ and ‘AAA’ rated peers” as reasons for the downgrade, the Biden administration is of course blaming Donald Trump and his supporters due to one portion of Fitch’s explanation: “a steady deterioration in standards of governance over the last 20 years,” and that “repeated debt-limit political standoffs and last-minute resolutions have eroded confidence in fiscal management.”
Then on Wednesday, Fitch’s Richard Francis told Reuters that the downgrade was ‘due to fiscal concerns and a deterioration in U.S governance as well as polarization which was reflected in part by the Jan. 6 insurrection.’
“It was something that we highlighted because it just is a reflection of the deterioration in governance, it’s one of many,” he said, adding “You have the debt ceiling, you have Jan. 6. Clearly, if you look at polarization with both parties … the Democrats have gone further left and Republicans further right, so the middle is kind of falling apart basically.”
And so of course, the Biden administration is blaming Trump.
“This Trump downgrade is a direct result of an extreme MAGA Republican agenda defined by chaos, callousness, and recklessness that Americans continue to reject,” said Biden re-election campaign spokesman Kevin Munoz. “Donald Trump oversaw the loss of millions of American jobs, and ballooned the deficit with the disastrous tax cuts for the wealthy and big corporations.”
Ah, so now it’s the Trump downgrade™
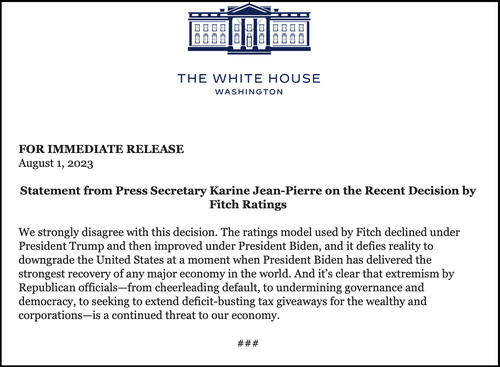
Meanwhile, White House spox Karine Jean-Pierre also blamed Trump on Tuesday, saying that the White House “strongly” disagrees with the decision, adding “it’s clear that extremism by Republican officials — from cheerleading default, to undermining governance and democracy, to seeking to extend deficit-busting tax giveaways for the wealthy and corporations — is a continued threat to our economy.”
Former Clinton Treasury Secretary Larry Summers called the decision “bizarre and inept,” while former Obama economic advisor Jason Furman called the move “completely absurd.”
On Wednesday, CNBC wheeled out Jared Bernstein, chair of Biden’s Council of Economic Advisers and former Obama official, who similarly blamed Trump.
“I think again the timing issue is is Jermaine here. The deficit went up every year under President Trump. The debt to GDP ratio rocketed under President trump. It has stabilized admittedly at a higher level under this president but we’re doing all we can to try to ameliorate those tensions,” he said.
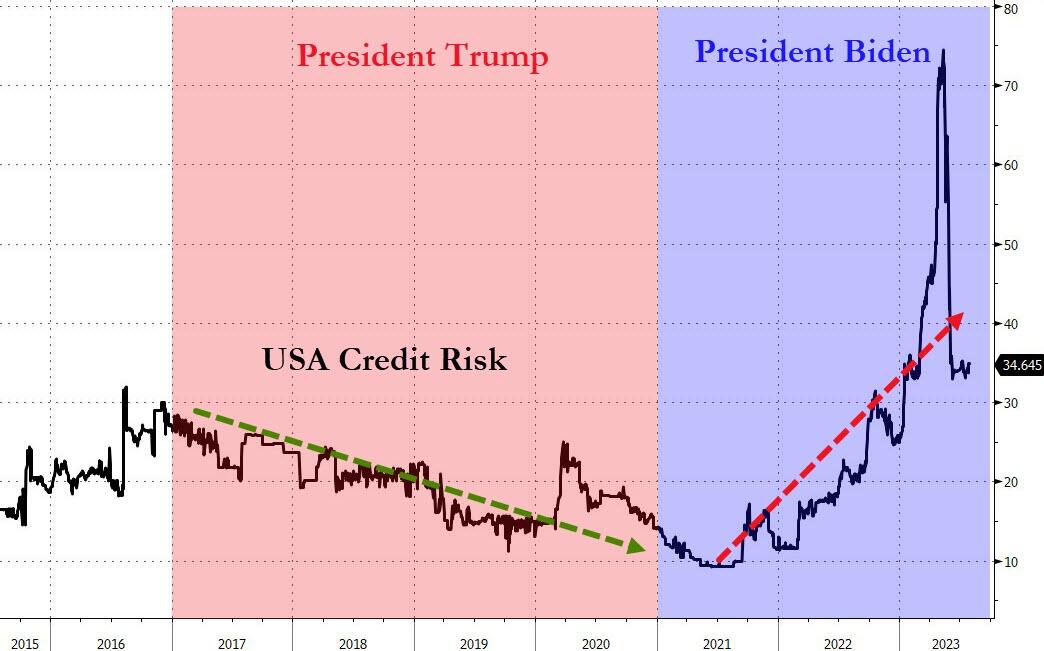
Bernstein reflected on the “cognitive dissonance” he felt at the downgrade amid the success of ‘Bidenomics’ commenting that “creditworthiness deteriorated significantly under President Trump for good reasons… and under President Biden, it started to track back up…”
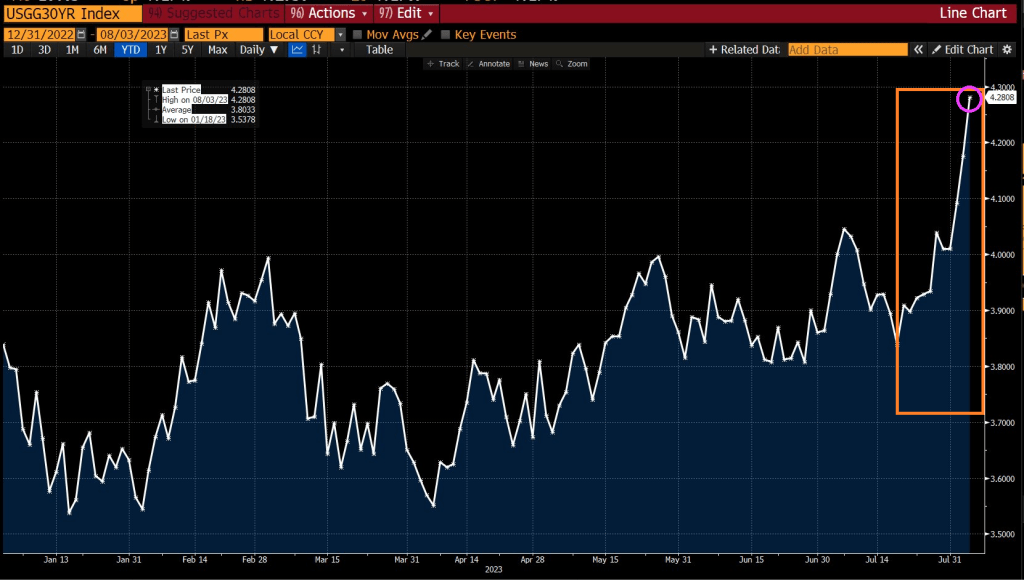
Except that’s the exact opposite of what happened. According to the 100% non-partisan “market”, the creditworthiness of US Treasury debt improved almost constantly under President Trump and worsened dramatically almost immediately upon President Biden’s inauguration:
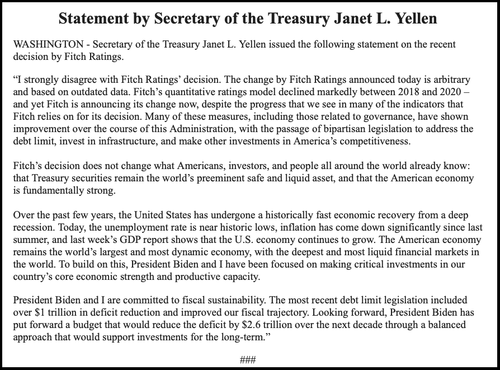
Treasury Secretary Janet Yellen said that the downgrade was “arbitrary and based on outdated data,” adding “Today, the unemployment rate is near historic lows, inflation has come down significantly since last summer, and last week’s GDP report shows that the U.S. economy continues to grow.”
CNN also blamed Trump, penning the headline: Fitch downgrades US debt on debt ceiling drama and Jan. 6 insurrection.”
The stupidity on CNN and Jared Bernstein are appalling. True, the media and Biden Administration are terrified of losing the 2024 Presidential election, but outright lies and misrepresenation are wrong no matter what.
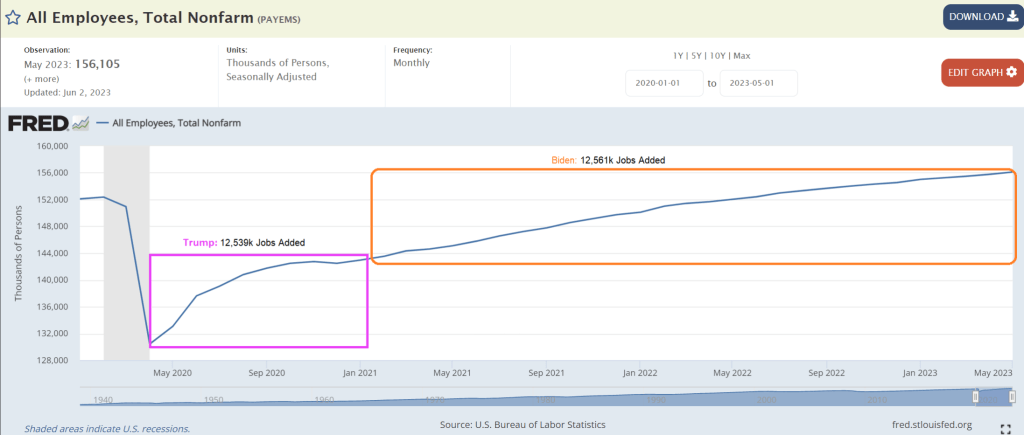
But the claims that the US was downgraded because Trump’s economy lost miilions of jobs is ridiculous.
Actually, the US economy added 12.53 million jobs after April 2020 (Trump) while Bidenomics created took 2 1/2 years to add 12.56 million jobs. So, Biden took over twice as long to create jobs after Covid than it did under Trump. Simply opening the economy and schools produced that magical claim by Biden. And the National Teacher’s Union and Randi Weingarten worked with Fauci to orchestrate shutting down schools. Blaming Trump for local governments shutting down the economy is pure bunk.
Bidenomics and massive Federal spending is the cause for the downgrade. Not Trump.
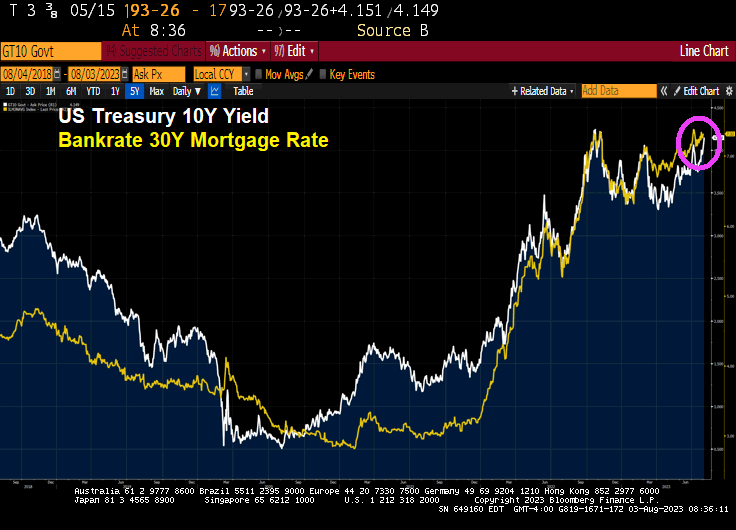
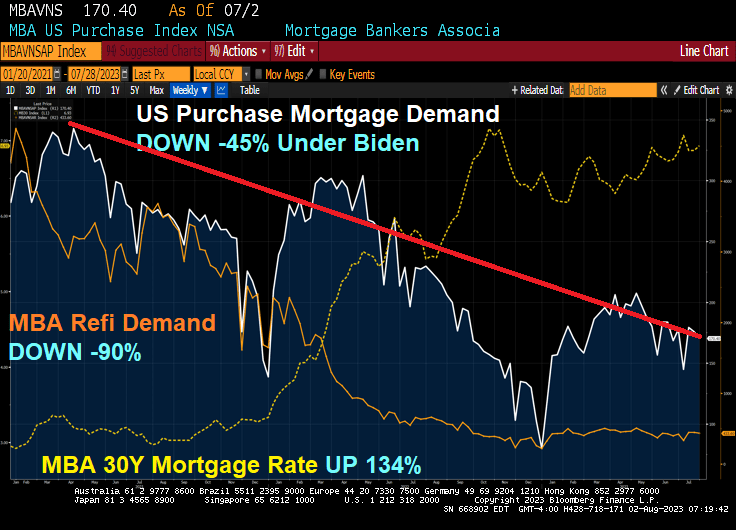
Inflation under Biden has been very painful for the US middle class and low wage workers. That inflation has resulted to surging mortgage rates thanks to The Fed’s counterattack.
The result? Mortgage rates are up 134% under Bidenomics, while mortgage purchase demand is down -45% since Biden was selected. And mortgage refinancing demand is down a staggering -90%!
Mortgage applications decreased 3.0 percent from one week earlier, according to data from the Mortgage Bankers Association’s (MBA) Weekly Mortgage Applications Survey for the week ending July 28, 2023.
The Market Composite Index, a measure of mortgage loan application volume, decreased 3.0 percent on a seasonally adjusted basis from one week earlier. On an unadjusted basis, the Index decreased 3 percent compared with the previous week. The Refinance Index decreased 3 percent from the previous week and was 32 percent lower than the same week one year ago. The seasonally adjusted Purchase Index decreased 3 percent from one week earlier. The unadjusted Purchase Index decreased 3 percent compared with the previous week and was 26 percent lower than the same week one year ago.
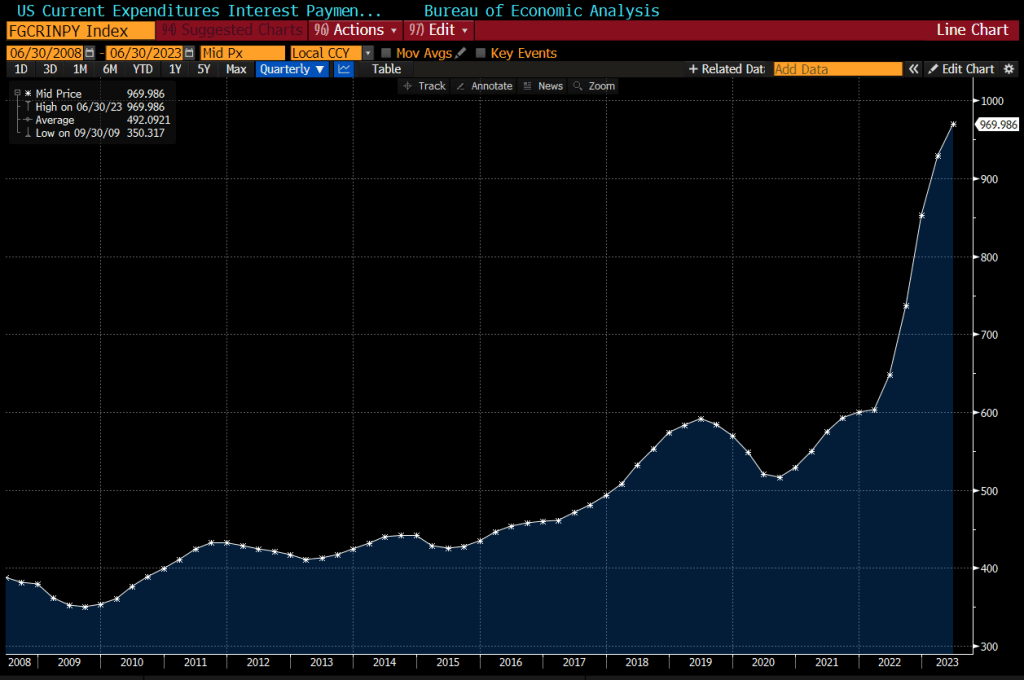
US interest expenses have surged by about 50% in the past year, to nearly $1 trillion on an annualized basis.
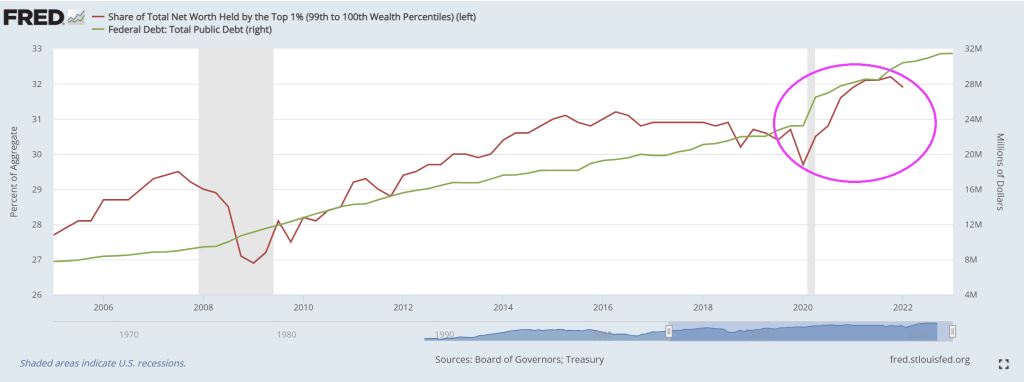
Look at the share of net worth by the top 1% as Treasury borrows more money.
Oddly, Biden is not talking about about putting US government policies up for sale to the highest bidders. But don’t worry. Biden is the King of Corruption in the District of Corruption (Washington DC).
Bidenomics, aka the Federal government takeover of the US economy with Soviet-style economic central planning, is highly dependent on loose Federal Reserve monetary policy (Janet Yellen and Powell’s wild overreaction to the massively inappropriate Covid shutdowns),
So, how is Bidenomics working out? On the bank lending front, commercial and industrial (C&I) lending growth is crashing along with bank credit growth YoY.
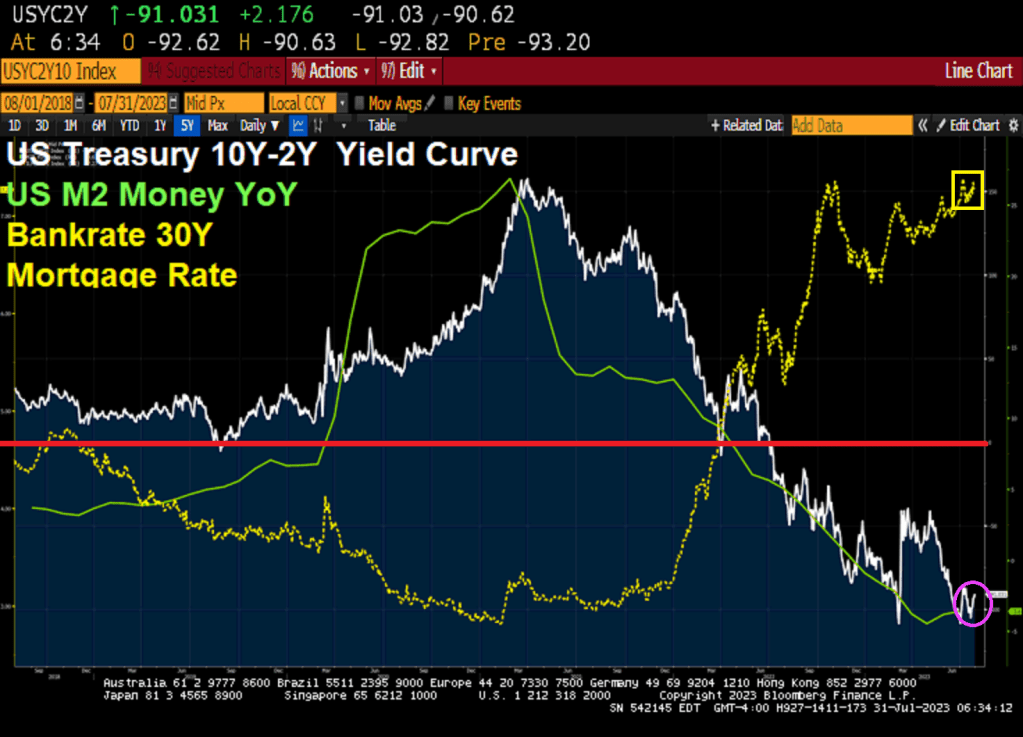
The US Treasury 10Y-2Y yield curve remains deeply inverted at -91.031 basis points and M2 Money growth has crashed. The 30 year mortgage rate is hovering around 7.27%.
Biden Press Secretary KARINE JEAN-PIERRE: “The American people are beginning to feel Bidenomics”
Prices are up 16.6% and real wages are down 3% since Biden took office.
Well, at least Jean-Pierre didn’t claim like her boss Joe Biden claimed that he “ended cancer as we know it.”
But getting back to Jean-Pierre’s claim that “The American people are beginning to feel Bidenomics.” She is right (for once). Americans are REALLY feeling Bidenomics. And it hurts SO BAD!!!
What hurts so bad? Food (CRB Foodstuffs) are up 56% under Bidenomics. Real weekly wage growth is down -90% since Biden assumed office. Regular gas prices are up 52%. And the 30Y mortgage rate is up a staggering 153%. Yes, Karine, this hurts so bad!
While real wages are down -3% under Biden and the real average weekly wage growth is down -90%. That REALLY hurts so good.
US office space vacancies (white line) have soared since 2008 as The Fed’s massive monetary expansion (blue and green line) has not helped. But Fed monetary expansion DID help drive office prices! At least until 2022, when office space values began to fall. Notice that office values are falling as The Fed withdraws monetary stimulus.
During the regional bank failures in March, we directed our readership to focus on the next potential crisis: “CRE Nuke Goes Off With Small Banks Accounting For 70% Of Commercial Real Estate Loans.”By late March, Morgan Stanley warned clients of an upcoming maturity wall in commercial real estate, which amounts to $500 billion of loans in 2024, and a total of $2.5 trillion in debt that comes due over the next five years.
In a recent Bloomberg interview, Barry Sternlicht’s Starwood Capital Group warned that the CRE space is in a “Category 5 hurricane.” He said, “It’s sort of a blackout hovering over the entire industry until we get some relief or some understanding of what the Fed’s going to do over the longer term.”
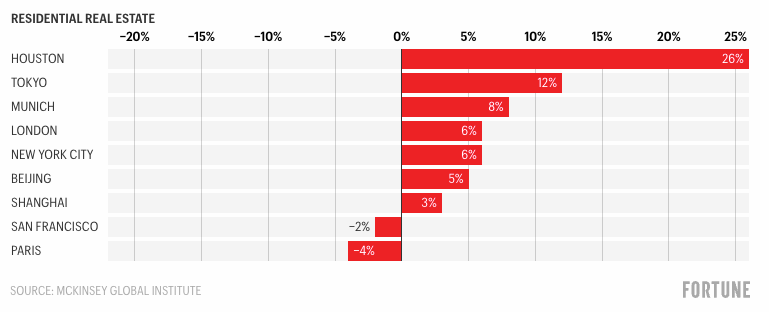
The current downturn in CRE could persist for years, if not through the end of this decade. Jan Mischke, a partner at the McKinsey Global Institute, along with Olivia White, a senior partner at McKinsey, and Aditya Sanghvi, a senior partner and leader of McKinsey’s real estate special initiative, published a note in Fortune, warning “$800 billion of office space in just nine cities could become obsolete by 2030.”
The authors of the report blame the CRE downturn on the “shift to remote and hybrid work prompted two further shifts in people’s behavior”:
First, many residents, untethered from their offices and therefore less fearful of long commutes, moved away from urban cores. New York City’s urban core (that is, the dozen densest counties in the metropolitan area) lost 5% of its population from mid-2020 to mid-2022. San Francisco’s urban core (San Francisco County, Alameda County, and San Mateo County) lost 6%.
Second, consumers began shopping less at brick-and-mortar stores–and far less at stores in urban cores, where people were now less likely either to work or to live. Foot traffic near stores in metropolitan areas remains 10 to 20% below pre-pandemic levels, but the differences between urban and suburban traffic recovery are substantial. For example, in late 2022, foot traffic near New York’s suburban stores was 16% lower than it had been in January 2020, while foot traffic near stores in the urban core was 36% lower.
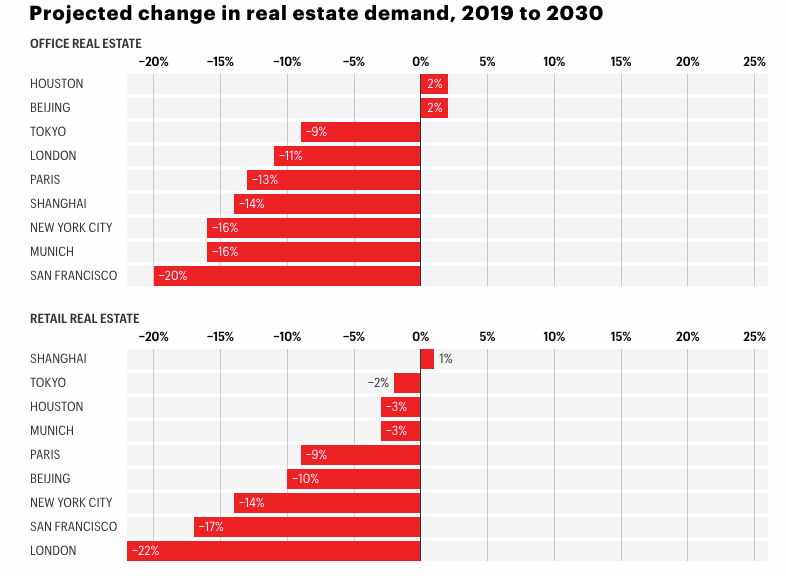
As fewer employees work in the office, demand for office space will fall. By 2030, such demand will be as much as 20% lower, depending on the city–even in a moderate scenario in which office attendance goes up but remains lower than it was before the pandemic.
And as fewer consumers shop at brick-and-mortar stores, demand for retail space will fall as well, according to our model. In the urban core of London, the hardest-hit city, demand for retail space will be 22% lower in 2030 than it was in 2019 in a moderate scenario.
Some of the most significant declines in office and retail space demand through 2030 will be in major US cities such as San Francisco and New York City.
The authors note that the demand for “residential space will suffer less”… Well, according to their forecasting model.
“The reduced demand will have major impacts on urban stakeholders. For example, in just nine cities that we studied especially closely, $800 billion of office space could become obsolete by 2030. And macroeconomic complications could make matters even worse,” the authors continued. Without office workers in downtown areas, economic recoveries in major cities will be a “U” shape or, in some cases, an “L.”
The unraveling of downtowns is already underway. We shared a video this week of scenes of San Francisco’s downtown transformed into a ‘ghost town.’ Building owners in the crime-ridden metro area are already giving up and defaulting as vacancies rise, crime surges, and refinancing is near impossible in today’s climate as the Federal Reserve keeps interest rates sky-high to tame the worst inflation in a generation.
We shift our attention to Baltimore City, where office towers are being dumped in an apparent firesale.
The authors failed to report that the sliding demand for office towers isn’t just because of “remote and hybrid work” but also due to an exodus of companies fleeing crime-ridden progressive cities that fail to enforce law and order.
If McKinsey’s predictions are correct, certain segments of the CRE market are expected to experience prolonged turmoil for years. Some US mayors have proposed an immediate solution to convert office towers into multi-family units. However, this transformation could take years due to the time-consuming processes of obtaining permits and construction.
Yes, the maestros of real estate asset bubbles (Yellen) and eventual deflation (Powell)!


You must be logged in to post a comment.