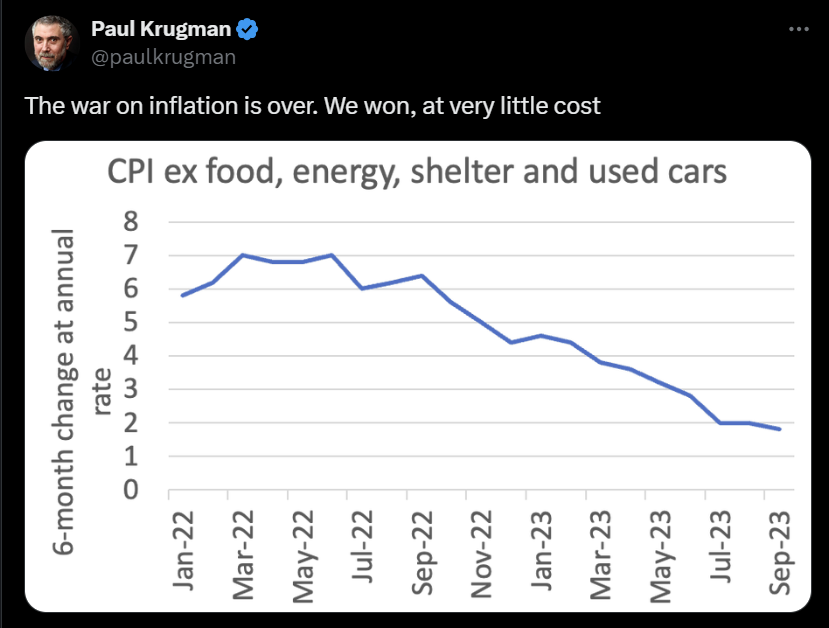
Back in 2023, Socialist Paul Krugman declared that “the war on inflation is over!!! “We” won, at very little cost.” I love when elitists claim “We won!” since clearly 99% of Americans lost since food, housing and car prices up are double digits under Biden.
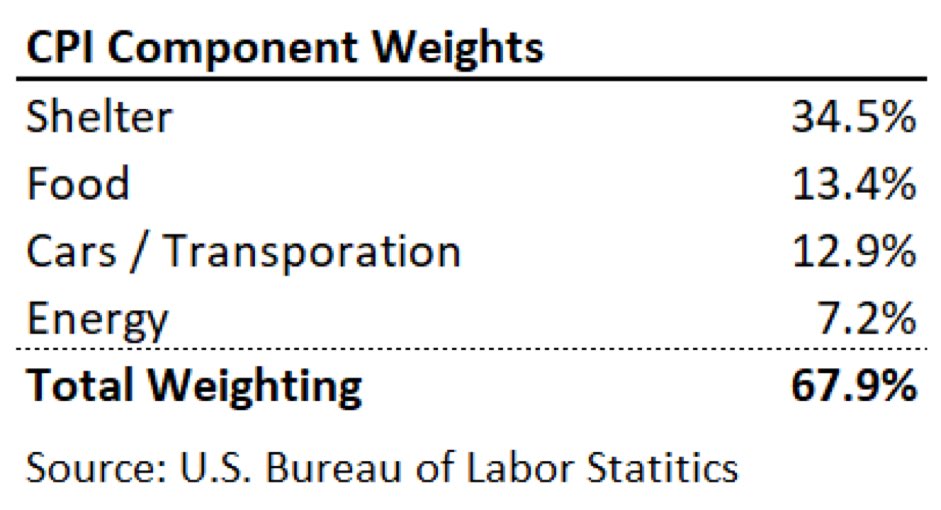
The problem is that food, energy, shelter, and used cars/trucks are a huge part of Americans consumption basket.
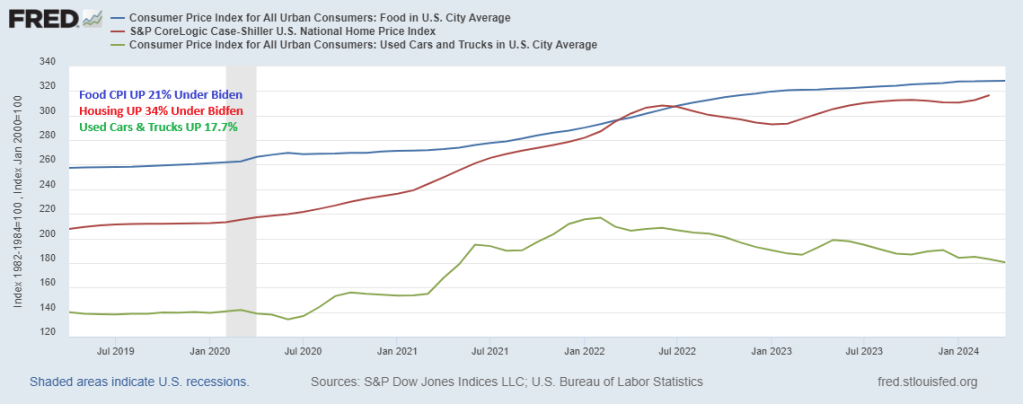
Under Biden, food CPI is up 23%. Home prices are up 34% and used cars/truck prices are up 17.7%.
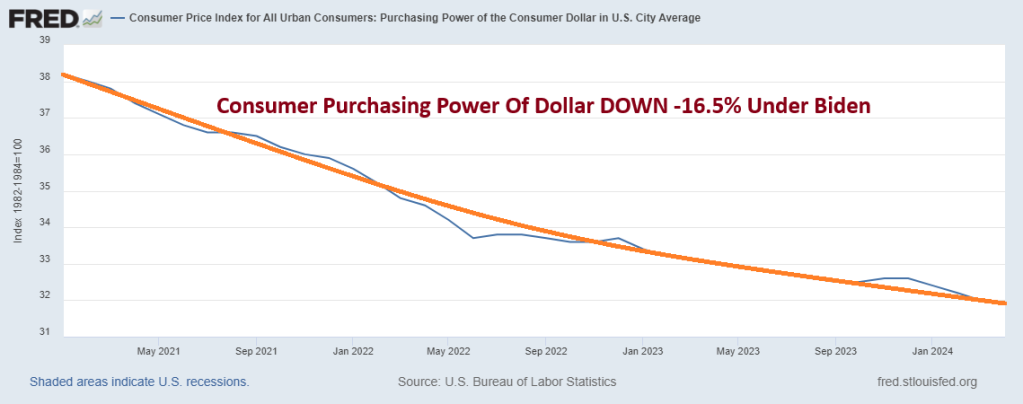
A note to Paul Krugman, YOU may have won, but the rest of Americans lost. Consumer purchasing power of the US Dollar is DOWN 16.5% Under Biden.
What I like about Biden’s economy … nothing. Most of Biden’s economic growth came from Trump’s spending and Fed monetary policy from the Covid shutdown of 2020.
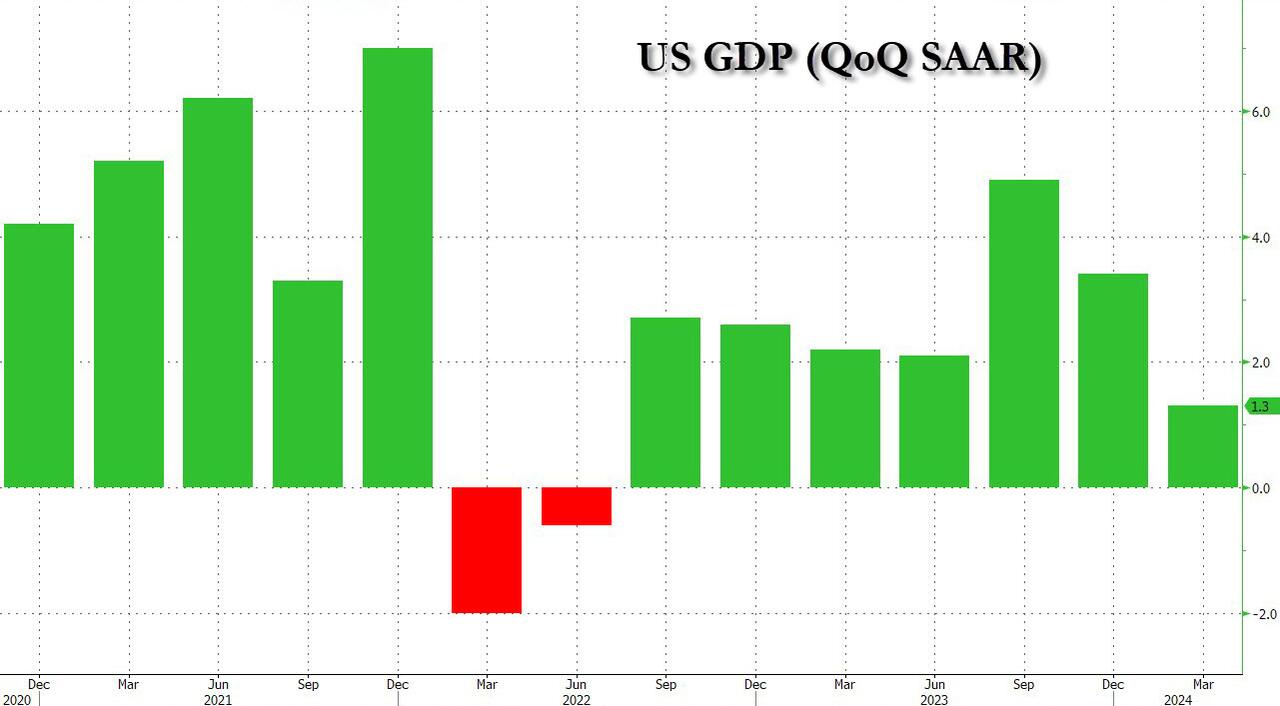
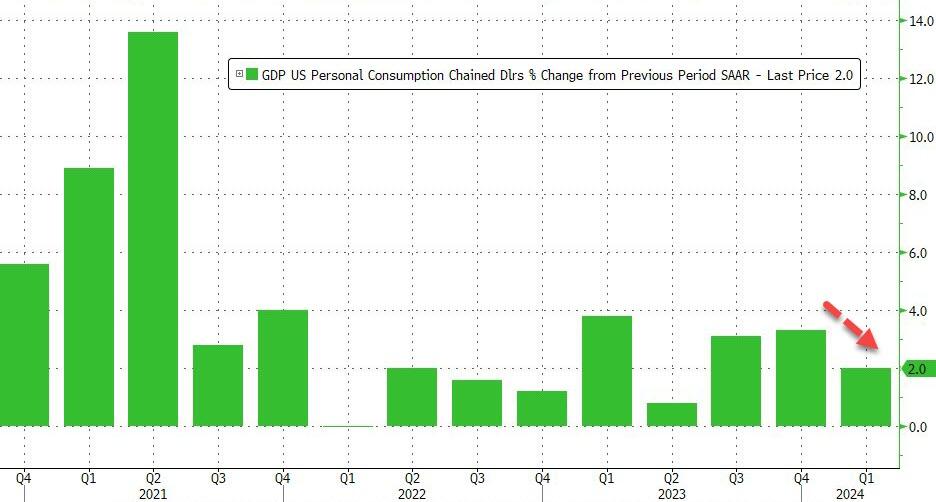
The sharp downward revision primarily reflected a downward revision to consumer spending, which rose 2.0% annualized, down from 2.5% in the first GDP report and below the 2.2% estimate.
Drilling down into the number, the 1.3% increase reflected increases in consumer spending (below previous forecasts) and housing investment that were partly offset by a decrease in inventory investment. Imports, which are a subtraction in the calculation of GDP, increased.
The increase in consumer spending reflected an increase in services that was partly offset by a decrease in goods. Within services, the leading contributors to the increase were health care as well as financial services and insurance. Within goods, the leading contributors to the decrease were motor vehicles and parts as well as gasoline and other energy goods.
The increase in housing investment was led by brokers’ commissions and other ownership transfer costs as well as new single-family housing construction.
The decrease in inventory investment was led by decreases in wholesale trade and manufacturing
In terms of bottom-line contributions, we find the following:
Personal consumption accounted for 1.34% (down from 1.68%), or more than the entire GDP print.
Fixed Investment added 1.02%, up from 0.91% in the first estimate.
The change in private inventories subtracted -0.45%, a deterioration from the -0.35% estimated previously.
Net trade (exports less imports), subtracted -0.89% from the bottom line print, comparable to the -0.86% detraction in the first estimate.
Finally, government added just 0.23%, up from 0.21% initially estimated, yet still the lowest contribution since Q2 2022.
The US is on a “Highway to Hell!” thanks to flawed economic policies under Biden.
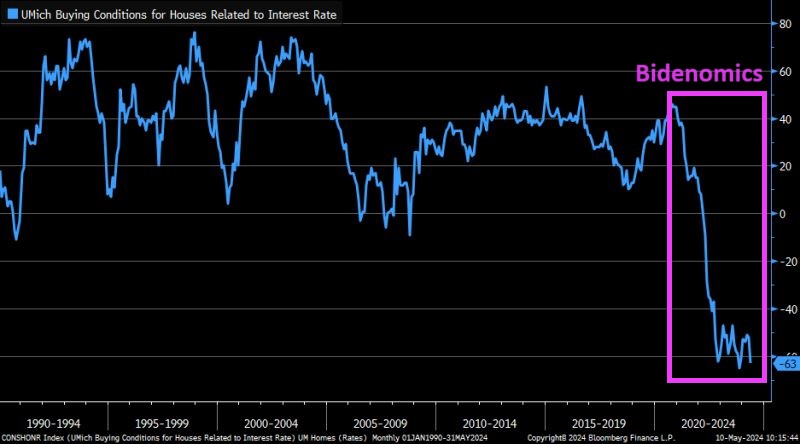
First, interest and mortgage rates under Biden have soared driving buying conditions for housing to all-time lows. Combine sky-high home prices with high mortgage rates and we have as serious affordability crisis.
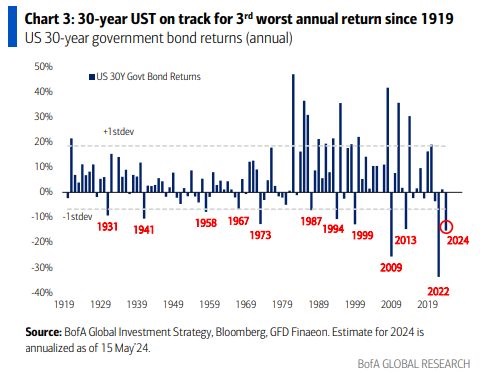
Second, on the interest rate front, the 30-year Treasury bond is on track for the 3rd worst annual return since 1919 and Russia’s invasion of Ukraine. Not not the current invasion, but the 1919 invasion.
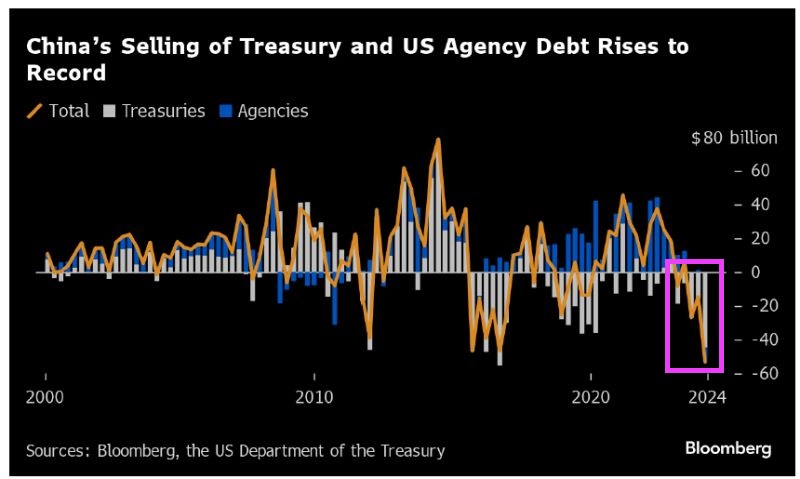
Third, China is dumping their holdings of US Treasuries and Agency Debt at record rates.
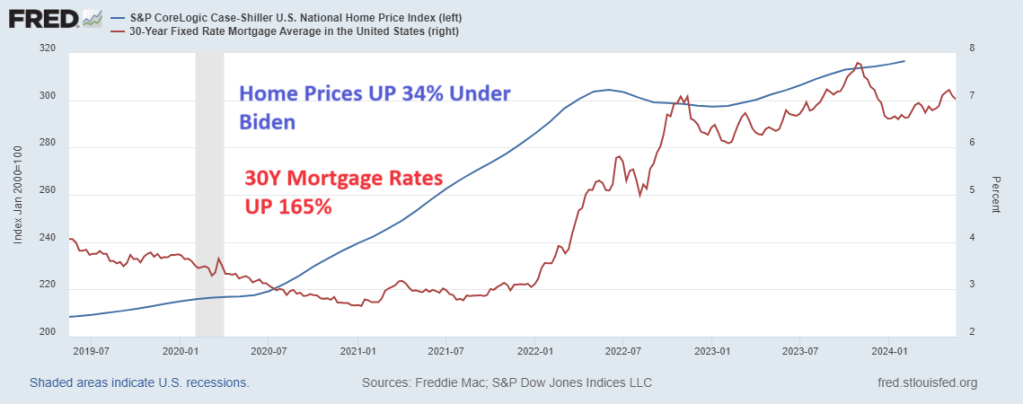
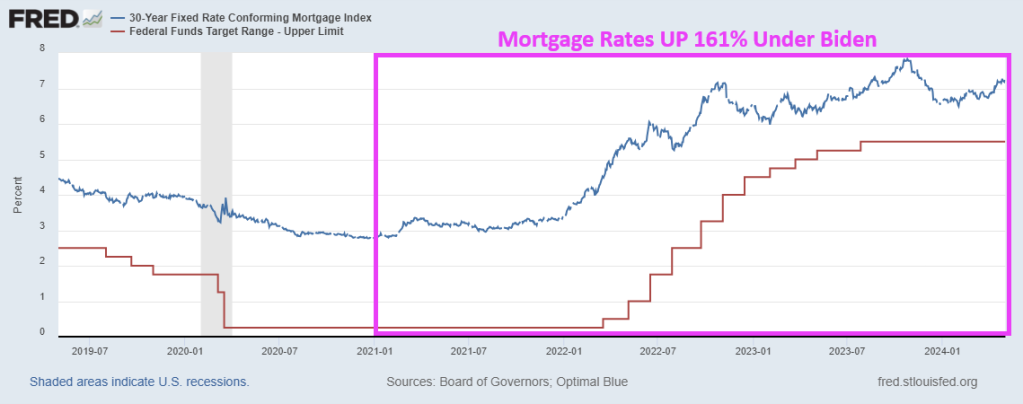
Of course, mortgage rates hit 18% in 1981. So, the term high mortgage rates is relative. The US had low rates for too long (Bernanke/Yellen) and mortgage rates are now in the 7% range, up 165% under Biden. And home prices are up 34% since Biden was sworn-in as President. Wow! Mortgage rates up 165% and home prices up 34% under Biden’s Reign of Error.
Perhaps Fed Chair Jerome Powell was listening to Prince’s “Let’s Go Crazy!” Because The Fed went crazy with money printing to counteract the shutdown of the US economy in 2020.
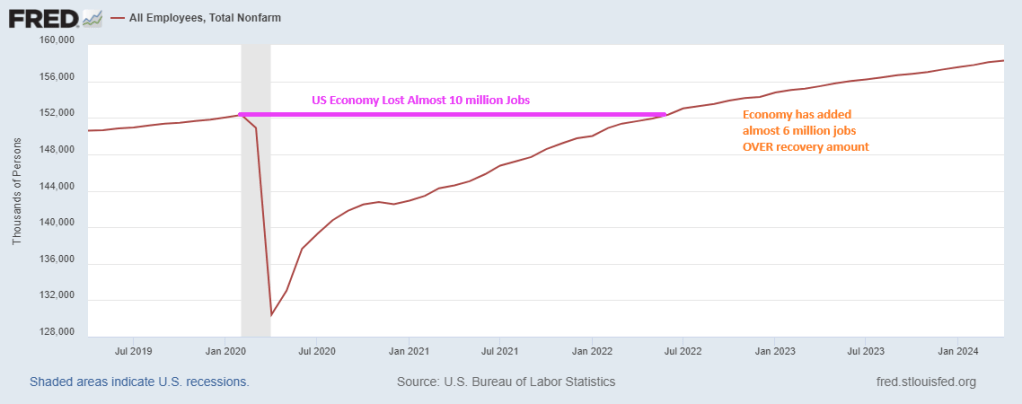
The US jobs market peaked in February 2020 under Trump at 152,309,000. Then COVID struck in March 2020 and the US economy lost almost 10 million jobs by December 2020. But when the fear ebbed and the economy opened back up, it took until June 2022 to recover the lost jobs. But since June 2022, the US economy has added almost 6 million jobs (many are part-time jobs and taken by foreign-born workers).
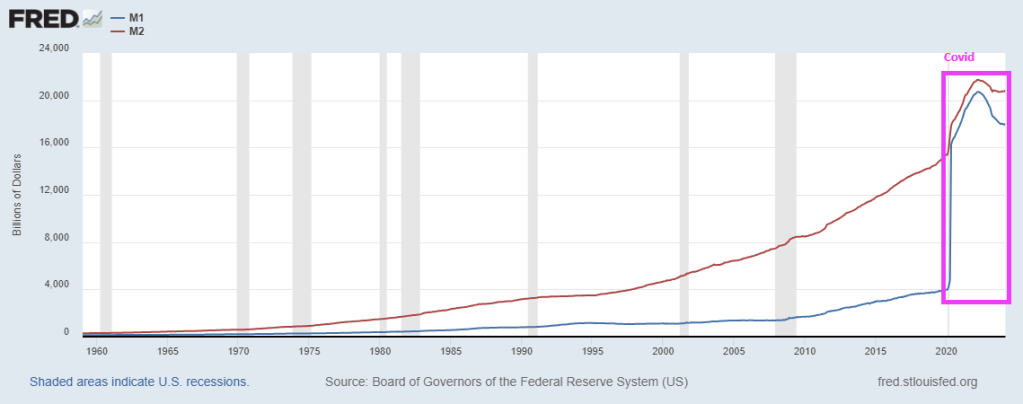
In terms of money printing, The Fed went crazy printing.
In fact, M1 Money year-over-year (YoY) rose a staggering 360% in February 2021. M2 Money, a broader measure of money, grew at a rate of 26.75% YoY in February 2021. Remember, Biden was sworn in as President in January 2021.
Yes, Biden’s purported jobs miracle is actually a part-time jobs recovery. Good luck buying a home on a part-time job.
Despite the staggering increase in money printing, TreasSec Yellen and Jared Bernstein still can’t explain why inflation isn’t transitory.
We are talking about the nation’s unhinged monetary politburo domiciled in the Eccles Building (The Federal Reserve), of course. It is bad enough that their relentless inflation of financial assets has showered the 1% with untold trillions of windfall gains, but their ultimate crime is that they lured the nation’s elected politician into a veritable fiscal trance. Consequently, future generations will be lugging the service costs on insuperable public debts for years to come.
For more than two decades these foolish PhDs and monetary apparatchiks drove the entire Treasury yield curve to rock bottom, even as public debt erupted skyward. In this context, the single biggest chunk of the Treasury debt lies in the 90-day T-bill sector, but between December 2007 and June 2023 the inflation-adjusted yield on this workhorse debt security was negative 95% of the time.
That’s right. During that 187-month span, the interest rate exceeded the running (LTM) inflation rate during only nine months, as depicted by the purple area picking above the zero bound in the chart, and even then by just a tad. All the rest of the time, Uncle Sam was happily taxing the inflationary rise in nominal incomes, even as his debt service payments were dramatically lagging the 78% rise of CPI during that period.
Inflation-Adjusted Yield On 90-Day T-bills, 2007 to 2022
The above was the fiscal equivalent of Novocain. It enabled the elected politicians to merrily jig up and down Pennsylvania Avenue and stroll the K-Street corridors dispensing bountiful goodies left and right, while experiencing nary a moment of pain from the massive debt burden they were piling on the main street economy.
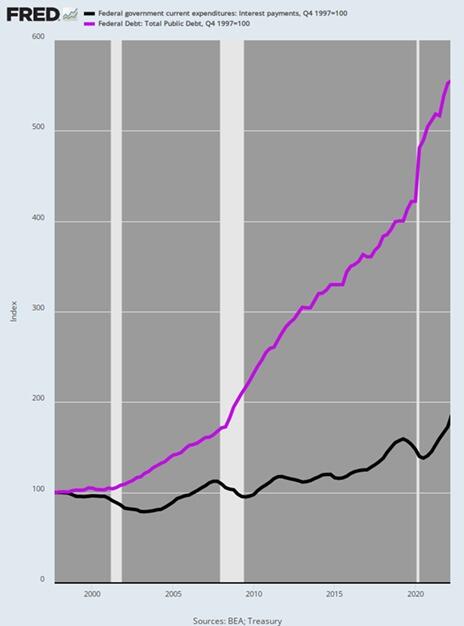
Accordingly, during the quarter-century between Q4 1997 and Q1 2022 the public debt soared from $5.5 trillion to $30.4 trillion or by 453%. In any rational world a commensurate rise in Federal interest expense would have surely awakened at least some of the revilers.
But not in Fed World. As it happened, Uncle Sam’s interest expense only increased by 73%, rising from $368 billion to $635 billion per year during the same period. By contrast, had interest rates remained at the not unreasonable levels posted in late 1997, the interest expense level by Q1 2022, when the Fed finally awakened to the inflationary monster it had fostered, would have been $2.03 trillion per annum.
In short, the Fed reckless and relentless repression of interest rates during that quarter century fostered an elephant in the room that was one for the ages. Annualized Federal interest expense was fully $1.3 trillion lower than would have been the case at the yield curve in place in Q4 1997.
Alas, the missing interest expense amounted to the equivalent of the entire social security budget!
So, we’d guess the politicians might have been aroused from their slumber had interest expense reflected market rates. Instead, they were actually getting dreadfully wrong price signals and the present fiscal catastrophe is the consequence.
Index Of Public Debt Versus Federal Interest Expense, Q4 1997-Q1 2022
Needless to say, the US economy was not wallowing in failure or under-performance at the rates which prevailed in 1997. In fact, during that year real GDP growth was +4.5%, inflation posted at just 1.7%, real median family income rose by 3.2%, job growth was 2.8% and the real interest rates on the 10-year UST was +4.0%
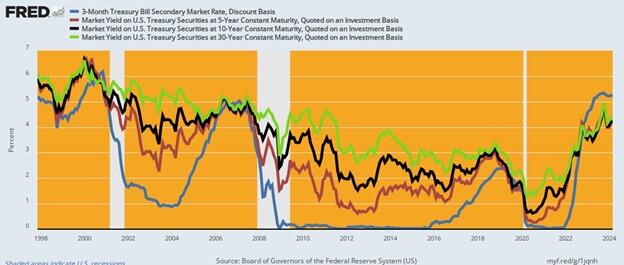
In short, 1997 generated one of the strongest macroeconomic performances in recent decades—even with inflation-adjusted yields on the 10-year UST of +4.0%. So there was no compelling reason for a massive compression of interest rates, but that is exactly what the Fed engineered over the next two decades. As shown in the graph below, rates were systematically pushed lower by 300 to 500 basis points across the curve by the bottom in 2020-2021.
Current yields are higher by 300 to 400 basis points from this recent bottom, but here’s the thing: They are only back to nominal levels prevalent at the beginning of the period in 1997, even as inflation is running at 3-4% Y/Y increases, or double the levels of 1997.
US Treasury Yields, 1997 to 2024
Unfortunately, even as the Fed has tepidly moved toward normalization of yields as shown in the graph above, Wall Street is bringing unrelenting pressure for a new round of rates cuts, which would result in yet another spree of the deep interest rate repression and distortion that has fueled Washington’s fiscal binge since the turn of the century.
As it is, the public debt is already growing at an accelerating clip, even before the US economy succumbs to the recession that is now gathering force. And we do mean accelerating. The public debt has recently been increasing by $1 trillion every 100 days. That’s $10 billion per day, $416 million per hour.
In fact, Uncle Sam’s debt has risen by $470 billion in the first two months of this year to $34.5 trillion and is on pace to surpass $35 trillion in a little over a month, $37 trillion well before year’s end, and $40 trillion some time in 2025. That’s about two years ahead of the current CBO (Congressional Budget Office) forecast.
On the current path, moreover, the public debt will reach $60 trillion by the end of the 10-year budget window. But even that depends upon the CBO’s latest iteration of Rosy Scenario, which envisions no recession ever again, just 2% inflation as far as the eye can see and real interest rates of barely 1%. And that’s to say nothing of the trillions in phony spending cuts and out-year tax increases that are built into the CBO baseline but which Congress will never actually allow to materialize.
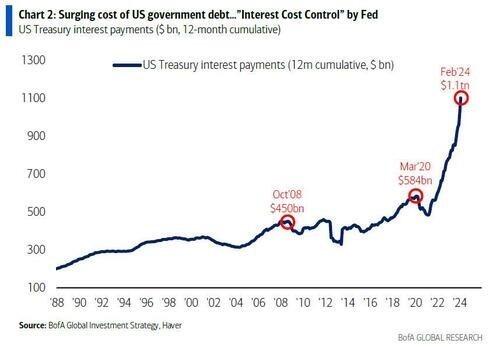
What is worse, even with partial normalization of rates, a veritable tsunami of Federal interest expense is now gathering steam. That is because the ultra-low yields of 2007 to 2022 are now rolling over into the current market rates shown above—at the same time that the amount of public debt outstanding is heading skyward. As a result, the annualized run rate of Federal interest expense hit $1.1 trillion in February and is heading for $1.6 trillion by the end of the current fiscal year in September.
Finally, even as the run-rate of interest expense has been soaring, the bureaucrats at the US Treasury have been drastically shortening the maturity of the outstanding debt, as it rolls over. Accordingly, more than $21 trillion of Treasury paper has been refinanced in the under one-year T-bill market, thereby lowering the weighted-average maturity of the public debt to less than five- years.
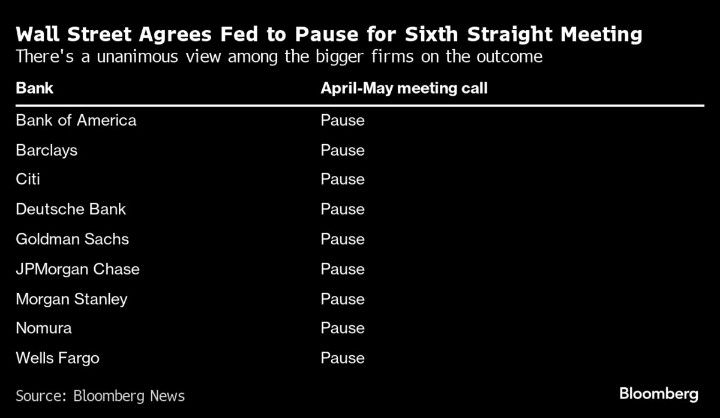
The apparent bet is that the Fed will be cutting rates soon. As is becoming more apparent by the day, however, that’s just not in the cards: No matter how you slice it, the running level of inflation has remained exceedingly sticky and shows no signs of dropping below its current 3-4% range any time soon.
What is also becoming more apparent by the day is that the money-printers at the Fed have led Washington into a massive fiscal calamity. It is only a matter of time, therefore, until the excrement hits the fan like never before.
And with Bidenomics killing off household excess savings, we won’t be going down to the nightclub anymore.
Joe Biden likes to sell himself as “working class Joe” or “union Joe.” The truth is anything but. He is “Washington DC insider Joe” or “big corporate Joe.”
The US mortgage 30 year rate is down slightly today to 7.30%. That is a whopping 160% increase since Biden’s Presidency began.
Mortgage rates will continue to climb as the US Treasury 10-year yield climbs.
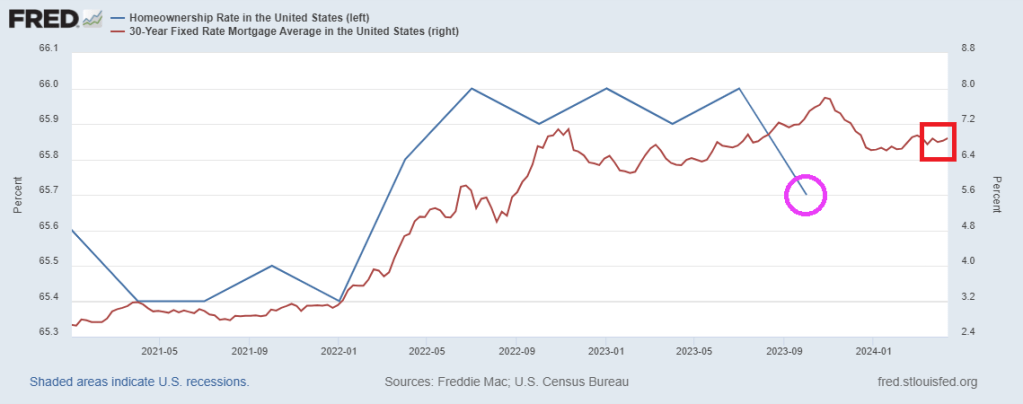
The US homeownership rate is falling as mortgage rates climb.
Joe Biden (aka, BeelzeBiden) is really a piece of … work. His policies are helping drive prices through the roof, he seeks to protect deepstate employees against removal by Trump, had a disastrous withdrawal from Afghanistan and is getting the US engaged in possible hot wars in Ukraine (against Russia), open borders allowing US crime to spike, seems to be suppoporting Hamas over our long-time ally Israel, the list goes on. Biden’s big push for electric cars is a Socialist fantasty and simply unrealistick, drives up energy costs and is EXPENSIVE. It is like Biden is the demon Beelzebub from the TV show “Supernatural.” I once referred to Washington DC as “Mordor on The Potomac.”
Throw in the Federal Reserve operating outside their mandate (excessive interference in the financial crisis of 2008, the excessive interfernce after the Covid outbreak in 2020) and the two together are destroying the US.
Look at housing prices (up 32.5% under Biden) against the purcchasing power of the US dollar (down -16.1% under Biden).
The problem has gotten so bad that Sedona, Arizona, recently set aside a parking lot exclusively for these homeless workers. The city is even installing toilets and showers for the new occupants.
Apparently, the City Council thought installing temporary utilities was cheaper than solving the area’s cost-of-living crisis.
And what a crisis it is.
The average home in the city sells for $930,000, while most of the housing available for rent is not apartments, but luxury homes targeted at wealthy people on vacation.
With such a shortage of middle-class housing and with starter homes essentially nonexistent, low- and even middle-income blue-collar workers have nowhere to go at night but their back seat.
Much like America’s Great Depression in the 1930s, this marks a serious regression in our national standard of living. But shantytowns were not prevalent in the 1920s (a decade that began with a depression) or the 1910s. Nor were they ubiquitous following the Panic of 1907, which set off one of the worst recessions in American history.
Indeed, Americans in the Great Depression faced such a cost-of-living crisis that many were forced to accept a standard of living below what their parents and even their grandparents had.
Fast-forward about 90 years, and countless families are in the same boat. Many young people today don’t think they’ll ever be able to achieve the American dream of homeownership that their parents and grandparents achieved. The worst inflation in 40 years, rising interest rates, and a collapse of real (inflation-adjusted) earnings mean a huge step backward financially.
That inflation has pushed up rents so much that young Americans are moving back in with their parents at rates not seen since the Great Depression because they can’t make it on their own. Sometimes, they can’t even make it with multiple roommates.
But many people cannot move back in with family, so the car it is.
The housing problem is not limited to wealthy towns in Arizona, however. It is systemic. The monthly mortgage payment on a median-price home has doubled since January 2021, and rents are at record highs. Like the Great Depression, this disaster stems from impolitic public policy.
For the past several years, the government has spent, borrowed, and created trillions of dollars it didn’t have. The predictable result of this profligacy was runaway inflation, followed by equally foreseeable interest rate increases.
The deadly combination of high prices and high interest rates has frozen the housing market and reduced homeownership affordability metrics to near-record lows. In several major metropolitan areas, it takes more than 100 percent of the median household after-tax income to afford a median-price home.
Since rents and virtually all other prices have risen so much faster than incomes over the past three years, even renting is unaffordable today, so many people have to go into debt to keep a roof over their heads. And for some, that’s a car roof.
This is the kind of story you might expect from a Third World country or somewhere behind the Iron Curtain during the Cold War, not the largest economy in the world—at least not outside of a depression like the one in the 1930s.
Hoover certainly deserved some blame for the Great Depression, but so did the progressives in Congress, who came from both parties and repeatedly voted to meddle in the economy instead of allowing it to recover from the initial downturn.
Similarly, President Joe Biden deserves blame for constantly advocating runaway government spending. (Runaway Joe??)
But today’s multitrillion-dollar deficits are also made possible by the big spenders in Congress, who come from both parties.
If this bipartisan prodigality of Washington continues, Bidenvilles will only become more widespread as the housing affordability crisis worsens.
Biden’s official White House portrait.
Washington DC under Biden and Schumer, Pelosi, etc.
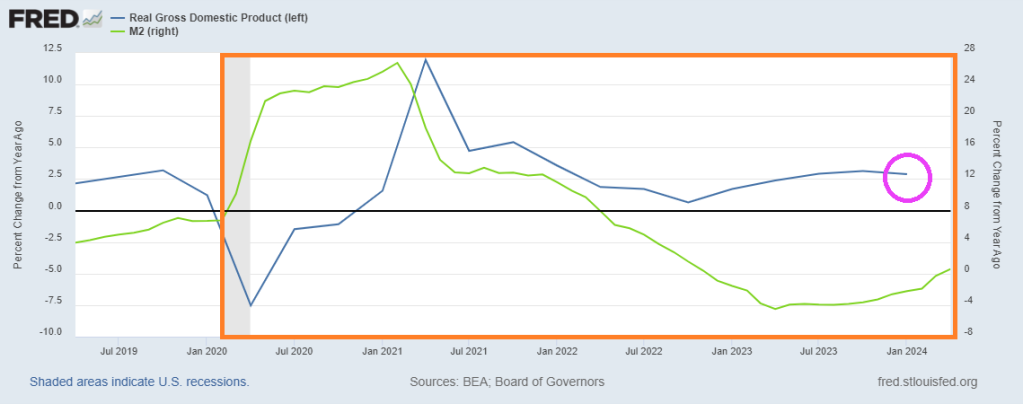
Bidenomics is really about insane money printing after Covid and the installation of Biden as President. Biden and The Federal Reserve are both pushin’ too hard. Biden to fundamentally change the US and The Fed trying to cope with the inflation reaction. With Covid and then Biden’s selection as President, Federal outlays exploded (blue line) and remain elevated under Biden. To help finance the (outrageous) spending The Federal Reserve massively increased the M2 Money supply (green line). Now, The Fed has withdrawn some of the excessive monetary stimulus, but there is a staggering amount monetary stimulus still swimming around the economy like a Great White Shark.
The problem with Federal policies (energy, government spending, government debt) is that there are unpredictable factors that undo the best laid plans of mice and men. And rats such as crop blights and changes in consumer habits.
A good example is the Strategic Petroleum Reserve, which can be drained if craven politicians want to manage oil and gasoline prices for political purposes. Unfortunately, the promise of replenishment is made difficult by rising crude oil prices. The Biden admin cancels plan to refill emergency oil reserve amid high prices (some caused by factors such as war, often caused by government).
In fact, spot crude is up 73% under Biden. Partly, because of Biden’s promised war on fossil fuels and international disasters like war, blights, etc. This is why I cringe when I hear politicians and “economists” discuss why inflation will fall.
On the food side, we have cocoa prices rising 136% under Biden. Again, not predictable when policies were being made. Combine crop blights were rising transportation costs and DC, we have a problem! But this is one reason why The Fed, etc, focus on core inflation (excluding energy and food prices).
There are many examples of rising prices and how they hurt consumers, particularly middle-class and low wage workers.
How did The Federal Reserve react to the inflation Biden helped create? They raised The Fed Funds Target Rate (Upper Bound) by 2,100% to combat Bidenflation. Freddie Mac’s 30-year mortgage rate is up 156% helping to crush homeownership aspiration for younger households.
And then we have Congress/Biden shoveling more than $10 billion in subsidies to Intel, even though Intel has an incentive to develop chips using borrowed funds and Intel retained earnings. But why put your shareholders at risk in case the chip gamble doesn’t payoff. Just shift the risk to US taxpayers!
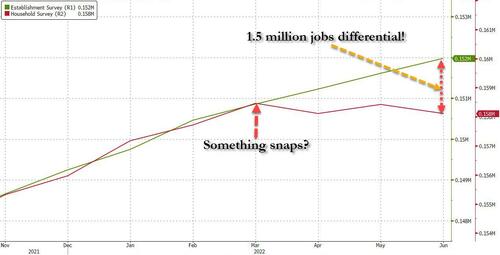
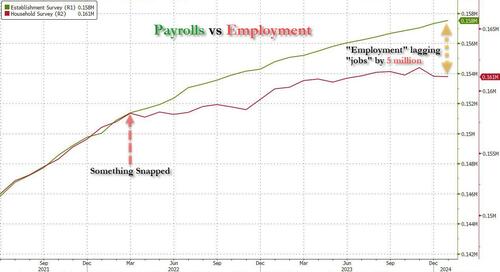
Something has snapped in the labor market: that’s when a staggering discrepancy emerged between the number of Payrolls (as measured by the BLS’ Establishment Survey, a far more crude and imprecise, yet much more market-moving data series), and the number of actual Employed Workers (as measured by the BLS’ far more accurate Household Survey). As we showed at the time, after the two series had tracked each other tick for tick, a gap opened in March 2022 which quickly grew to 1.5 million jobs in just 3 months…
… and has since exploded to a whopping gap of 5 million “jobs” that apparently do not exist.
And while some of this discrepancy could be explained with the record surge in multiple jobholders, which increased by 1 million since March 2022 to an all time high of 8.6 million at the end of 2023 (as a reminder, the Establishment Survey counts 1 worker have 2 or 3 (or more) multiple jobs as, well, 2 or 3 (or more) separate jobs, even if it is just one worker trying to make ends meet under the roaring inflation of Bidenomics), most of the gap remained unexplained.
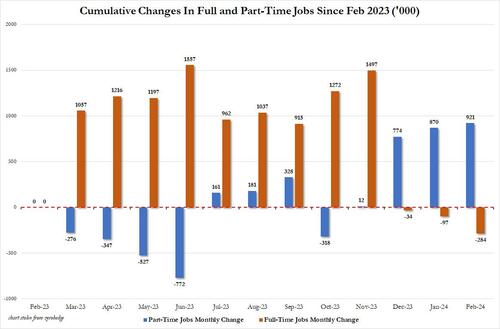
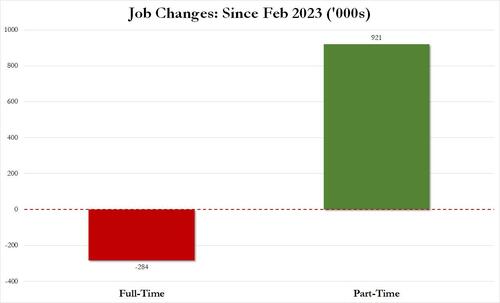
There was more: it was around the summer of 2022 that the Biden labor department – in its zeal to show job growth no matter the cost, or quality of jobs – also started fooling around with the composition of the labor market, with most of the monthly gains going to part-time workers, even as full-time workers stagnated or declined. The culmination, as we reported earlier this month, is that in February 2024, the US had 132.9 million full-time jobs and 27.9 million part-time jobs. Which is great… until you look back one year and find that in February 2023 the US had 133.2 million full-time jobs, or more than it does one year later! And yes, all the job growth since then has been in part-time jobs, which have increased by 921K since February 2023 (from 27.020 million to 27.941 million).
In other words, starting in 2022 and accelerating to present days, less and less full-time jobs were added, until we got to the absurd situation that all the new jobs in the past year have been part-time jobs!
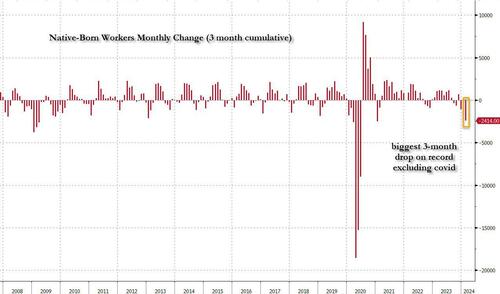
And then there was, of course, the great jobs replacement theory, only as we first showed well over a year ago, it wasn’t a theory but practice, and following countless months in which native-born workers lost their jobs, including a near-record 3-month plunge to start 2024…
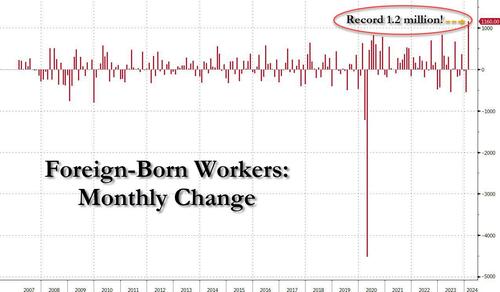
… offset by a record 1.2 million foreign-born (read immigrants, both legal and illegal but mostly illegal) workers added in February…
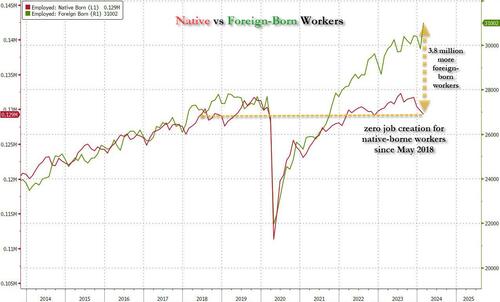
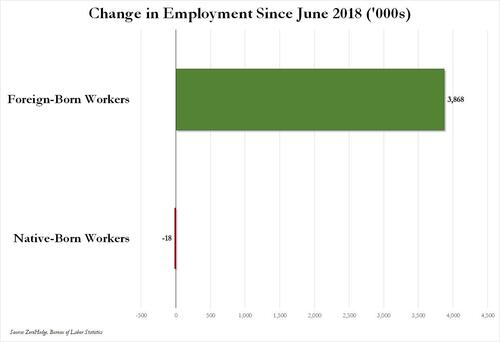
Or, as we first pointed out several months ago, not only has all job creation in the past 6 years – since May 2018 – has been exclusively for foreign-born workers…
… but there has been zero job-creation for native born workers since June 2018!
Ok fine, but all of the above are really just example of the Biden admin Labor Department playing around with statistics and trying (and succeeding) to fool the greatest number of people. There is really nothing about outright data rigging and fabrication… and also while we realize that the Household survey shows a far uglier labor market – one where part-time jobs, illegal immigrants, and multiple jobholders dominate – what about the Establishment survey, which is behind the actual payrolls number, the only number that matters as far as the market is concerned?
All good points, and to address them, we first have to go back to December 2022, when it reported something shocking: as part of its data analysis of the “more comprehensive, accurate job estimates released by the BLS as part of its Quarterly Census of Employment and Wages (QCEW) program“, the Philadelphia Fed found that the BLS had overstated jobs to the tune of 1.1 million! This is what the Philadelphia Fed wrote in its quarterly Early Benchmark Revision of State Payroll Employment report at the time:
Our estimates incorporate more comprehensive, accurate job estimates released by the BLS as part of its Quarterly Census of Employment and Wages (QCEW) program to augment the sample data from the BLS’s CES that are issued monthly on a timely basis. All percentage change calculations are expressed as annualized rates. Read more about our methodology. Learn more about interpreting our early benchmark estimates.
So what did this “more accurate”, “more comprehensive” report find? It found that…
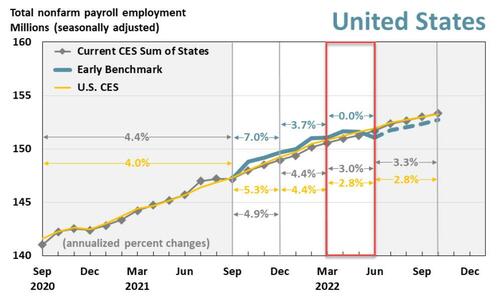
In the aggregate, 10,500 net new jobs were added during the period rather than the 1,121,500 jobs estimated by the sum of the states; the U.S. CES estimated net growth of 1,047,000 jobs for the period.
This is shown graphically in the chart below: specifically, the analysis looks at the quarter in the red box, where the green line, or the more accurate “early benchmark” revision of official data, dipped decidedly below the CES trendline (i.e., the nonfarm payrolls).
Alas, since the far more accurate Quarterly Census of Employment and Wages (QCEW) numbers would not be actually incorporated into BLS benchmarks for well over a year after we wrote our analysis in Dec 2022, neither we nor the market would know just how manipulated the data was until early 2024. Which, of course, is now, and as we already know, the BLS had been consistently downward revising virtually all initial job prints in 2023 (ten of the eleven jobs reports heading into Dec 2023 were revised lower) to make the economy more realistic but only in retrospect…
… however, even though we do know now that the jobs data in 2022 was far weaker than anyone thought at the time, nobody really cares: after all there are part-time jobs and illegal immigrants to plug any and all historical holes, plus we are talking about ancient history.
Plus, we have all those great recent jobs reports to fall back on: the ones that confirm that Bidenomics is doing such a great job.
Only… that’s not true either.Presenting Exhibit A: the latest Philadelphia Fed quarterly report on Early Benchmark Revisions of State Payroll Employment. It shows that once again, the BLS has been fabricating jobs, and not just any jobs but those that make up the all-important (if highly inaccurate) payrolls reported by the Biden Bureau of Goalseeked Statistics.
The primary purpose of this analysis, in the Philly Fed’s own words, is “to produce timely estimates of state payroll jobs that closely predict the annual benchmark revisions released by the BLS each March. To do so, we incorporate more comprehensive job estimates released by the BLS as part of its Quarterly Census of Employment and Wages (QCEW) program.” This is more or less a replica of the analysis which the Philly Fed performed back in December, when it found that 1.1 million jobs were unexpectedly “missing.”
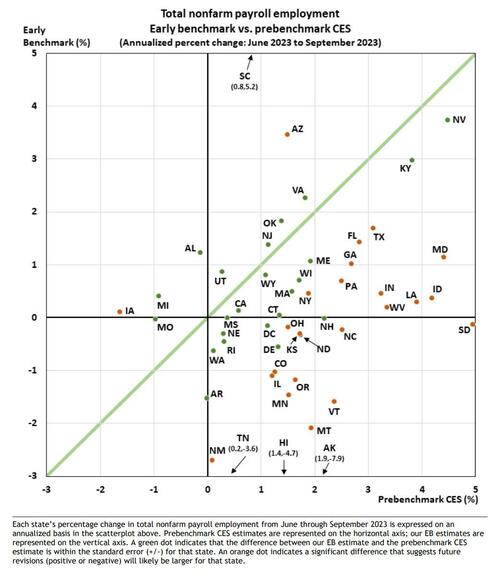
So what happened this time? Well, the analysis, which looked at state-level data, “found that “the employment changes from June through September 2023 were significantly different in 27 states compared with prebenchmark state estimates from the Bureau of Labor Statistics’ (BLS) Current Employment Statistics (CES).” Specifically, “early benchmark (EB) estimates indicated lower changes in 24 states, higher changes in three states, and lesser changes in the remaining 23 states and the District of Columbia.“
Some more details from the report:
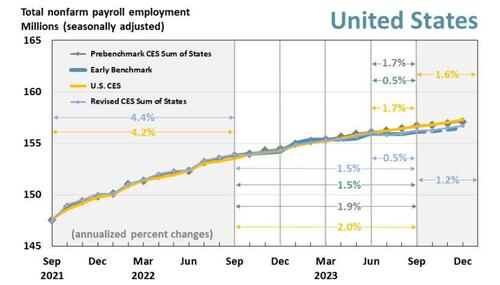
Over the full year ending with this 2023 Q3 vintage — which includes additional QCEW data changes affecting the prior three quarters — payroll jobs in the 50 states and the District of Columbia grew 1.5 percent.
Based on the pre-benchmark CES sum of states and the U.S. CES, payroll jobs grew 1.9 percent and 2.0 percent, respectively.
The revised CES sum-of-states growth rate is 1.5 percent.
For 2023 Q3, payroll jobs in the 50 states and the District of Columbia rose 0.5 percent, after adjusting for QCEW data.
Based on both the prebenchmark CES sum of states and the U.S. CES, payroll jobs grew 1.7 percent.
The revised CES sum-of-states growth rate is 0.5 percent
We’ll go back to the chart above in a second, but first we wanted to show this scatter of state-level employment comparing the St Louis Fed’s more accurate early benchmarking process vs the BLS’ Prebenchmarking CES process: it found that most states’ labor data would be revised lower, in many substantially so.
Ok… but what does all of that mean in English?
Well, to make some more sense of the data, we went through the Early Benchmark state-level data excel spreadsheet provided by the Philly Fed (link), and simply added across the various states to obtain aggregate, country-level data so that we could compare the far more accurate QCEW data with what the BLS had been peddling for the past year.
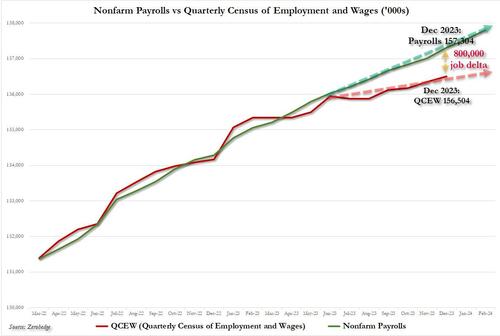
The result was – again – shocking, and as shown in the chart below, a little over a year after we, or rather the Philly Fed, found that the BLS had overstated payrolls in 2022 by 1.1 million, here we go again, only this time the BLS had overstated payrolls by 800,000 through Dec 2023 (and more if one were to extend the data series into 2024). It’s truly statistically remarkable how every time the data error is in favor of a stronger, if fake, economy.
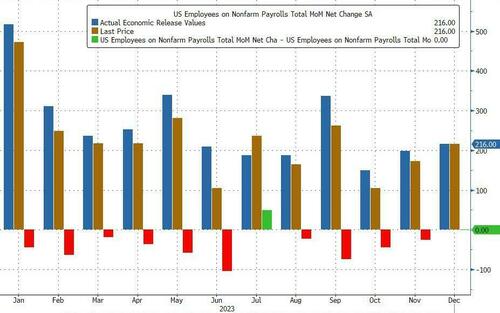
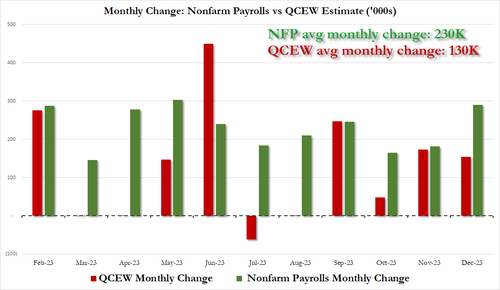
it also means that far from the stellar 230K average monthly increase in payrolls in 2023, which the White House would spin time and again as direct evidence of the benefits of Bidenomics, the true average monthly payroll increase in 2023 was only 130K! The full monthly change in payrolls as originally reported by the BLS (in green) and the actual monthly number, as per the QCEW (in red) is shown below.
Putting it all together, we now know – as the Philly Fed reported first – that the labor market is far weaker than conventionally believed. In fact, no less than 800,000 payrolls are “missing” when one uses the far more accurate Quarterly Census of Employment and Wages data rather than the BLS’ woefully inaccurate and politically mandated payrolls “data”, and if one looks back the the monthly gains across most of 2023, one gets not 230K jobs added on average every month but rather 130K.
Of course, none of that paints Bidenomics in a flattering picture, because while one can at least pretend that issuing $1 trillion in debt every 100 days to add 3 million jos per year is somewhat acceptable, learning that that ridiculous amount buys 800,000 jobs less is hardly the endorsement that the White House needs.
Which is also why nobody in the mainstream media – which is now nothing more than the PR smokescreen for the Biden puppetmasters, the government and the deep state – will ever mention this report.


You must be logged in to post a comment.