Pension Funds in Historic Surplus Eye $1 Trillion of Bond-Buying (Consumers In Bad Shape With Personal Savings Down 53.5% YoY And Real Weekly Earnings Negative For 21 Straight Weeks, GOLD Soaring!)

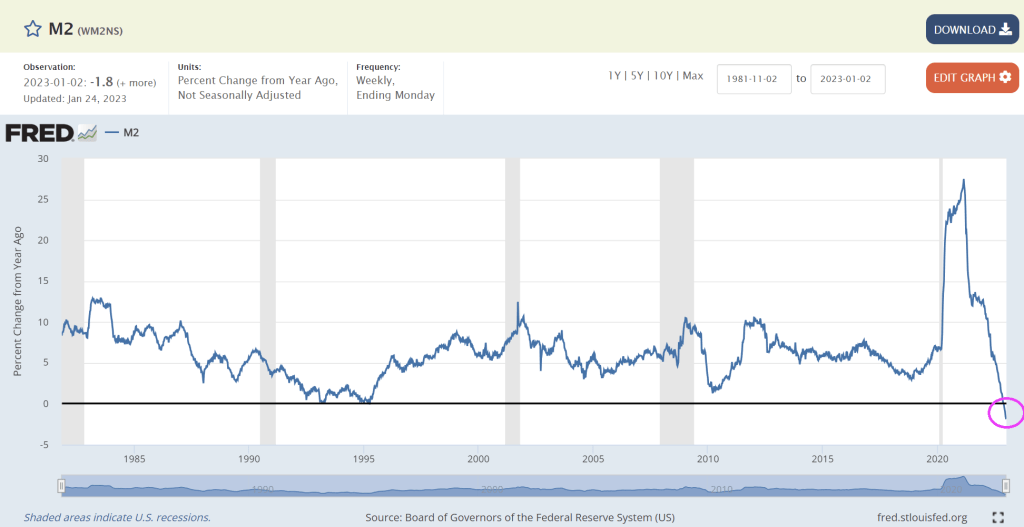
Despite polticians like President Biden cheerleading his great economic accomplishments and Treasury Secretary Janet Yellen dipping into Social Security to fund the Federal government (much like Biden’s dipping into the Strategic Petroleum Reserve), there are serious problems facing America’s middle class and low-wage workers. Inflation is still brutal (but slowing) and REAL weekly earnings growth has been negative for 21 straight months (meaning that Biden’s bragging about wage growth has been destroyed by the inflation created by his energy policies and massive spending sprees). Personal spending rate YoY has plunged -53.5% to cope with inflation. To quote Joe Biden (Chauncy Gardner), “All is well in the garden.” But all is not well in the garden. As a result, we are now seeing pension funds jumping from stocks to bonds.

(Bloomberg) For some of America’s biggest bond buyers, the soft-versus-hard-landing debate on Wall Street might be a sideshow. They’re getting ready to swoop in with as much as $1 trillion, no matter what happens.

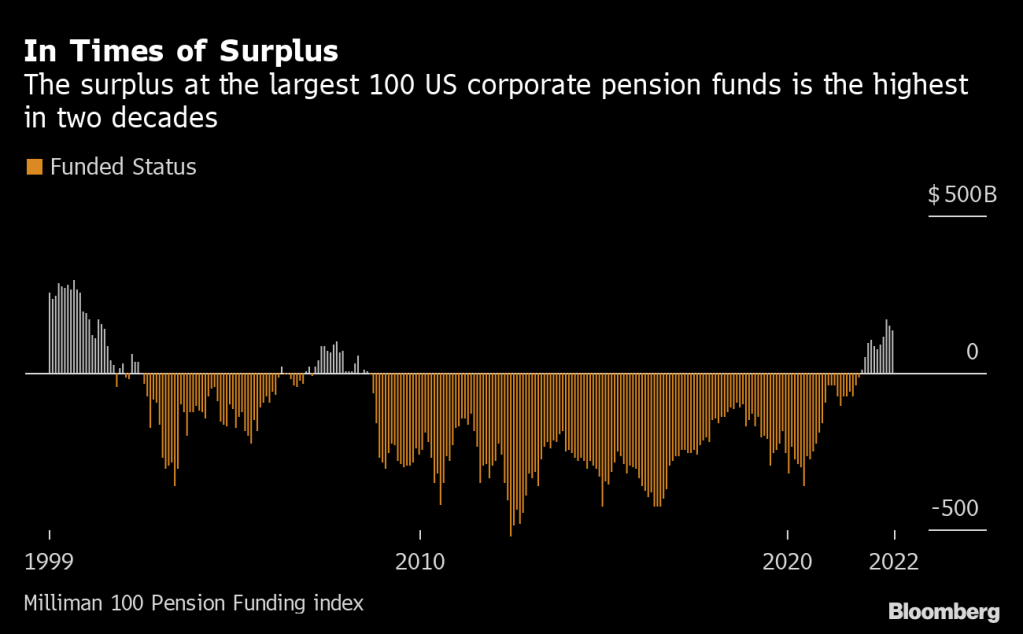
One of the pillars of the trillion-dollar pension fund complex is now awash in cash after struggling under deficits for two decades. This rare surplus at corporate defined-benefit plans, thanks to surging interest rates, means they can reallocate to bonds that are less volatile than stocks — “derisking” in industry parlance. 

Strategists at Wall Street banks including JPMorgan Chase & Co., Bank of America Corp. and Wells Fargo & Co. say the impact will be far-reaching in what’s already being coined “the year of the bond.” Judging from the cash flooding into fixed income, they’re just getting started.

“The pensions are in good shape. They can now essentially immunize — take out the equities, move into bonds and try to have assets match liabilities,” Mike Schumacher, head of macro strategy at Wells Fargo, said in an interview. “That explains some of the rallying of the bond market over the last three or four weeks.”

An irony of pension accounting is that a year like last year, with its twin routs in stocks and bonds, can be a blessing of sorts to some benefit plans, whose future costs are a function of interest rates. When rates climb, their liabilities shrink and their “funded status” actually improves.

The largest 100 US corporate pension plans now enjoy an average funding ratio of about 110%, the highest level in more than two decades, according to the Milliman 100 Pension Funding index. That’s welcome news for fund managers who suffered years of rock-bottom interest rates and were forced to chase returns in the equity market.

Now, they have an opportunity to unwind that imbalance and Wall Street banks pretty much agree on how they’ll use the extra cash to do it: buying bonds, and then selling stocks to buy more bonds. 

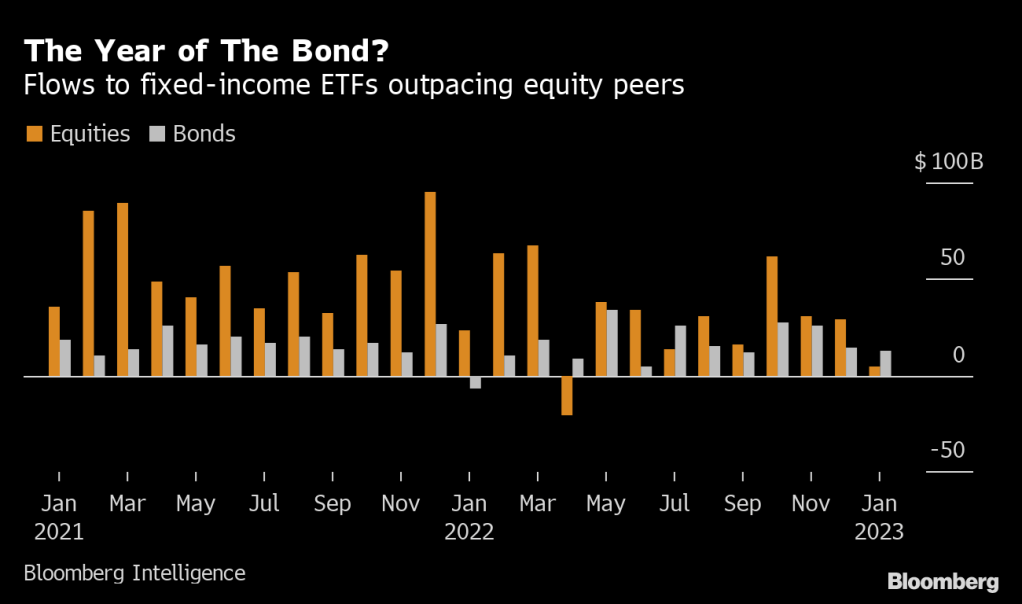
Already this year fixed-income flows are outpacing those of equity funds, marking the most lopsided relationship since July. 

How much of that is due to derisking by pension funds is anyone’s guess. Some of the recent rally in bonds can be ascribed to traders hedging a growth downturn that would hit stocks hardest.

But what’s obvious is their clear preference for long-maturity fixed-income assets that most closely match their long-dated liabilities.

Pension funds need to keep some exposure to stocks to boost returns, but that equation is changing. 

Once a corporate plan reaches full funding, their aim is often to derisk by jettisoning stocks and adding fixed income assets that line up with their liabilities. With the largest 100 US corporate defined benefit funds riding a cash pile of $133 billion after average yields on corporate debt more than doubled last year, their path is wide open.

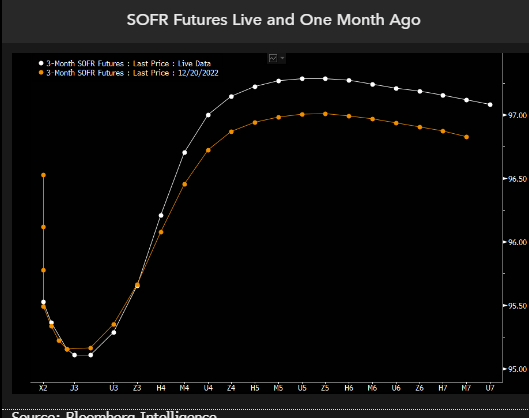
With yields unlikely to go above their peak level once the Federal Reserve hits its terminal rate of about 5% around the middle of the year, there’s rarely been a better time for them to make the switch to bonds. 

Even if growth surprises on the upside and yields rise, causing bonds to underperform, the incentive is still there, said Bruno Braizinha, a strategist at Bank of America.

“At this point and considering where we are in the cycle, the conditions are favorable for de-risking,” Braizinha said in an interview. 

JPMorgan’s strategist Marko Kolanovic estimates derisking will lead pension managers to buy as much as $1 trillion of bonds; Bank of America’s Braizinha says a $500 billion buying spree is closer to the mark.

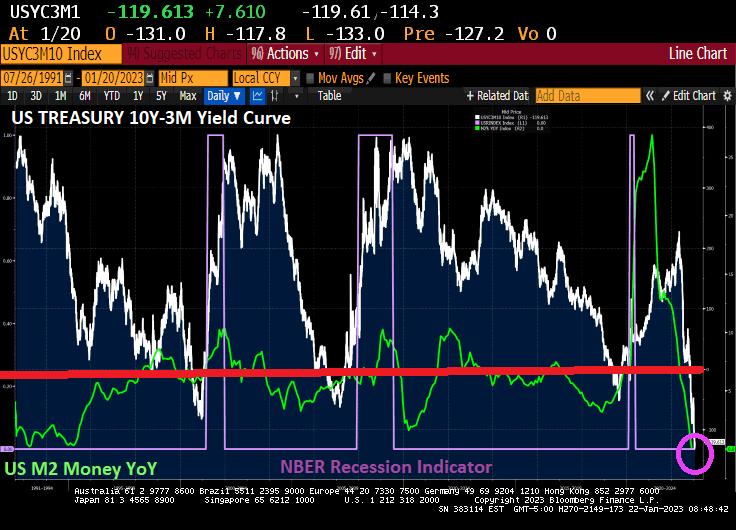
How about gold? As the probability of a US debt default looms (as Bride of Chucky Schumer stomps his feet and says ” No budget cuts!”) and the US Treasury 10Y-3M yield curve remains inverted, gold is soaring.

Perhaps pension funds should by gold rather than cryptos.

Good News, Bad News! US New Home Sales Rise 2.3% In December, But DOWN -23% YoY (Median Price UP 7.8% YoY While M2 Money Growth Goes Negative)

The December new home sales report is good news and bad news.

The good news? US new home sales rose by 2.3% in December from November to 616k units sold SAAR. That is the good news.

The bad news? Since December of 2021, new home sales fell -23% year-over-year (YoY).

The median price of new home sales rose 7.8% YoY, but the trend as The Fed withdraws monetary stimulus (orange line) is not good.

Perhaps there is a communications breakdown between the Biden Administration and The Federal Reserve.

Just Like The Fed! M2 Broad Money Supply Growth Falls To -1.8% YoY, M1 Money Growth Falls To -3.6% YoY As US Job Layoffs Accelerate

Its just like The Federal Reserve to be cutting US money growth as US jobs cuts accelerate.

The latest US money growth numbers are out and they are daunting. M2 Money growth YoY is now negative at -1.8%.

M1 money, a narrower defition of money, is now down -3.6% YoY.

This is happening as the labor market is seeing a wave of layoffs.

As M2 growth YoY and The Fed balance sheet shrinks, so does Cathie Wood’s AARK.

We are just the stepping stone for The Fed.

As The Fed ponders inflation versus job growth, its a case of “Him or Me, What’s it going to be?”

Gas Prices Set To Soar As Crack Spread Jumps On Tightening Fuel Supplies (Gasoline Prices UP 45% Under Biden, Diesel Prices UP 77%, Strategic Petroleum Reserve DOWN -47%)

U.S. oil refining margins, also known as the 3-2-1 crack spread, jumped to a three-month high on Tuesday — and that’s an indication the country faces an ongoing product shortage that might lead to higher gasoline and diesel prices at the pump

The 3-2-1 crack spread is a great indicator to gauge fuel product tightness. High spreads indicate gasoline, diesel, jet fuel, and other petroleum products are in short supply, while low spreads mean an abundance of supply. Spread direction is also important — if rising, it would mean fuel inventories are declining. 

The simple calculation of refining margins is for every three barrels of crude oil the refinery processes — it makes two barrels of gasoline and one barrel of distillates like diesel and jet fuel.

On Tuesday, the crack spread hit a three-month high of $42 a barrel. For some context, the five-year January average is $15.56.  

Reuters pointed out that refinery outages exacerbate fuel supply tightness. 

A diesel producing unit at PBF Energy’s (PBF.N) Chalmette, Louisiana, refinery was shut following a fire on Saturday. It could be out for at least a month. Exxon Mobil (XOM.N) said Monday it will perform planned maintenance on several units at its Baytown, Texas, petrochemical complex.

The ongoing refinery maintenance season could be much lengthier than usual, with many U.S. Gulf Coast refineries still running below capacity after Winter Storm Elliott knocked out some 1.5 million barrels per day of refining capacity in December. A Suncor refinery in Commerce City, Colorado, has remained offline since the storm.

Also, the number of refinery overhauls is double the amount this spring. Many of these overhauls were postponed due to the pandemic. Some are due to record-high margins driving increased profitability for oil companies. 

There are at least 15 oil refineries plan maintenance ranging from two to 11 weeks through May, tallies by Reuters and refining intelligence firm IIR Energy show. By mid-February, U.S. refiners will drop some 1.4 million barrels per day of processing capacity, double the five-year average. 

“A lot of plants didn’t want to shut down last year when margins were strong, but they have to get this work done,” said John Auers, refining analyst with Refined Fuels Analytics.

Nine U.S. refineries operated by Marathon Petroleum, Valero Energy, Exxon Mobil, Phillips 66, and BP will shutter some of their fuel-producing units this spring, according to IIR and Reuters sources.

All of the outages and planned overhauls are going to make it difficult for refiners to catch up with demand as inventories are relative to historical levels. 

“If we aren’t hearing the alarm bells, it’s because we’re deaf after refining margins reached eye-watering levels in 2022, when the 3-2-1 crack spread briefly surged above $60. But from a historical perspective, current margins are sky-high, as well,” Bloomberg Opinion’s Javier Blas said. 

According to AAA data, gasoline and diesel prices at the pump are starting to move higher after months of declines following the rise in the 3:2:1 crack spread. 

And the ‘raw materials’ for the refining process are rising rapidly…

Perhaps the victory lap was a little premature? 

Mission Accomplished 2.0?

Not really. US gasoline prices are UP 45% under Biden, diesel prices (the lifeblood of the shipping industry) are UP 77 under Clueless Joe and the Strategic Petroleum Reserve is DOWN -47% under China Joe.

MBA Purchase Applications Drop -.58% Since Last Week, Refi Apps Rise 3.15% WoW As Mortgage Rates Declined 3rd Straight Week (Purchase Apps Down -39% Since Same Week Last Year, Refi Apps Down 77%)

Falling mortgage rates are having a predictible effect on mortgage refinancing applications, but not so much for mortgage purchase applications.

Mortgage applications increased 7.0 percent from one week earlier, according to data from the Mortgage Bankers Association’s (MBA) Weekly Mortgage Applications Survey for the week ending January 20, 2023. This week’s results include an adjustment for the observance of Martin Luther King, Jr. Day.

The Refinance Index increased 3.15 percent from the previous week and was 77 percent lower than the same week one year ago. The unadjusted Purchase Index decreased 1 percent compared with the previous week and was 39 percent lower than the same week one year ago.

Generally speaking, declining mortgage rates are due to declining 10-year Treasury yields. And 10-year Treasury yields decline as the economy weakens. Of course, M2 Money growth YoY is now 0% as The Fed tightens.

On a humerous note, US Treasury Secretary Janet “The Evil Gnome” Yellen is visiting Africa and lecturing them on prudcnt sovereigh debt management. Seriously. China responded with “Fix the US debt problems before you lecture anyone else.”

Winter Is Coming! Richmond Fed Outlook Declines To -11 As Philly Fed Outlook Down To -8.9 And NY Empire State Outlook Down To -32.9 (US 10Y-3M Yield Curve Inverts To -126.5 Basis Points)

Three regional Fed reports I like to watch are New York’s Empire State Outlook, Philly Fed’s Outlook and Richmond Fed’s outlook. Today, The Richmond Fed released their manufacturing outlook and … it declined to -11.

So the big three are all down (Philly down to -8.9 while NY’s Empire State outlook is down to -32.9.

On the Treasury front, the US 10Y-3M yield curve inverted further (a signal of impending recession) just tanked to -126.462 basis points.

Winter is coming!

US Leading Indicator More Like Bleeding Indicator After 10 Straight Months Of Declines, Down -1% As M2 Money Growth Dies (Mortgage Rate Rises To 6.47%)

The Conference Board’s Leading Indicator should be called The Bleeding Indicator given that the leading index has declined to 10 straight months. This is happening as The Fed tightens monetary policy to combat inflation.

Leading indicators include economic variables that tend to move before changes in the overall economy. These indicators give a sense of the future state of an economy.

How about mortgage rates? Settling in a 6.47%.

The Secret Panel? US Yield Curve Inversion, CDS Default Price, SOFR Signals More Rate Increases Then Rate Cuts

Ah, the start of a new week with Treasury Secretary Janet Yellen arguing (with a straight face) that there is no room in the Federal budget for cuts. Apparenly, Yellen never read any of the massive, pork-laden spending bills signed by Biden (no one else did in Congress either, nor did Biden).

Let’s start with the US credit default swap (1 year). It remains high at 68.72 (the price of insuring against a US default). And the US Treasury yield curve (10Y-3M)? It remains deeply inverted at -114 basis points this morning signaling an impending US recession.

Then we have SOFR (Secured Overnight Financing Rate). SOFR futures are pricing for the Federal Reserve to hike rates a few more times and to start cutting before the end of this year. The pricing for the 2023 rate path is little changed from a month ago, but this year the market has priced in deeper cuts in 2024, with SOFR now seen below 3% by early 2025 before stabilizing. The implication is that hedging recession and significant rate cuts in 2024 now seems to be fully priced in, yet there’s a risk that the Fed cuts even deeper than the market is factoring in.

We think the market is partially preparing for the risk of even deeper rate cuts than linear instruments are pricing. To see how dramatic those are, we can look at options on SOFR futures and model what’s being priced by the volatility surface.

We are seeing the same story if we look at Fed Funds Futures data. Fed rate hikes until June, then rate cuts to follow.

How did Biden’s lawyers and now the DOJ figure out that Biden has classified documents all over the place? Probably from reading “The Hardy Boys.” Except that Biden didn’t cleverly hide classifed documents. Rather, he carelessly left them lying around at The Penn Biden Center and his home in Wilmington Delaware that he shared with his son, Hunter. And probably on the Amtrak train he would take from Wilmington to Union Station in DC. And probably at Chinatown Garden, a short walk from The White House.

United States Yield Curve 3M10Y Most Inverted In 30+ Years! (But Other Assets Signaling Cooling Odds Of Recession)

The first headline I saw when I turned on Bloomberg.com was “DOJ Officials Find More Classified Documents at President Biden’s Home.” This is an improvement! So far, the task has been handled by Biden’s private attorneys who don’t have proper security clearance; at least the Justice Department is finally getting involved!

But back to the US yield curve. It is now the most inverted in 30+ years as M2 Money growth stalls. Inverted yield curves have preceded recessions in the past.

But as China reopens and Europe is experiencing a warmer winter than expected (meaning that Europe has sufficient natural gas reserves) and US inflation cooling,

we are seeing market-implied odds of a recession falling in January.

I am still betting on a recession in the second half of 2023.

The Great Biden/Pelosi/Schumer Powell (4 Horsemen) Inflation Tax In One Chart (Personal Savings DOWN -64.8%, Consumer Credit UP, Real Weekly Earnings Growth NEGATIVE For 21 Straight Weeks)

I must admit, Joe Biden has a horribly misleading nickname “Middle Class Joe.” Between Biden’s horrible energy policies and Pelosi’s/Schumer’s spending binges, the US middle class and low wage workers have suffered mightely with the inflation tax. Throw in Jerome Powell and The Federal Reserve’s manic money printing and the American middle class has a problem.

US inflation peaked at 9.1% year-over-year (YoY), but has declined to a still painful 7.1% YoY as The Fed removes it aggressive monetary stimulus. But to cope with persistent US inflation, consumers have had to dip into savings and use more credit cards. As a consequence, personal savings plunged -64.8% YoY while consumer credit rose 7.9% YoY.

The other tax on the middle class and low-wage workers is the 21 straight months of negative REAL weekly earnings growth.

On the housing front, REAL home prices are growing at 1.5% YoY while REAL weekly wage growth is still NEGATIVE at -3.13% YoY.

Make no mistake, inflation caused by The Fed and Federal governments spending is a tax on the middle class and low wage workers.

Biden, Pelosi, Schumer and Powell are the 4 Horseman of the Inflation Apocalypse.