Do I detect a trend in the US Leading Economic Indicator data?
The Conference Board’s US Leading Economic Indicator was released this morning and it wasn’t pleasant. The US Leading Index was down -1% MoM in November.
On a year-over-year basis, it is down -4.5% YoY as The Fed withdraws its massive monetary stimulus.
The good news … for military contractors … is that Biden and Congress have given Ukraine’s Zelenskyy ANOTHER $47 BILLION.
On a year-over-year (YoY) basis, US real GDP rose to a measly 1.9%. US core PCE YoY fell slightly to 4.93%. M2 Money growth is at 2.6% YoY.
The Misery Index (U-3 inflation rate + inflation) remains elevated and above 10% (it currently clocks-in at 12%), far above the pre-Covid reading of around 5%.
Here is the rest of the story. On a quarter-over-quarter basis, real GDP rose to 3.2% QoQ. Personal consumption rose 2.3% QoQ. Core PCE (Personal Consumption Expenditures) rose to 4.7% QoQ. If we use core PCE as a measure of inflation, inflation is rising.
Here is a video of Fed Chair Jerome Powell (doubling as President Joe Biden) saying creating inflation and then raising interest rates to fight it “It’s for the best.”
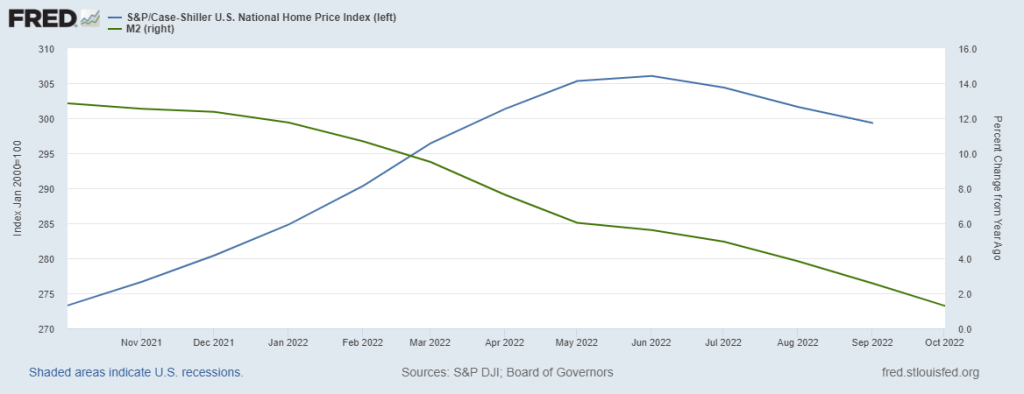
One of the big problems with Federal goverment and Federal Reserve monetary stimulus is … it wears out. Just look at M2 Money growth.
US existing homes sales fell -7.70% in November to 4.09 million units SAAR. And since the same month last year, existing home sales are down -35.4% YoY.
Existing home sales were the lowest in November since 2010.
The good news? The median price of existing homes fell to 3.21% YoY. The bad news? The ark is really bad pointing to a bad December. Inventory for sale (orange line) remains below pre-Covid shutdown levels.
The mortgage market is behaving like today’s bomb cyclone in terms of the weather. Bomb cyclone in that mortgage rates have dropped 7.16% on October 21, 2022 to 6.34% on December 16, 2022 (a drop of 82 basis points), but mortgage purchase and refinancing applications are not increasing like one would hope.
Mortgage applications increased 0.9 percent from one week earlier, according to data from the Mortgage Bankers Association’s (MBA) Weekly Mortgage Applications Survey for the week ending December 16, 2022.
The Refinance Index increased 6 percent from the previous week and was 85 percent lower than the same week one year ago. The seasonally adjusted Purchase Index decreased 0.1 percent from one week earlier. The unadjusted Purchase Index decreased 3 percent compared with the previous week and was 36 percent lower than the same week one year ago.
But remember, The Federal Reserve is going to be lowering their target rate after they keep raising it.
US housing starts plunged -16.4% since the same time last year (aka, YoY) as The Federal Reserve continues tightening its monetary policy.
Since October (aka, MoM), housing starts only dropped -.049% in November. 1-unit detached starts were down -4.06%. But multifamily (5+) starts were up 4.85% MoM.
Building permits were down -11.24% from October to November (baby, its cold outside!) and down -22.4% since November 2021 (aka, YoY).
Rising mortgage rates courtesy of The Federal Reserve’s tightening to fight Bidenflation has led to a Covid-level plunge in the NAHB Homebuilder Market Index.
Everything seems to be going down with a sinking M2 Money growth.
And today, the 10-year US Treasury yield is up over 10 bps. Watch out mortgage rates!
Like the Mel Gibson movie “Apocalypto!”, we are seeing the US middle class and low-wage workers being economically sacrificed by The Federal Reserve, the Biden Administration and Congress.
Despite the rhetoric that Fed stimulus (aka “Stimulypto!”) is being removed, the US remains plagued by NEGATIVE real 10-year Treasury yields, NEGATIVE real Fed Funds Target rate and NEGATIVE real average hourly earnings growth under Inflation Joe.
This chart demonstrates the Stimulytpo problem. Prior to Covid, US wage growth was consistently higher than headline inflation. But starting in March 2021, three months after Biden became President, headline inflation became higher than wage growth.
Even with all these negative REAL rates, the US economy is forecast to have almost no growth in 2023.
To quote Peggy Lee, Is That All There Is? Trillions in Federal spending and Fed monetary stimulus and all we get it 0.50% Real GDP??
Nancy Pelosi is passing her gavel to someone else (most likely McCarthy R-CA), but her legacy like that of fellow spendaholic John Boeher (RINO-Ohio) and Paul Rino (RINO-WI) is reckless spending and debt load.
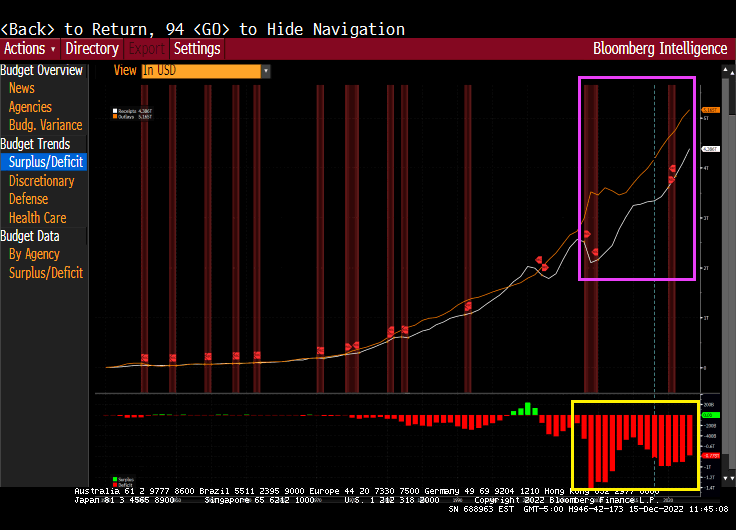
Since 2007 when Pelosi took the gavel as Speaker of the US House, Federal debt has risen from $5.8 trillion in Q4 2006 to $31.4 trillion today, an increase of over 250%. Pelosi’s spending spree was continued by RINOs Boehner and Ryan before SanFranNac retook the gavel and continued Congress’ spend-a-holic ways.
Nothing has been the same since the financial crisis and Pelosi became Speaker in 2007. Notable is the wild spending with the gap between spending and tax revenue soaring.
Since 2007 and SanFranNan, Medicare spending has exploded along with Medicaid.
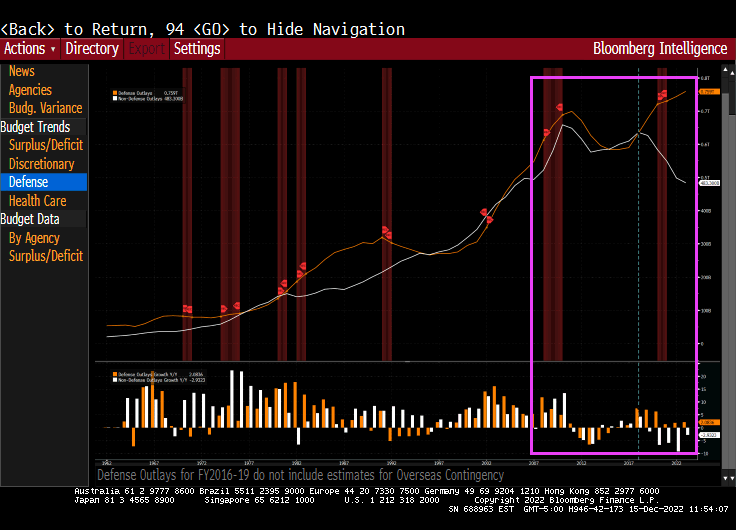
Under peace-loving Pelosi, defense spending has exploded.
And then we have unfunded liabilites from the Federal government at a staggering $173.3 trillion, which is 452% of Federal debt. What did Pelosi (or Boehner/Ryan) do to fix this problem? Nothing. She kept spending like crazy.
It would be nice if Biden told every illegal immigrant that on becoming a citizen, you owe $519,286 in terms of unfunded liabilities and a $94,240 for their share of Federal debt. But, of course, that will never happen.
The S&P 500 index is down -2.44% today as M2 Money growth crashes.
As expected, The Federal Reserve raised their target rate by 50 basis points to 4.50%, the highest Fed target rate since November 2007.
The only thing interesting that happened was Powell’s hawkish statements about The Fed wanting to keep tightening to fight inflation caused under “Inflation Joe” Biden.
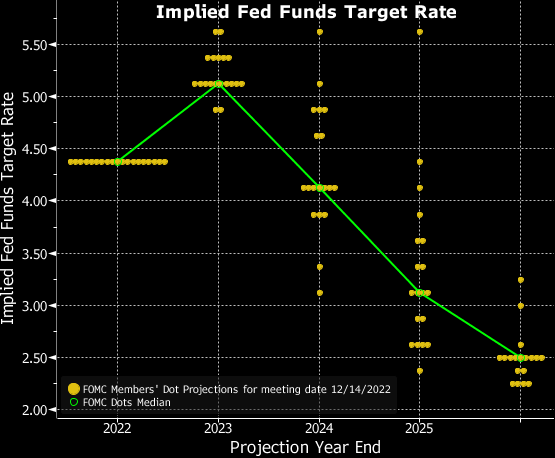
But the NEW Fed Dots plot looks like an Olympic Ski jump with expectations of DECLINING Fed target rates.
My take on the steeply downward sloping Dot Plot is a tacit acknowledgement that a recession is headed our way in 2023.
Here is the Lillehammer Olympic ski jump that resembles today’s Fed Dots Plot.


You must be logged in to post a comment.