Rising mortgage rates courtesy of The Federal Reserve’s tightening to fight Bidenflation has led to a Covid-level plunge in the NAHB Homebuilder Market Index.
Everything seems to be going down with a sinking M2 Money growth.
And today, the 10-year US Treasury yield is up over 10 bps. Watch out mortgage rates!
Like the Mel Gibson movie “Apocalypto!”, we are seeing the US middle class and low-wage workers being economically sacrificed by The Federal Reserve, the Biden Administration and Congress.
Despite the rhetoric that Fed stimulus (aka “Stimulypto!”) is being removed, the US remains plagued by NEGATIVE real 10-year Treasury yields, NEGATIVE real Fed Funds Target rate and NEGATIVE real average hourly earnings growth under Inflation Joe.
This chart demonstrates the Stimulytpo problem. Prior to Covid, US wage growth was consistently higher than headline inflation. But starting in March 2021, three months after Biden became President, headline inflation became higher than wage growth.
Even with all these negative REAL rates, the US economy is forecast to have almost no growth in 2023.
To quote Peggy Lee, Is That All There Is? Trillions in Federal spending and Fed monetary stimulus and all we get it 0.50% Real GDP??
As expected, The Federal Reserve raised their target rate by 50 basis points to 4.50%, the highest Fed target rate since November 2007.
The only thing interesting that happened was Powell’s hawkish statements about The Fed wanting to keep tightening to fight inflation caused under “Inflation Joe” Biden.
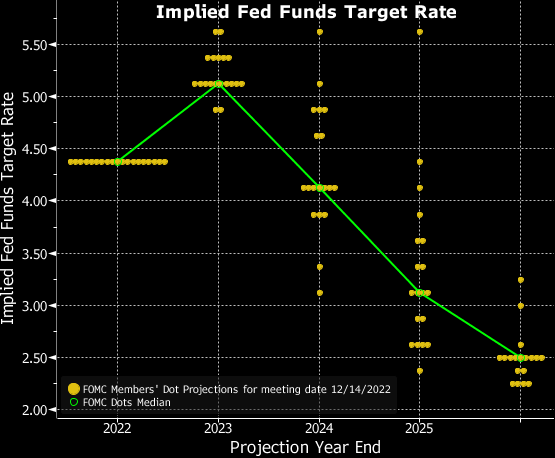
But the NEW Fed Dots plot looks like an Olympic Ski jump with expectations of DECLINING Fed target rates.
My take on the steeply downward sloping Dot Plot is a tacit acknowledgement that a recession is headed our way in 2023.
Here is the Lillehammer Olympic ski jump that resembles today’s Fed Dots Plot.
In August 2020, the Federal Reserve unveiled its new strategic framework. One major objective of the Fed was to address its concerns over the potential consequences for the conduct of monetary policy when the policy rate was constrained by its effective lower bound. This article concludes that there are significant flaws in the new strategy and that it encourages a more discretionary approach to monetary policy and increases the risks of policy errors. The new framework is an overly complex and asymmetric flexible average inflation targeting scheme that introduces a significant inflationary bias into policy and expands the scope for discretion by broadening the Fed’s employment mandate to “maximum inclusive employment.” In a postscript, the article describes how quickly the flaws have been revealed and urges a reset toward a more systematic and coherent strategy that is transparent and broadly understood by the public.
I attended a speech by macoeconomist Gershon Mandelker at the National Association of Realtors where he called on the Federal Reserve to follow some observable rule rather than the complex (or seat of the pants) approach to monetary policy.
With today’s inflation report (core inflation YoY of 6%) results in a Taylor Rule estimate of The Fed Funds Target Rate of 12.07%. We are struggling to reach 5% as a “terminal” Fed target rate (currently at 4% and likely to rise 50 basis points at tomorrow’s Fed meeting).
The matrix of CPI and unemployment under the Taylor Rule shows that The Fed’s target rate isn’t at even 5% for any relevant combination of core CPI (inflation) and unemployment rate.
Note that since the financial crisis the Fed’s target rate (white line) has been consistely below the Taylor Rule implied rate (blue dashed line).
The Federal Reserve is removing the massive punch bowl from the US economy and markets. And with the rising US mortgage rates, we got crashing buying conditions for housing.
The UMich consumer survey for buying conditions for house rose slightly in December to 36, well below 100 (the baseline).
Unlike Archie Bell and the Drells, this tighten-up is about The Federal Reserve tightening-up its monetary policy.
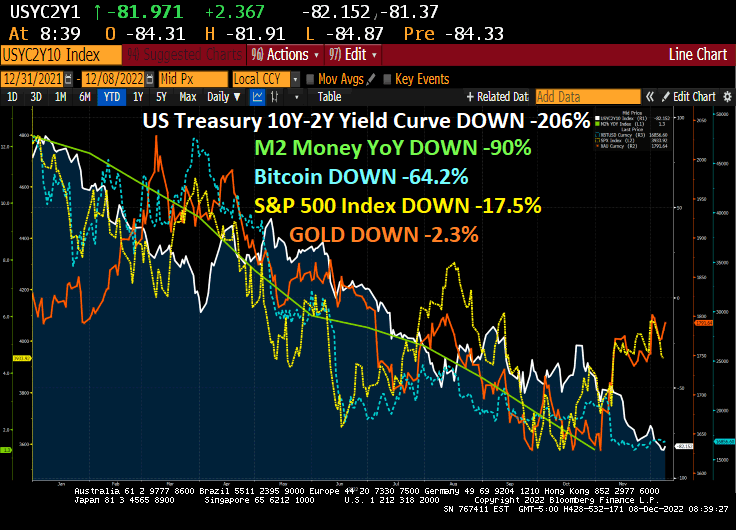
On December 31, 2021, the US Treasury yield curve (10Y-2Y) stood at +77.4 basis points, generally a good omen.
Then markets woke up. And not in a woke way.
As The Fed tightens to tamp down on inflation in 2022, we are seeing a pattern. The US Treasury 10Y=2Y yield curve has sunk to -82 basis points, a -206% decline.
In addition to the inversion of the US Treasury yield curve we have witnessed M2 Money growth declining -90%, the S&P 50) index down -17.5%, Bitcoin down -64.2% and gold down only -2.3%.
But we now have to worry about Project Cedar, a seemingly innocent project to replace the US Dollar. A new digital currency would allow Washington DC to monitor your purchases and behavior. And perhaps create a Social Credit Score like in China measuring how well you conform to Biden’s notion of a utopian, green society.
And the US yield curve has been inverted for 109 straight days.
The Fed has signaled the terminal rate will likely be around 5% — we think an upper bound of 5% — reached in early 2023. To get there, the central bank will likely raise rates by 50 basis points at its December 2022 meeting, followed by two more 25-bp hikes in 2023. We then see it holding at 5% throughout the year. Markets have priced in a similar amount of tightening.
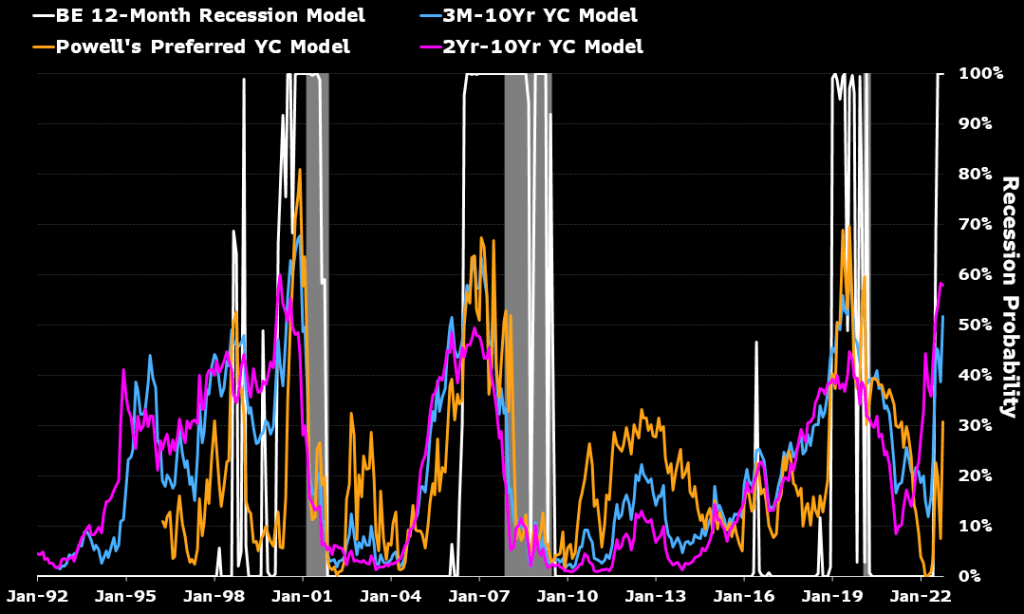
Controlling inflation comes at a cost to growth. Yield curves have inverted. A Bloomberg Economics model shows a 100% probability of recession starting by August 2023. Take that — like all model forecasts — with a grain of salt. But the basic view that aggressive Fed tightening will very likely tip the economy into a downturn is correct.
While various measures of impending US recession show a good chance of a 2023 recession, Powell’s preferred measure of the yield curve shows only a 30% chance.
What Might the Recession Look Like?
We project a 0.9% GDP contraction in 2H 2023, driven by an investment downturn as firms pare inventories amid a downshift in consumption. Residential investment will also contract with real interest rates likely to rise steadily throughout 2023 as nominal rates stay high and inflation moderates.
An Inventory-Led Downturn
Resilient consumption should help put a floor under demand.
Households have enough of a cash buffer — extra savings built up over the course of the pandemic, rising COLAs for Social Security recipients, ongoing state and local government stimulus and solid 2022 wage income growth — to sustain consumption during the recession. Our base case is for real spending to grow at a quarterly annualized pace of about 0.5% in 2023, with strength concentrated in services.
By one measure, households may still have $1.3 trillion in the coffers, based on flows within the personal income report through September. At the current rate of drawdown, that’s enough to last around 15 months, or through the end of 2023. Funds may dry up faster as job losses mount and the unemployed fall back on their savings.
$1.3 Trillion Extra Savings to Keep Spending Positive
The labor market remained exceptionally tight into the end of 2022. We expect it to soften significantly next year, with the unemployment rate rising to 4.5% by the end of 2023. The pace of hiring will slow markedly as support from catch-up hiring dissipates and the effects of restrictive monetary policy settle in. We estimate only 20%-30% of total employment is still in sectors experiencing labor shortages, implying demand for labor is falling fast.
Avoiding a Hard Landing Depends on Inflation, Fed
Extreme circumstances — the pandemic, Russia’s invasion of Ukraine — have made a recession more likely than not. Extreme circumstances can change, and so can policy makers’ response Whether the US can stick a soft landing depends substantially on how external conditions develop and how the Fed responds.
Not our base case, but we can envision a scenario in which the central bank opts to ease rates in 2023, boosting the chances of a soft landing.
One way that could happen is inflation falling faster than expected. Currently, our baseline is for headline CPI to drop to 3.5% and the core to 3.8% by the end of 2023. The most important assumption there is that energy prices remain flat next year from 2022.
In an alternative scenario, inflation fall faster as China maintains Covid controls and growth stumbles. A Bloomberg Economics model attributes the recent fall in oil prices entirely to a drop in demand — mainly from China. If China’s growth falls off the cliff, perhaps amid a sharp rise in Covid cases and resumed lockdowns, commodity prices could tumble sharply.
A warm winter in Europe and the US could also keep energy prices in check. Lower demand from Europe for US liquefied natural gas would help stem the increase in domestic electricity prices.
In that scenario, US energy prices could fall 20% in 2023 and headline inflation may drop to 2% by the end of the year. Lower gasoline prices would work to soften inflation expectations, easing pressure on the Fed to hold rates at higher level. A rate cut could then come in 2H 2023, raising the possibility of a soft landing.
Scenarios of CPI Inflation in 2023
The risk cuts both ways. A quick and successful pivot to reopening in China could boost oil and other commodities prices. A colder winter in Europe and the US would generate upward pressure for electricity and utility prices. Assuming China is fully open by mid-2023 — the base case for our China team — energy prices could increase by 20% in the year. In that case, headline US CPI would hit a bottom of 3.9% in midyear before surging to 5.7% by year-end.
In that scenario, the terminal fed funds rate would most likely top 5%, possibly closing 2023 near the upper end of St. Louis President James Bullard’s estimated restrictive range of 5%-7%.
Bloomberg Economics US Forecast Table
Thanks to Yellen’s legacy of too low interest rates for too long, The Fed is playing catch-up by finally raising rates.
As The Federal Reserve continues its assault on inflation by raising their target rate, Blackstone Inc.’s $69 billion real estate fund for wealthy individuals said it will limit redemption requests, one of the most dramatic signs of a pullback at a top profit driver for the firm and a chilling indicator for the property industry.
Blackstone Real Estate Income Trust Inc. has been facing withdrawal requests exceeding its quarterly limit, a major test for the one of the private equity firm’s most ambitious efforts to reach individual investors. The news, in a letter Thursday, sent Blackstone stock falling as much as 10%, the biggest drop since March.
You can see the problem facing commercial real estate. Since December 31, 2021, NAREIT’s all-equity REIT index has fallen -23.6% while NAREIT’s mortgage REIT index has fallen -28.6%. It looks like Blackstone’s Real Estate Income Trust has a decline coming.
If I look at NCREIF’s commercial property index, we can see that The Fed helped boost CRE values. But what will happen if and when The Fed actually shrinks its balance sheet.
I call The Fed’s attempts at cooling inflation “Fed Dead Redemption” since it resulted in redemptions from real estate funds.


You must be logged in to post a comment.