Here is where we set today. The cost of insuring for a US debt default remains elevated as the US has hit its statutory debt limit. This is happening at the effective rate of interest on US mortgage debt is rising.
Help us McCarthy! Because Biden and Schumer don’t want to cut ANY spending.
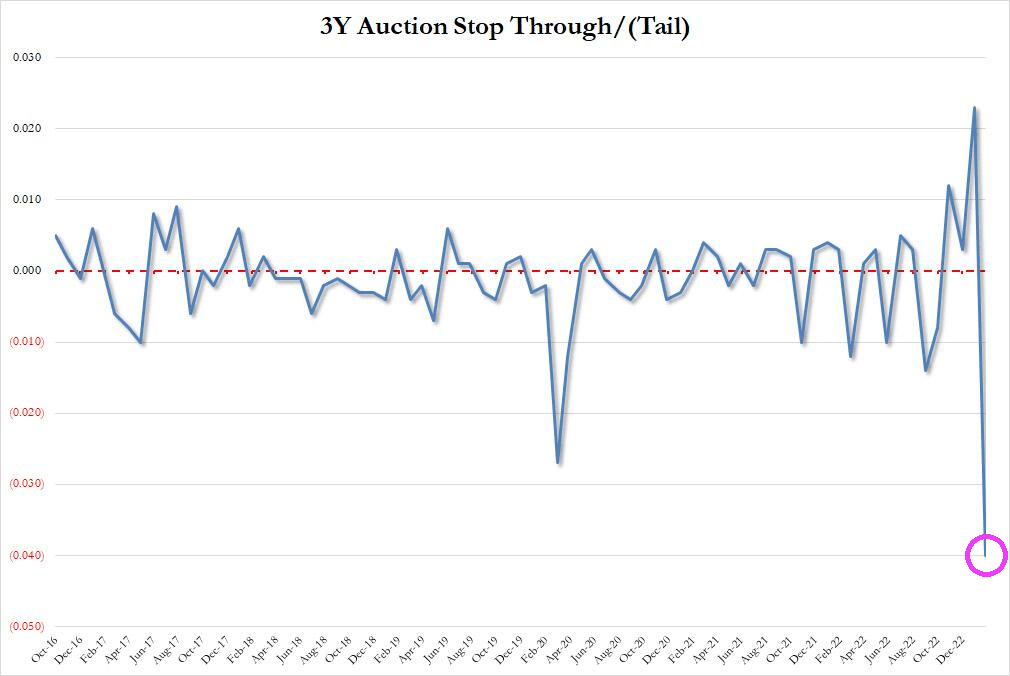
After Jerome Powell raved about the strong US labor market and oddly ignored the staggering crowding-out of US interest payments on its massive debt, the US Treasury’s 3-year debt auction was … a Hinderburg moment.
First, the high yield at today’s auction of 3-year Treasury notes was 4.073%. This occured as the allotment to brokers and dealers collapsed along with M2 Money growth YoY.
Then we have this horrible chart of the 3Y auction stop through, crashing into uncharted waters. A stop-through indicates when the highest yield the Treasury sold in the auction is below the highest yield expected when the auction began – the “when issued” level.
Today’s jobs report from the Bureau of Labor Statists (BLS) was stunning. 517k jobs added! Very strange since the ADP jobs added report on Febuary 1st was only 106k. THAT is a huge discrepancy (probably a seasonal adjustment in the BLS reporting).
Average hourly earnings rose to 4.4% YoY. Too bad headline inflation is still roaring at 6.5%. So, the inflation tax is still overwhelming wage growth.
The spread between the January jobs report (BLS) and the ADP jobs added report (ADP) is similar to the infamous jobs report that the Philly Fed “corrected” (orange circle).
Here is the summary of the BLS numbers.
And on the strange jobs report, US Treasury 10-year yields are up 10+ basis points.
Where were the jobs added? How about “Hey Bartender!” since leisure and hospitality added 128k jobs in January.
Leisure and hospitality added 128,000 jobs in January compared with an average of 89,000 jobs per month in 2022. Over the month, food services and drinking places added 99,000 jobs, while employment continued to trend up in accommodation (+15,000).
In January, employment in professional and business services rose by 82,000, led by gains in professional, scientific, and technical services (+41,000). Job growth in professional and business services averaged 63,000 per month in 2022.
Government employment increased by 74,000 in January. Employment in state government education increased by 35,000, reflecting the return of university workers after a strike.
Health care added 58,000 jobs in January. Job growth occurred in ambulatory health care services (+30,000), nursing and residential care facilities (+17,000), and hospitals (+11,000).
Employment in retail trade rose by 30,000 in January, following little net growth in 2022 (an average of +7,000 per month). In January, job gains in general merchandise retailers (+16,000) and in furniture, home furnishings, electronics, and appliance retailers (+7,000) were partially offset by a decline in health and personal care retailers (-6,000).
Construction added 25,000 jobs in January, reflecting an employment gain in specialty trade contractors (+22,000). Employment in the construction industry grew by an average of 22,000 per month in 2022.
In January, transportation and warehousing added 23,000 jobs, the same as the industry’s average monthly gain in 2022. Over the month, employment in support activities for transportation increased by 7,000.
Employment in social assistance increased by 21,000 in January, little different from the 2022 average gain of 19,000 per month.
Manufacturing employment continued to trend up in January (+19,000). In 2022, manufacturing added an average of 33,000 jobs per month.
Employment showed little change over the month in other major industries, including mining, quarrying, and oil and gas extraction; wholesale trade; information; financial activities; and other services.
The source of the jobs miracle? Changes in how jobs are measured.
Changes to The Employment Situation Data | | | | Establishment survey data have been revised as a result of the annual benchmarking | | process, the NAICS 2022 conversion, and the updating of seasonal adjustment factors. | | Also, household survey data for January 2023 reflect updated population estimates. | | See the notes at the end of this news release for more information. | |_________________________________________________________
The Federal Reserve’s Open Market Committee (FOMC) is meeting on Wednesday. What will they do?
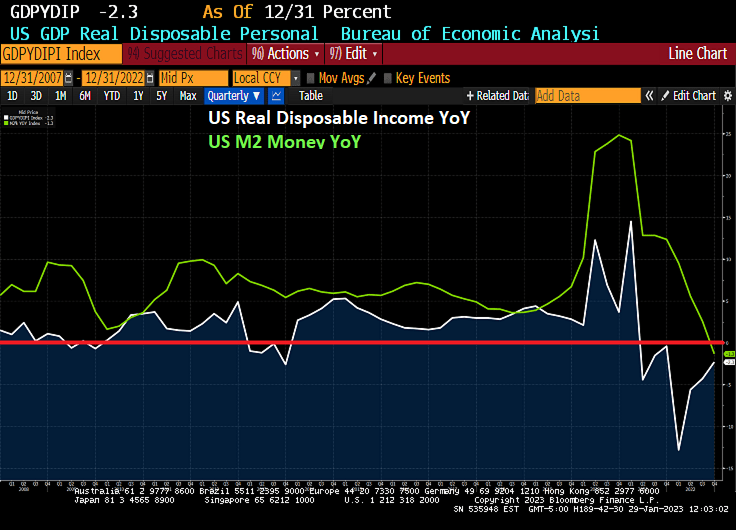
First, The Fed Funds Target (upper bound) is above the Core US inflation rate YoY. Second, M2 Money growth YoY has slowed to -1.3%.
Of course, the members of the FOMC might decide that this is not enough and may keep raising rates and shrinking The Fed’s enormous balance sheet.
In the “Haven’t they suffered enough?” arena, US real disposable income has fallen by -21% since Biden was sworn-in as President.
On the other hand, the Taylor Rule is still pointing to a target rate of 10% (we aren’t even half way there at 4.50%).
Oh and the price of insuring against a US debt default remains elevated (since Biden and Schumer are baving like arrogant bullies) and are refusing to negotitate over spending cuts.
The 1Y CDS volatility cube indicates that it will all be over soon.
The first headline I saw when I turned on Bloomberg.com was “DOJ Officials Find More Classified Documents at President Biden’s Home.” This is an improvement! So far, the task has been handled by Biden’s private attorneys who don’t have proper security clearance; at least the Justice Department is finally getting involved!
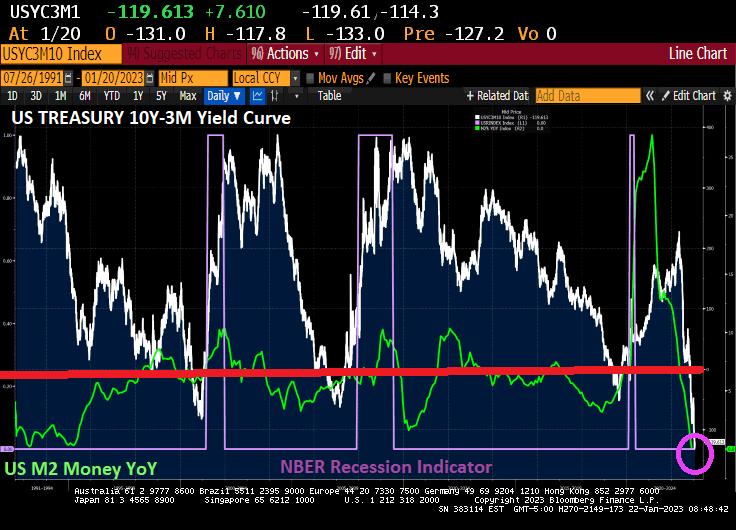
But back to the US yield curve. It is now the most inverted in 30+ years as M2 Money growth stalls. Inverted yield curves have preceded recessions in the past.
But as China reopens and Europe is experiencing a warmer winter than expected (meaning that Europe has sufficient natural gas reserves) and US inflation cooling,
we are seeing market-implied odds of a recession falling in January.
I am still betting on a recession in the second half of 2023.
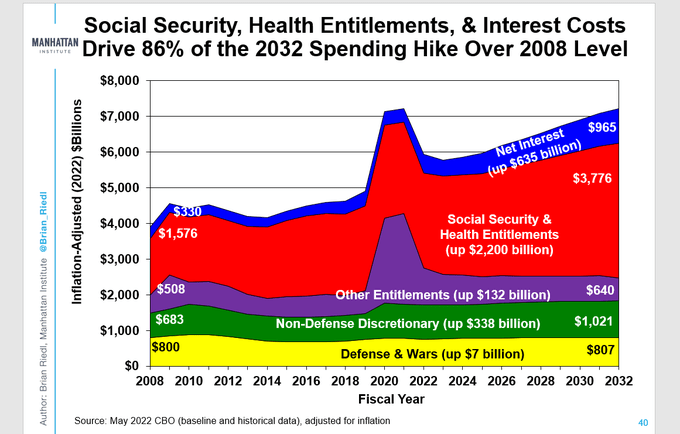
Newly-minted US House Speaker Kevin McCarthy faces a daunting task: trying to avoid a US debt default. As I have discussed many times before, nothing has been the same since the US housing bubble and near-collapse of the banking system that produced an expensive bailout of seemingly all financial institutions. After 2008, Federal spending has gone out of control. The budgetary hawks (or pigeons) in the US House of Representatives (with Pelosi, Boehner, Ryan then Pelosi again) went on Federal spending sprees of epic proportions.
The Manhattan Institute has a nice chart showing the explosion in the Federal budget since 2008. Of particular note, interest payments on the Federal debt has increased by a staggering 192%. On the non-interest spending front, Social Security and Health Entitlements have increased by 140% while Nondefense Discretionary Spending has increased 76%.
The massive increase in Federal debt interest is due to both increased Federal spending and rising interest rates thanks to The Federal Reserve raising rates to fight inflation.
But what will McCarthy and House Republicans recommend cuts in? Tighter restrictions on who qualifies for Social Security and particularly Social Security Disability payments?
The odd factoid is that Defense and Wars budget is up less than 1% from 2008 to 2032. So, Ukraine military aid is coming from somewhere, but not from the Defense budget. Is Ukraine another entitlement program?
Rest assured that after debate, the House will pass a budget and, provided that virtually nothing was cut, the Senate will gleefully agree to more spending and “Top Secret Documents” Biden will sign it.
After he parks his gorgeous Corvette Sting Ray, that is.
And with it, ISM Manufacturing Report for December is showing weakness. New orders (orange line) is down to 45.2 (below 50 is contraction) and the prices paid is down to 39.4 (white line). All this is happening as The Fed raises its target rate (yellow line) and removes monetary stimulus (green line).
This gives us “The Devil’s Tower” looking economic spike after massive Covid-related monetary stimulus and Federal government repeated stimulus.
Speaking of Already Gone, look at the US Treasury 10Y-2Y yield curve with slowing M2 Money growth. Yield curve inversion is more about vanishing M2 Money growth than it is a forecast of recession.
Today is all quiet of the financial market front since the US stock
Today is all quiet of the financial market front since the US stock and bond markets are closed. But as the new year starts, we have to ask the following question: is the US already in a recession?
A simple measure of IMPENDING recession is the US yield curve which is currently inverted. Typically, a recession occurs within months of the yield curve inverting. But if we look at real GDP growth, the Atlanta Fed GDP tracker is at 3.7%, so no recession there (two consecutive quarters of negative GDP growth is often used as a measure of recession).
But another indicator of “all is not well” is the CBOE Put/Call Ratio. Typically, the Put/Call Ratio spikes during a recession. But on December 28, 2022, the Put/Call Ratio spiked to its highest level since 1996. Although it has calmed down to 0.84 on December 30, 2022. Suffice it to say that there is enormous uncertainty in markets.
Covid begat massive Fed monetary stimulus and an excuse for the Federal government to go on a series of spending sprees (Covid “relief”, Instrastructure, Inflation Reduction, and now the $1.7 Trillion pork-laden Omnibus bill). Now that historic big spender Nancy Pelosi (CA-D) is no longer Speaker, will her successor have such a voracious spending appetite? The US economy is still benefitting from Covid-related stimulus which also helped generate 40-year highs in inflation.
Thanks to inflation, US workers have had 20 consecutive months of negative wage growth. But as M2 Money growth slows to a halt, so will real average hourly earnings.
The traditional measures of recession (unemployment and Real GDP growth) are NOT pointing to recession, but 20 straight months of negative wage growth points to bad news for workers. Throw in an inverted yield curve and massive volatility in the CBOE Put-Call Ratio and we have a party … that I don’t want to attend.
2022 is one of the record books and not in a Tiger Woods way. Call it a year of pain.
First, the US enacted policies that drove up energy prices (goin’ green) that reverberated through the entire economy in the form of higher prices. Second, The Federal Reserve, in attempt to combat runaway inflation, started removing the excessive monetary stimulus that had been around since Fed Chair Bernanke initiated QE, the seemingly unlimited purchase of Treasury and Agency MBS securities. Janet Yellen continued the massive asset purchases and zero interest rate policies or ZIRP. Now that inflation has struck the American middle class hard, we are seeing Fed Chair Powell doing what Bernanke and Yellen wouldn’t do — remove the monetary punchbowl.
Using Robert Shiller’s on line data, US stocks and bonds have had an awful year, the worst combined year since 1871.
US equity returns have been demolished under the NEW dual mandate (goin’ green = rising prices = Fed tightening).
Let’s see how two of the most famous investment gurus did in 2022, Warren Buffet and Cathie Wood. Buffet’s Bershire Hathaway Class A equity was UP 4% in 2022, while Cathie Wood’s ARK Innovation ETF collapsed by -67% in 2022.
Here is the clinker. The US economy (as well as the global economy) seem dependent on “cheap money” from Central Banks like The Federal Reserve. So the question is … will The Fed pivot? Fed talking heads are saying no, but Fed Funds investors are saying yes to a pivot after June 2023.
Ulysses S Grant was the President the last time the combined stock and bond market was this bad.
The market began downshifting earlier this year as the Federal Reserve started hiking its benchmark interest rate, with the goal of easing high inflation that’s been driven in part by skyrocketing housing costs.
Rates for 30-year, fixed mortgages reached 7.08% in October — and again in November — though they have since retreated, Freddie Mac data show. With borrowing costs roughly double where they were at the start of the year, and inflation leaving less savings to put toward a down payment, homebuyers have pulled back. Sellers are also reluctant to list their properties, yet houses that are on the market are lingering and getting discounted as demand slumps.
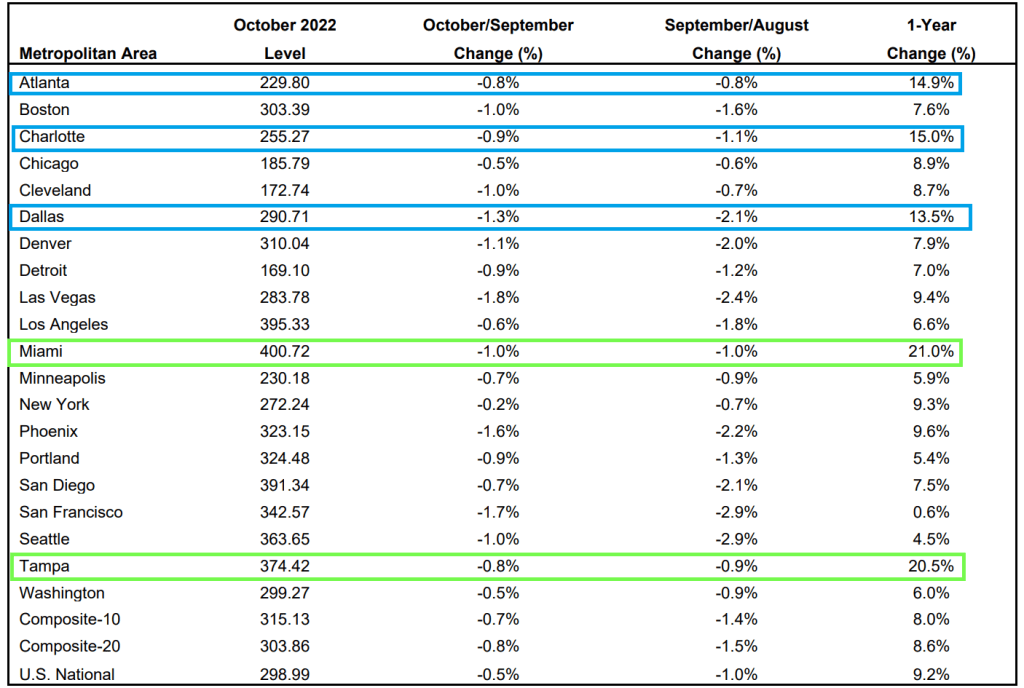
The Case-Shiller National Home Price Index “cooled” to 9.24% YoY growth as The Federal Reserve tightens its monetary noose.
Of the top twenty metro areas, both Miami and Tampa Florida were up over 20% YoY. Hot ‘Lanta, Charlotte and Dallas were over 10% YoY. Mordor on the Potomac was up “only” 6% and all other metro areas were under 10%.
But if we look at October/September changes, all metro areas are down (MoM) with San Francisco the worst.
Finally, The Federal Reserve’s massive balance sheet is still out in force.
Look at this chart of the Case-Shiller National home price index again The Fed’s balance sheet. Uh-oh.
Let’s look at San Francisco (my hometown) since The Federal Reserve began interest rate tightening.


You must be logged in to post a comment.