This is a time even unlike the disastrous housing bubble of the 2000s that led to the financial crisis and Great Recession. Even during the housing bubble years, we still had positive REAL mortgage rates: Bankrate 30Y Fixed rate – CPI YoY. But today we have even FASTER REAL home price growth and NEGATIVE mortgage rates!
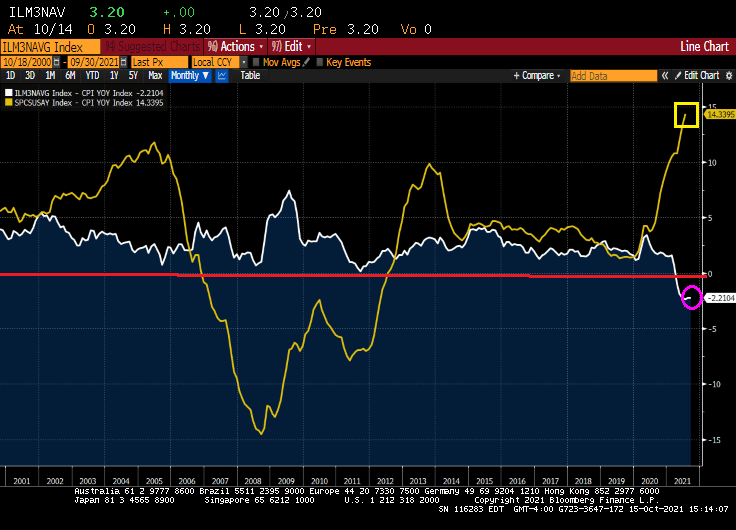
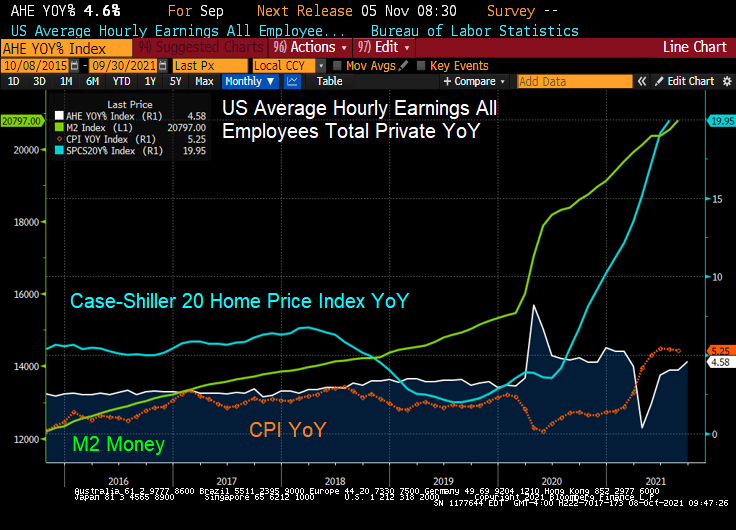
And yes, REAL home price growth is 14.34% YoY while REAL hourly earnings growth is -0.79%.
The University of Michigan consumer survey came out today and buying conditions for housing improved to 75. Which means that more people were negative than positive due to skyrocketing home prices.
With negative 30Y mortgage rates and rising apartment rents, is it time to buy? Just remember what happened to Leon in Blade Runner.
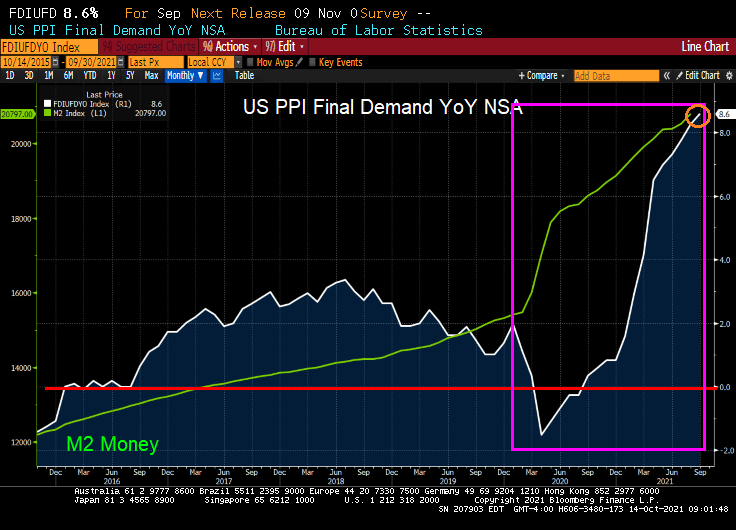
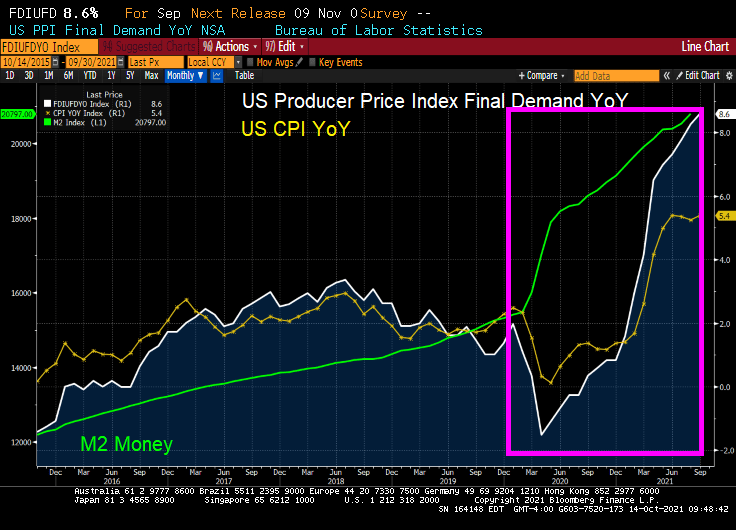
The US Producer Price index (Final Demand) rose to a blistering rate of 8.6% YoY.
Will this translate to higher consumer prices? Of course it will.
When The Fed or the Biden Administration says that inflation is transitory and will be fixed once we unclog the shipping pipes, remember this warning from the UN that global warming will wipe out entire nations if not reversed by 2000. So, it is too late! I am buying a gas-guzzling Cadillac Escalade with a monster V-8 engine!! (Not really, I am more of a Ford kind of person).
Everyone seems worried about it. Bridgewater Associates co-Chief Investment Officer Greg Jensen says spiraling prices that choke off growth are a “real risk” that many portfolios are massively overexposed to. A “fairly strong consensus” of market professionals believe that some kind of stagflation is more likely than not, according to a Deutsche Bank AG survey. And while Goldman Sachs Group Inc. urged investors to buy the dip, strategists said “stagflation” was the most common topic in client conversations.
Wherever you fall on the debate, alarm bells are ringing as energy prices head toward multiyear highs and persistent shortages crimp supply chains worldwide. That’s fueling price pressures and pushing up bond yields just as economic growth is cooling and central banks such as the Federal Reserve weigh scaling down pandemic-era stimulus. And after a second straight month of disappointing U.S. jobs gains, the stakes are rising heading into this week’s inflation report.
“The reality that inflation is more persistent and sustainable than the ‘transitory’ camp thought, and that inflation and its causes are in turn slowing economy growth,” said Peter Boockvar, chief investment officer for Bleakley Advisory Group.
Energy Epicenter
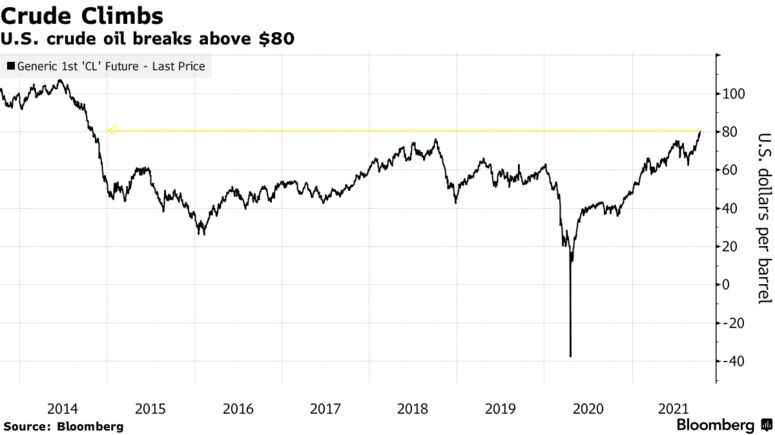
Much of the stress is emanating from the energy market, where West Texas Intermediate crude oil broke above $82 per barrel for the first time since 2014 on Monday amid a power crisis from Europe to Asia. Prices of coal and natural gas have also jumped, with demand ahead of winter whittling worldwide stockpiles.
The commodity surge has thrust stagflation fears front-and-center in markets, given that higher energy prices have the potential to pinch consumers, according to Principal Global Investors. Gains in consumer spending are already expected to slow, leading Goldman economists to slash U.S. growth estimates over the weekend.
“The idea was already starting to take shape. The increase in commodity prices has just formalized those fears,” said Seema Shah, Principal’s chief global strategist. “While there have been complaints around higher food prices, higher lumber prices, higher clothes prices, it’s the increase in household bills that has really put fear into peoples’ minds, because it is so visible and rising gas prices are difficult to substitute away from for an average household.”
Murky Bond Picture
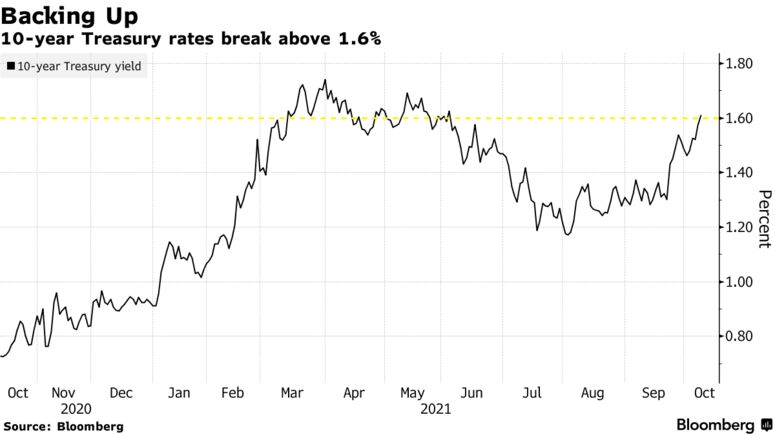
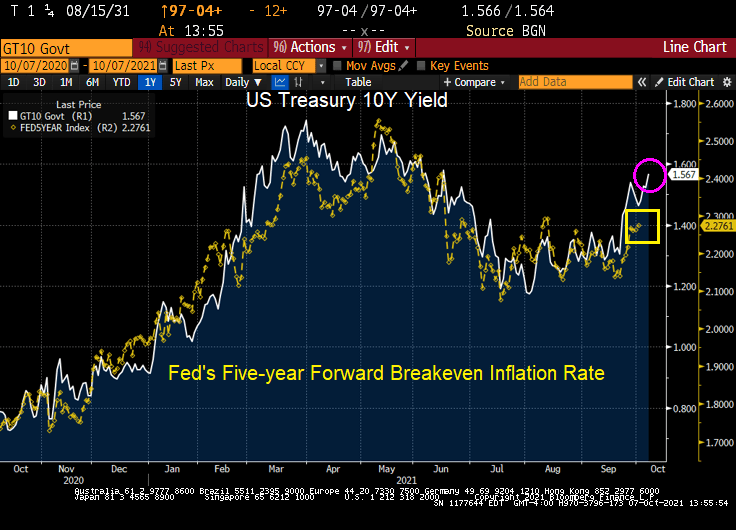
Sky-high commodity prices have filtered through to the Treasury market, where yields on benchmark 10-year notes broke above 1.6% for the first time since June last week. Driving the gain is an increase in breakeven inflation rates, while so-called real yields — often viewed as a proxy of growth expectations — have retreated so far this month.
“If we look at the composition within the TIPs market, we see an increase in breakevens to the detriment of real yields,” BMO strategist Ian Lyngen said on the firm’s “Macro Horizons” podcast. “We read this as the market’s focus on longer-term inflation has taken some of the optimism out of the growth profile going forward.”
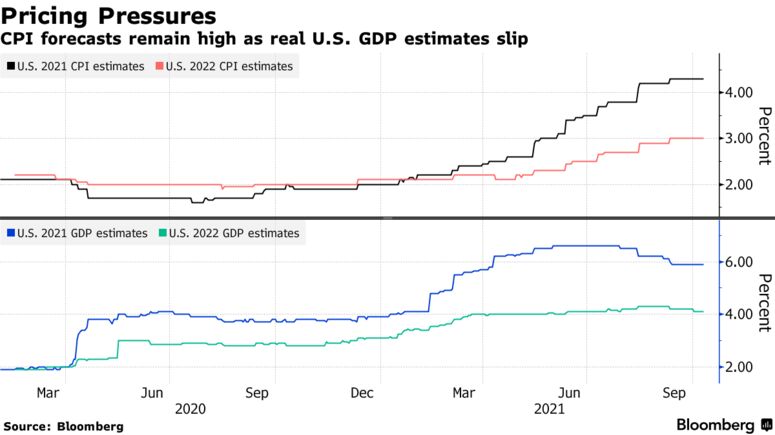
Morgan Stanley strategist Andrew Sheets disagrees. Breakeven rates are still below their May peaks, while the cross-asset landscape is distinct from the stagflationary setup of the 1970s, he argued. Data compiled by Bloomberg shows gross domestic product is forecast by economists to rise 5.9% this year, 4.1% next year and 2.4% in 2023.
“Asset pricing also couldn’t be more different. Over the last century, the 1970s represented an all-time high for nominal interest rates and an all-time low for equity valuations,” Sheets wrote in a note Sunday. “Today we’re near a low in yields and a high in those valuations.”
Stocks Still Serene
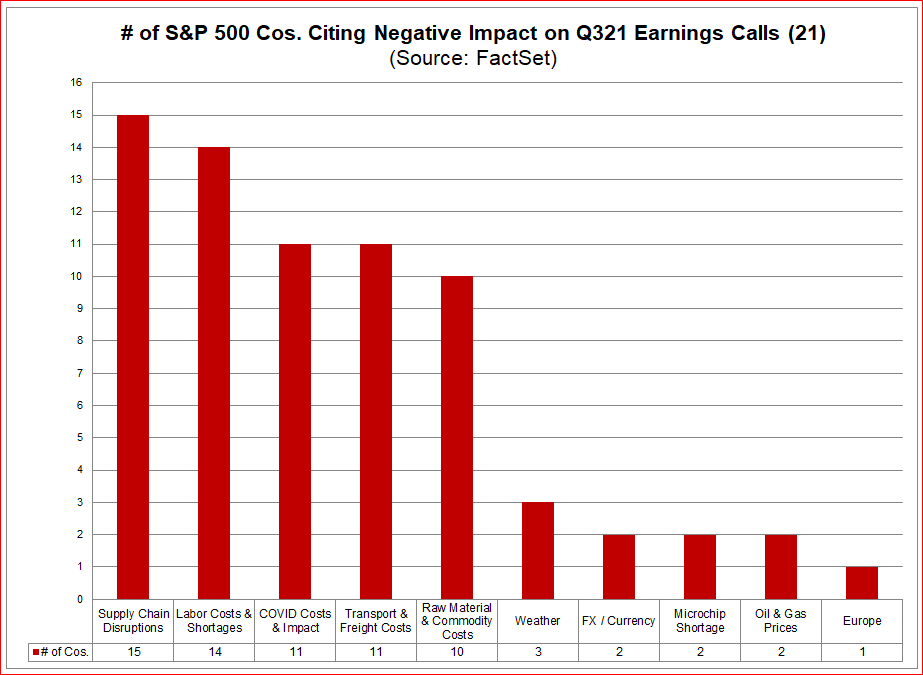
Equity investors so far seem unperturbed. That’s the view of Matt Maley, chief market strategist for Miller Tabak + Co., given that the S&P 500 is just 3.9% lower from its all-time high. However, the mood music could change as the third-quarter reporting season kicks off and corporate executives sound off on supply chain issues and rising input costs, he said.
“The key should be this earnings season,” Maley said. “If a lot of companies start talking about margin pressures, the stock market will start pricing in stagflation rather quickly.”
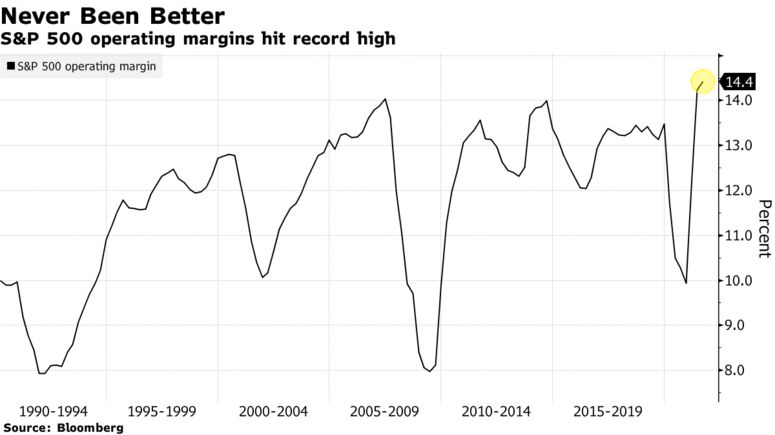
So far, balance sheets have been resilient. Operating margins for the S&P 500 clocked in at 14.4% last quarter, a record high, with companies in many cases actually benefiting from the inflation uptick.
But should stagflation fears start to meaningfully rattle equity markets, shares of companies with higher pricing power — the ability to pass on costs — should profit, according to Goldman, after several weeks of underperformance.
“Stocks with strong pricing power have recently lagged but appear attractive if stagflationary concerns continue to build,” strategists led by David J. Kostin wrote. “If inflation remains high alongside a weakening economic growth outlook, firms with strong pricing power should be best positioned to maintain profit margins despite slowing revenue growth and rising input costs.”
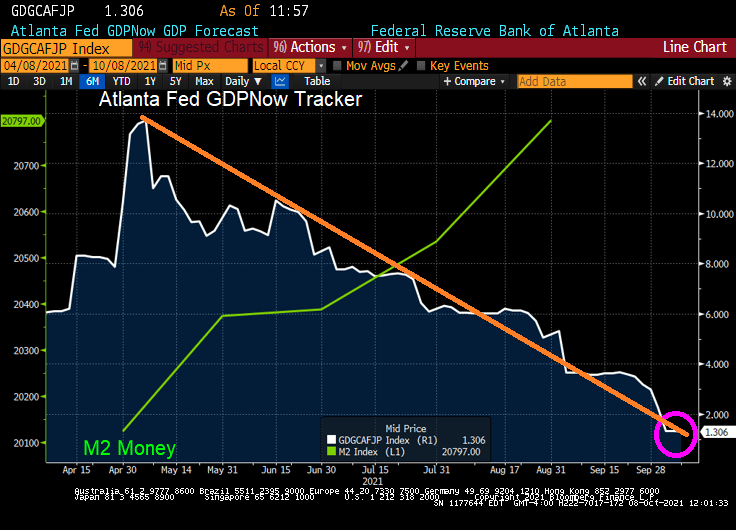
Not to mention real-time GDP of 1.3%. And falling!
Of course, there will be cries in Washington DC to spend trillions … and trillions … and trillions.
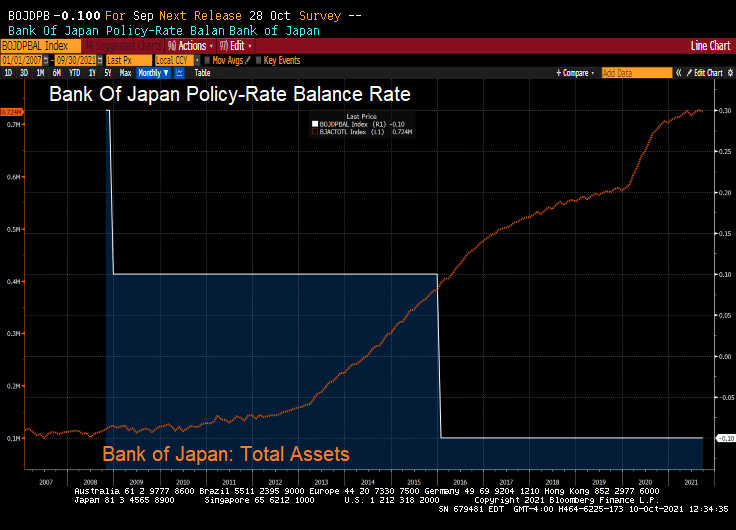
What’s left of it is that the BoJ (and Bank of Japan Governor Haruhiko Kuroda) now holds about half of the huge pile of the central government’s debt. With their target rate at -0.10% and a gargantuan balance sheet, what could go wrong?
But BOJ’s QE has ended. The BoJ’s overall assets stopped growing, and its holdings of government bonds have started to decline.
As of the BoJ’s balance sheet dated September 30, released on Thursday, total assets declined to a still monstrous ¥724 trillion ($6.4 trillion), below where it had been in May 2021.
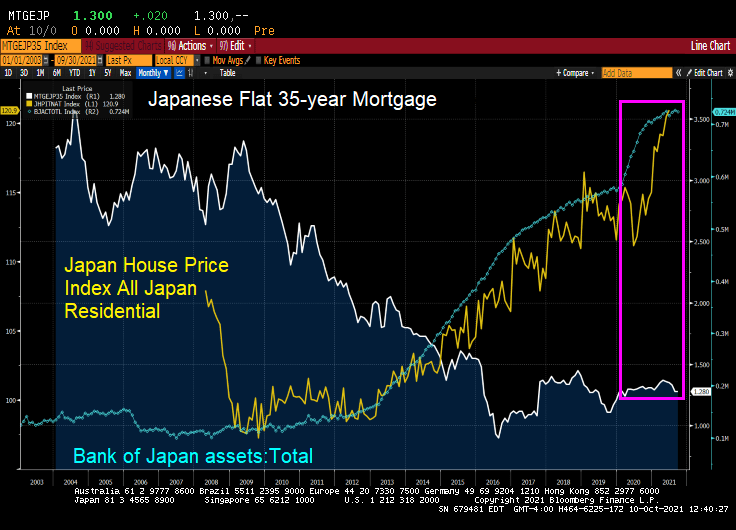
But look at Japanese home prices with the growth of the BOJ’s balance sheet and general decline in mortgage rates. Like the USA, there was a balance sheet spike associated with Covid and a resulting spike in home prices.
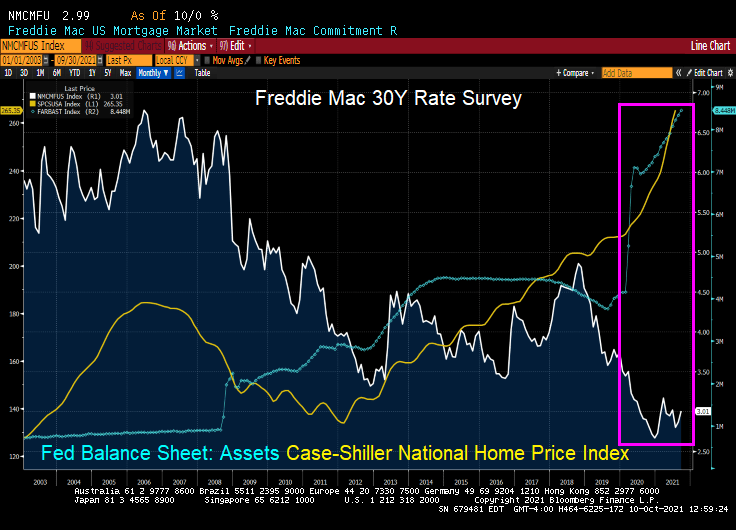
The USA? We also saw a surge in home prices following The Fed’s monetary “stimulypto.”
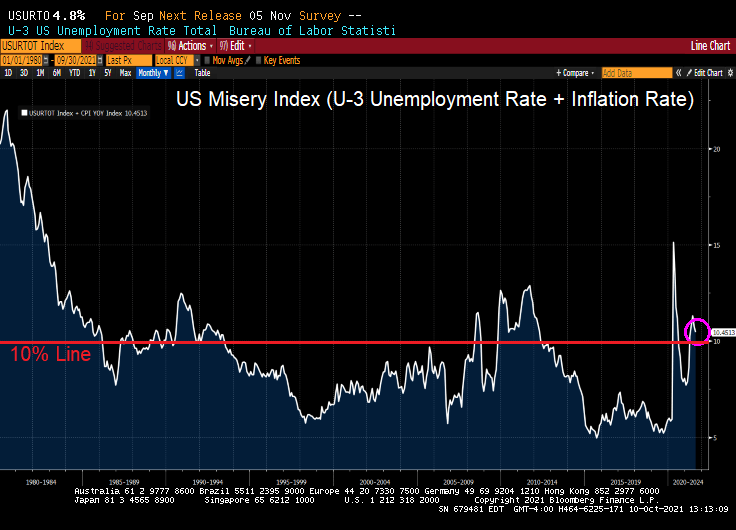
Bear in my that the US Misery Index is above 10% (U-3 unemployment + inflation).
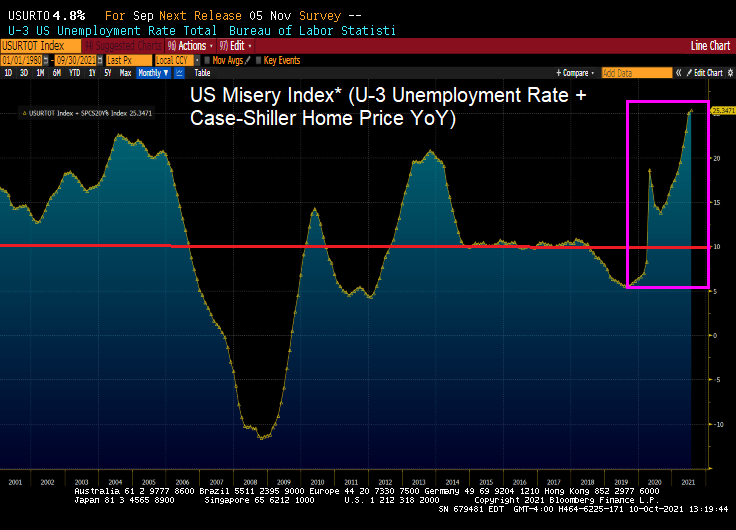
And if I define the US Misery Index as U-3 unemployment + home price growth, we can see we are at record misery rates. Miserable for households that don’t own a home or are trying to move to a higher housing price area).
Like the poem, Casey At The Bat, the US economy struck out with a shockingly bad jobs report for September.
Oh, somewhere in this favored land the sun is shining bright; The band is playing somewhere, and somewhere hearts are light, And somewhere men are laughing, and somewhere children shout; But there is no joy in Mudville USA—mighty Casey Biden has struck out.
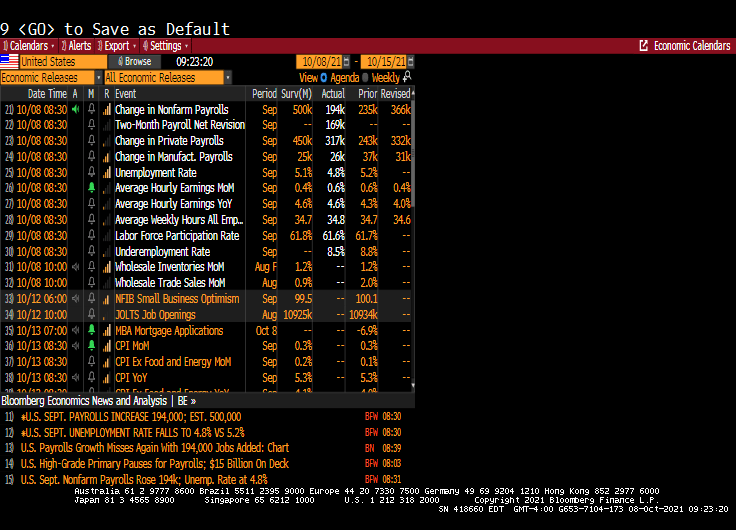
The U.S. economy added fewer jobs than forecast for a second straight month in September. Nonfarm payrolls increased by just 194,000 last month after an upwardly revised 366,000 gain in August, Labor Department figures showed Friday. 500K was expected.
The U-3 unemployment rate declined to 4.8% (meaning that the labor force shrank due to people dropping out of the labor force). In fact, 338,000 people dropped out of the labor force.
Average hourly earnings YoY rose to 4.6%. While that is an improvement, but it is lower than the inflation rate of 5.25% YoY and house price inflation of 20% YoY.
This miserable jobs report is a victory for Fed doves that don’t want to raise rates or slow down the balance sheet growth.
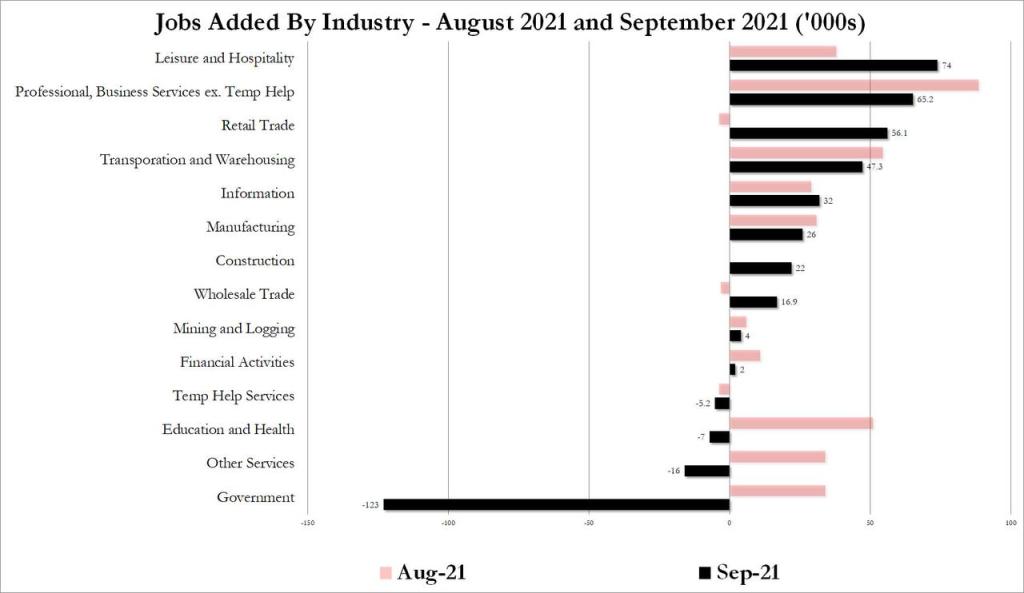
Where were the jobs created? Leisure and hospitality, as usual, leads in job gains.
It was great to be a “Master of the Universe” (Treasury and MBS trader) since October 1981 when the US 10Y Treasury yield peaked at 15.84% and mortgage rates peaked at 18.63%. Treasury and mortgage rates have generally fallen ever since. But what happens if Treasury and mortgage rates rise?
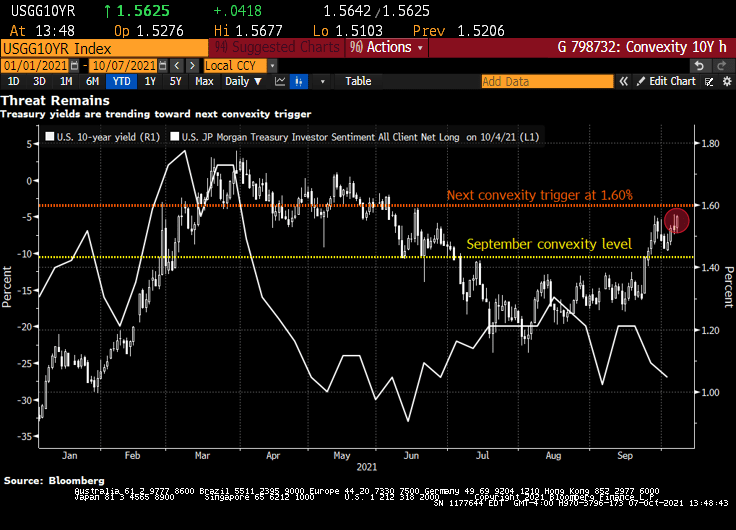
Bond investors are piling back into short positions, motivated not only by the specter of inflation but also by the risk that yields are approaching levels that will unleash a wave of new selling by convexity hedgers.
That level is around 1.60% in the U.S. 10-year Treasury yield, less than 10 basis points from its current mark, according to Brean Capital’s head of fixed income strategy, Scott Buchta. It’s the mid-point of “a key threshold” between 1.40% to 1.80%, an area “most critical from a convexity hedging point of view.”
Convexity hedging involves shedding U.S. interest-rate risk to protect the value of mortgage-backed securities as yields rise, slowing expected prepayment rates.
It’s already begun to pick up as yields stretched past the 1.40% level. Another wave is expected at around 1.6% — a point of “maximum negative convexity” in agency MBS, “where 25bp rallies and sell-offs should have an equal effect on convexity-related buying and selling,” Buchta says.
Signs that short positions are accumulating include Societe Generale’s “Trend Indicator.” Among its 10 newest trades are short positions in Japanese 10-year debt, German 5-year debt futures, U.K. 10-year gilts, U.K. short sterling and U.S. 2- and 5-year notes. Meanwhile, CFTC positioning data for U.S. Treasury futures show asset managers flipped to net short in 10-year note contracts in the process of dumping the equivalent of $23 million per basis point of cash Treasuries over the past week. Hedge-fund shorts also remain elevated in the long-end of the curve, as measured by net positions in Bond and Ultra Bond futures.
“Bond-bearish impulses remain in place,” says Citigroup Inc. strategist Bill O’Donnell in a note, citing tactical and medium-term set-ups. Traders should be aware of short-covering rallies in the meantime, however, he says.
“Potentially extreme short-term positioning and sentiment set-ups could easily allow for a counter-trend correction under the right conditions,” he said.
U.S. 10-year yields topped at 1.57% this week, the cheapest level since June, spurring the breakeven inflation rate for 10-year TIPS to 2.51%, the highest since May. Friday’s September jobs report could add fuel to this inflationary fire, rewarding bond shorts.
Here is a chart of the rising 10Y Treasury yield against The Fed’s 5Y forward breakeven rate.
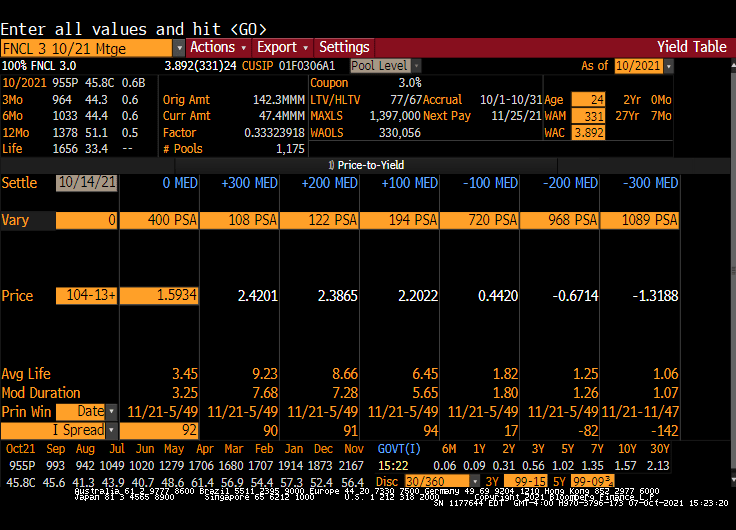
Here is a Fannie Mae 3% coupon MBS. Note the rise in Modified Duration with an increase in interest rates.
Initial jobless claims dropped below their recent range last week, falling to the second lowest level since the COVID-lockdowns crushed the economy. Only 326k Americans filed for jobless benefits for the first time last week, down from 364k last week and below the 348k expectation.
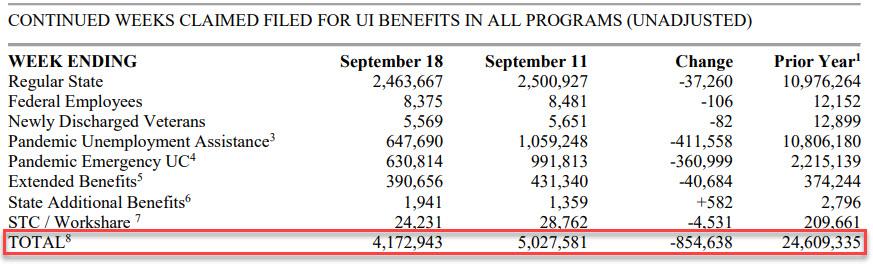
Continuing claims also declined from the previous week, again largely from Pandemic Unemployment Assistance and Pandemic Emergency Claims programs ending.
On a related note, Challenger job cuts were down -84.9% YoY. But for September, there was a surge in low-paying retail jobs and transportation jobs as Panademic stimulus ran out and governments have pretty much stopped their destructive government shutdowns of economies.
Well, Janet, we are headed there anyway with GDP crashing to a measly 1.33%.
The fear of not approving a debt ceiling increase (laughable since Democrats can do it on their own) has caused there to be a “little dipper” in the US Treasury actives curve. Meaning that the 1-month T-bill yield is higher than the 1-year T-bill yield.
The culprits? Declining auto sales, manufacturing, etc.
I have discussed soaring prices since Biden’s election (food, energy, housing, rent, etc). But another soaring price component is shipping costs. Up 315% since mid-February.
While Trump’s slogan was “Make American Great Again”, Biden and The Fed’s slogan should be “Make America Far More Expensive For The Middle Class.” But that won’t fit on a bumper sticker.
Can you say “All the king’s horses and all the king’s men ..” Or “All The Fed’s stimulus and all of Biden’s jobs bills ..”
Yes, the Atlanta Fed’s GDPNow Q3 tracker slumped to 2.3% despite the massive stimulus coming from The Federal Reserve and the Biden Administration. Down from 13.7% GDP growth as of 5/5/2021.


You must be logged in to post a comment.