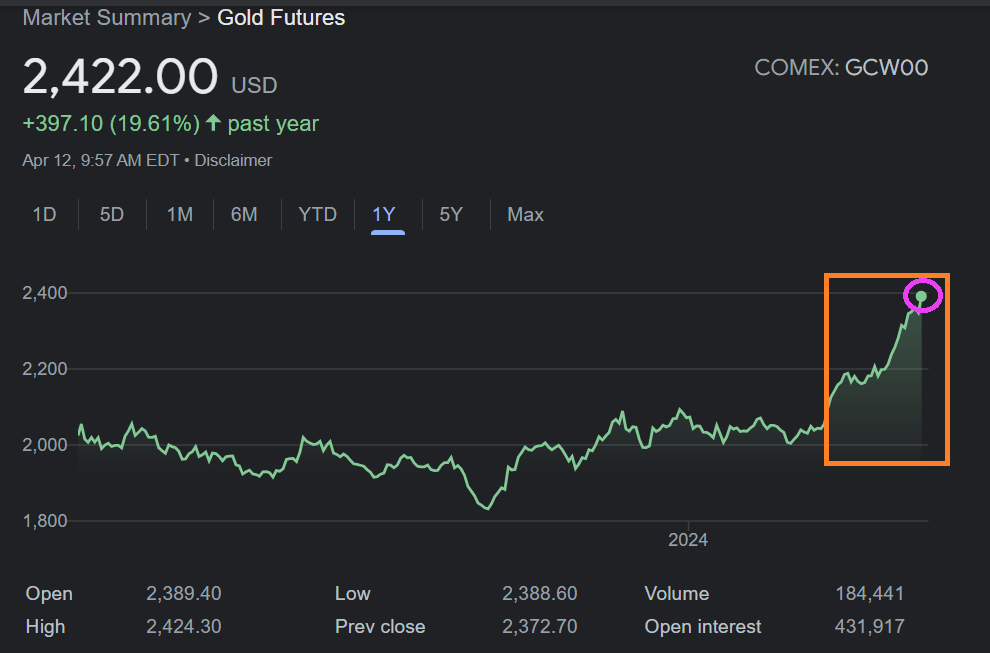
Gold futures prices are soaring and are at $2,422.00. Gold futures prices are up 19.61% over the past year.
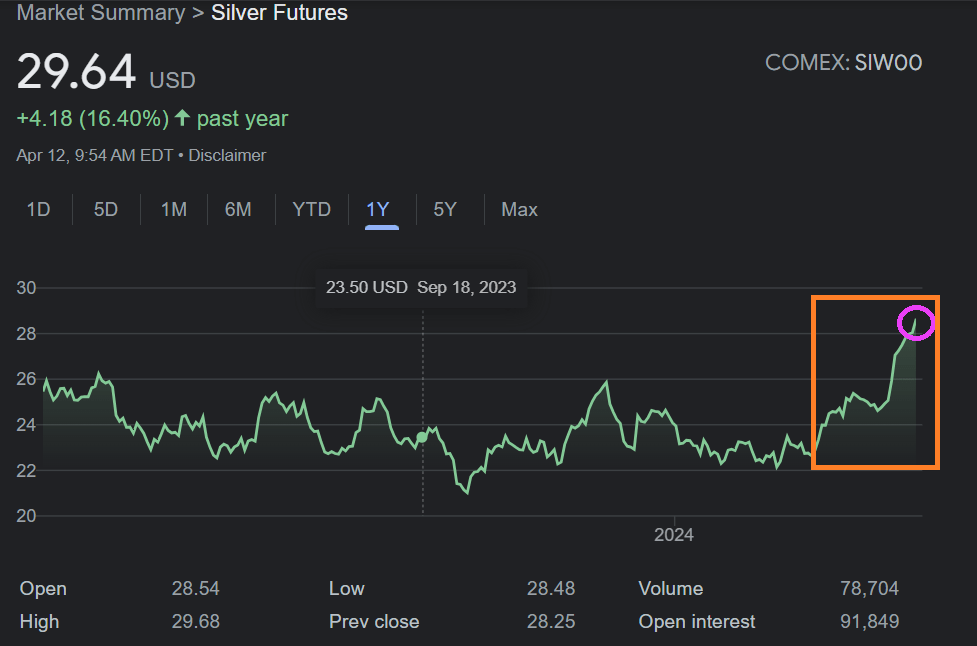
Silver futures prices are also soaring and are at $29.64. Silver futures prices are up 16.40% over the past year.
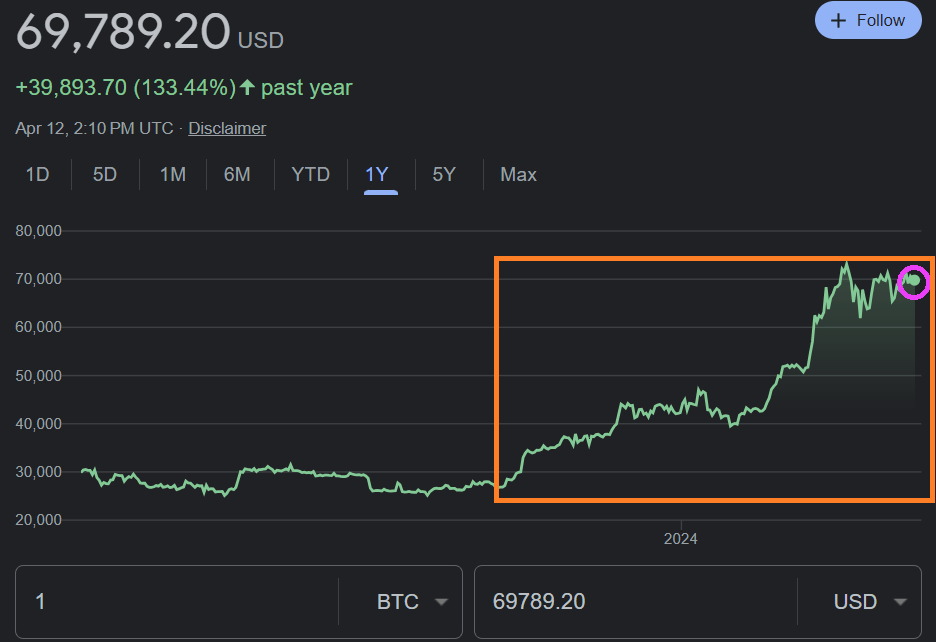
Bitcoin is almost at $70,000 and is up 133.44% over the past year.
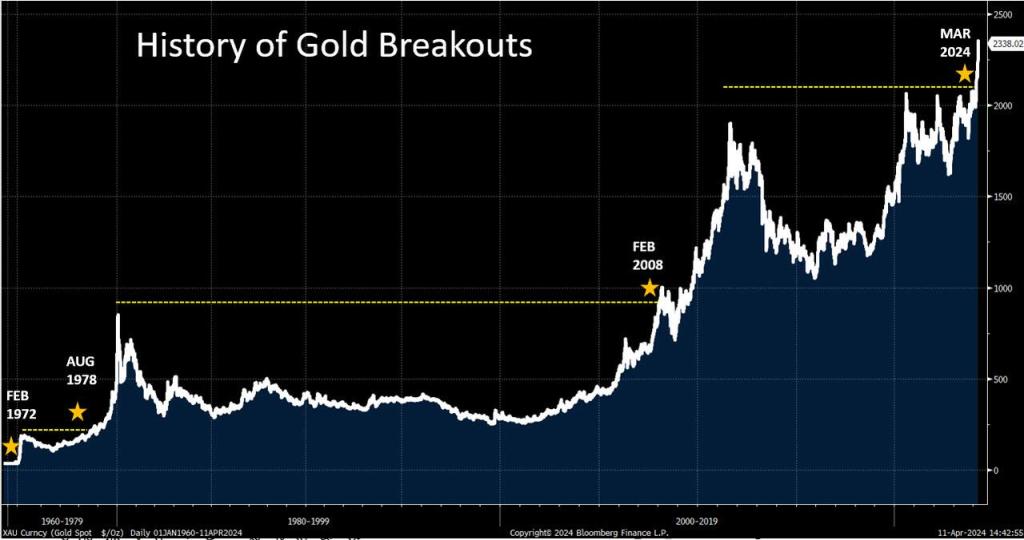
Returning to gold, we are seeing another gold breakout, like the breakout in 2008.
Even central banks are loading up on gold, silver, and cryptos. Why? Primarily fear of US reckless budgets and exploding debts/deficits (don’t listen to Biden talk about how “he” reduced deficits and debt (both have risen to dangerous levels under he inattentive eyes).
However, calming the jangled nerves of pension funds is that the S&P 500 stock market index is up 26.04% over the past year.
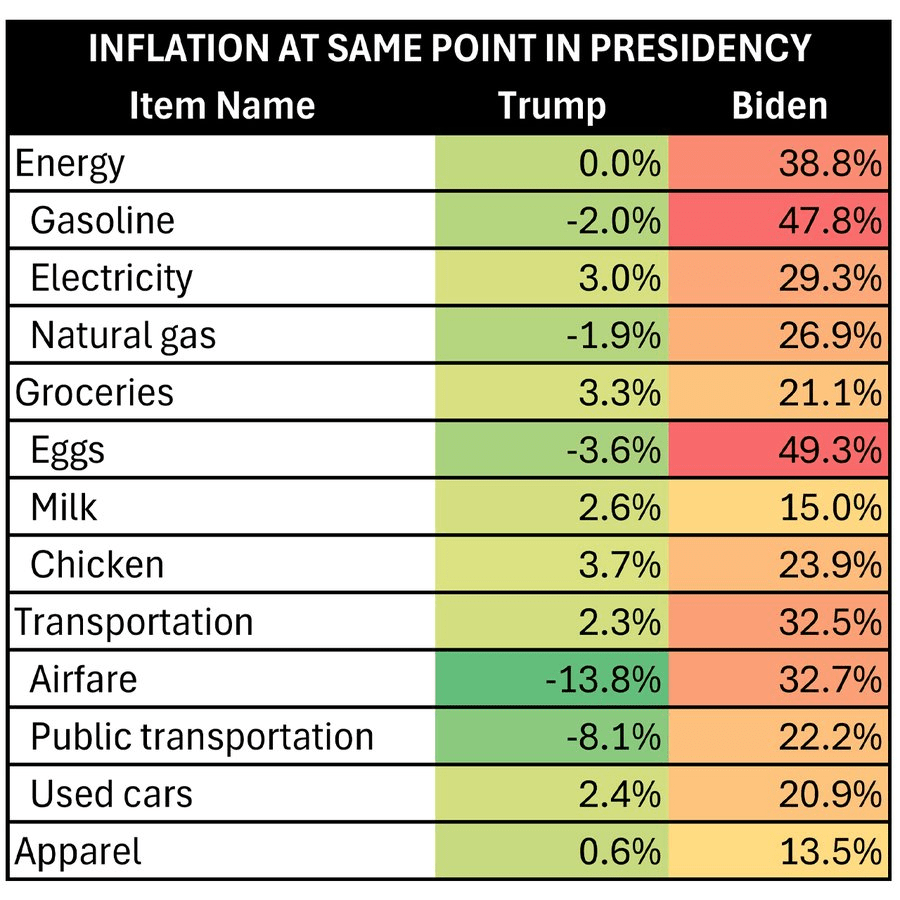
Overall prices are up by 19.4% since Biden took office.
Of course, the S&P 500 is not sustainable given that it has been driven by excessive spending by the Biden Adminstration coupled with still massive monetary stimulus from The Federal Reserve.
In summary, gold, silver and cryptos are rising on FEAR! Of Biden, Congress and The Fed.
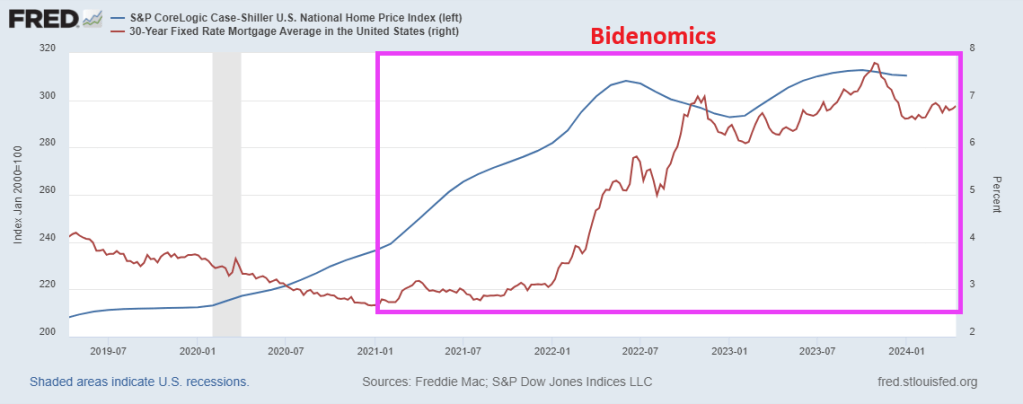
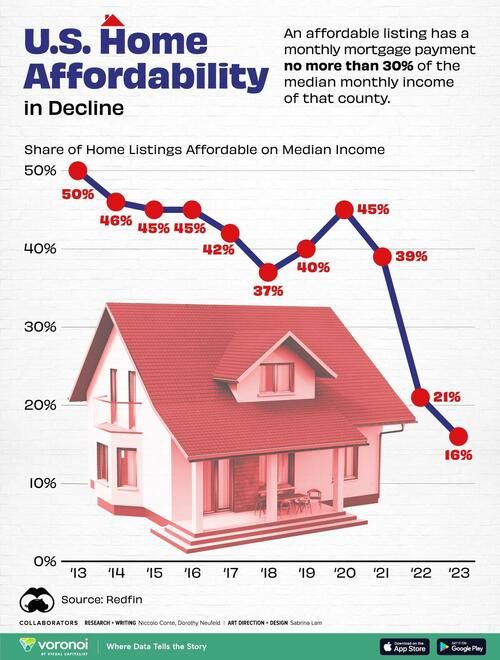
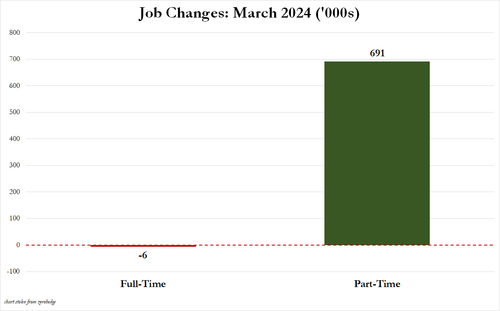
One reason that America’s youth is disgusted with Bidenomics is skyrocketing prices, particulalry housing. (simply unaffordable). Thanks to awful economic policies, home prices are up 32.5% under Biden and 30-year mortgage rates are up a whopping 160%! Good luck buying a home with a part-time job.
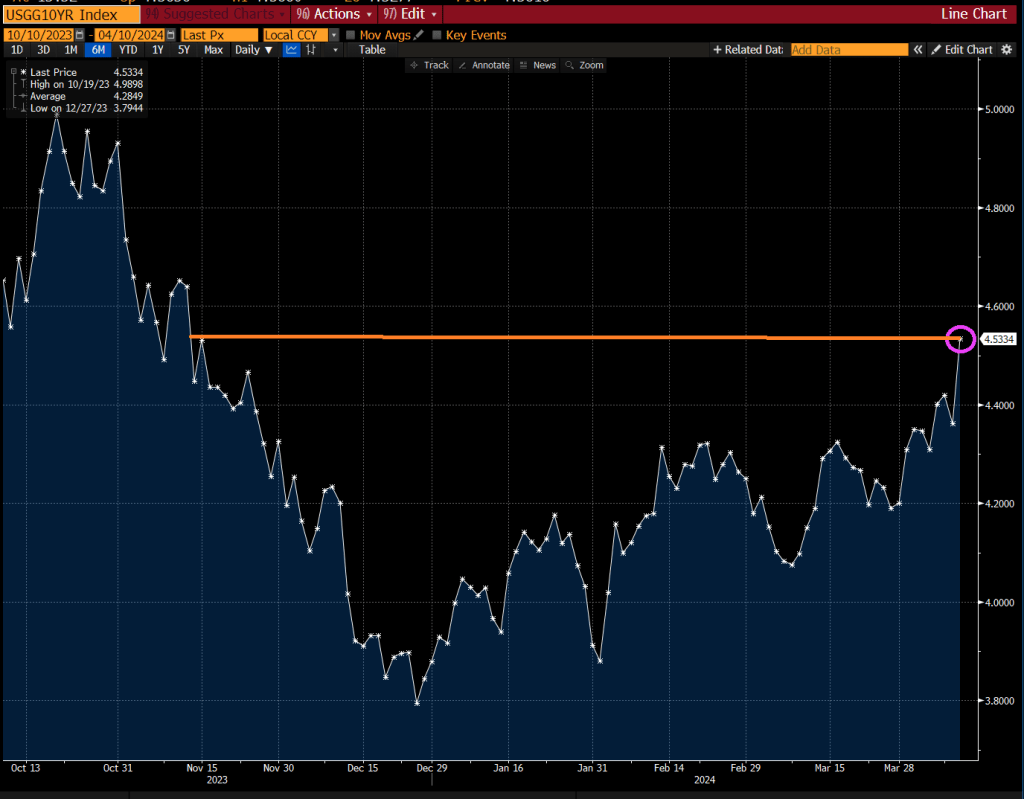
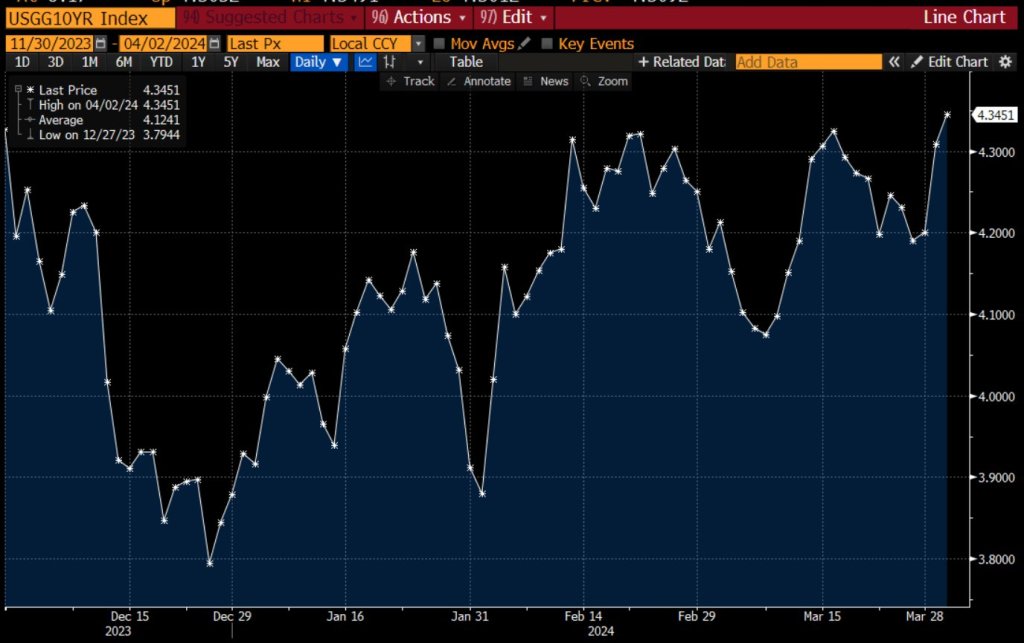
The bad news is that the 10-year Treasury yield rose to 4.53%, the highest since November 2023. This means that mortgage rates will rise even further.
Yes, rising rates AND home prices are daunting to part-time job holders.
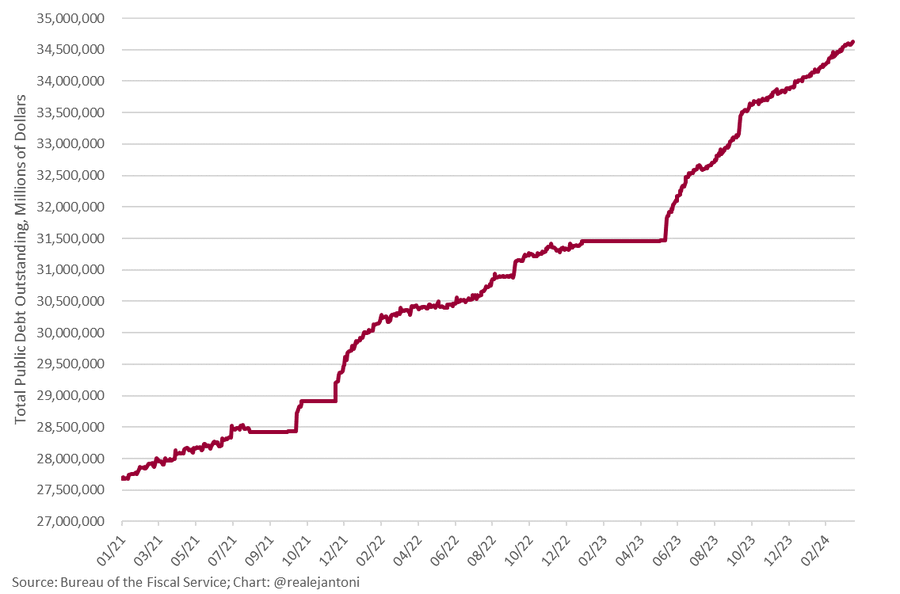
Under Biden’s “Reign of Error”, the interest on US debt just hit a record $1.1 trillion and the US deficit for just the first six months of fiscal 2024 is also $1.1 trillion.
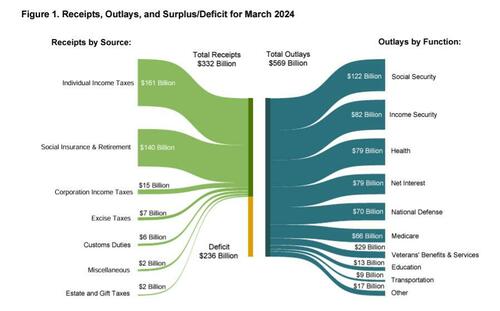
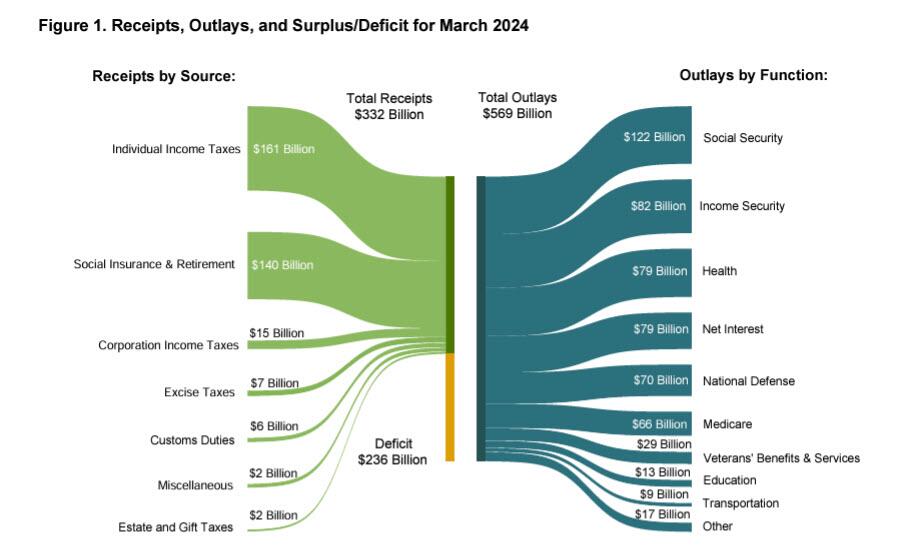
According to the latest Treasury Monthly Statement, in March the US deficit hit $236 billion, some $40 billion more than the $196 billion expected, if below February’s $296 billion…
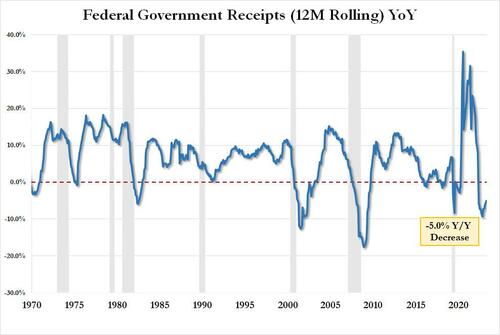
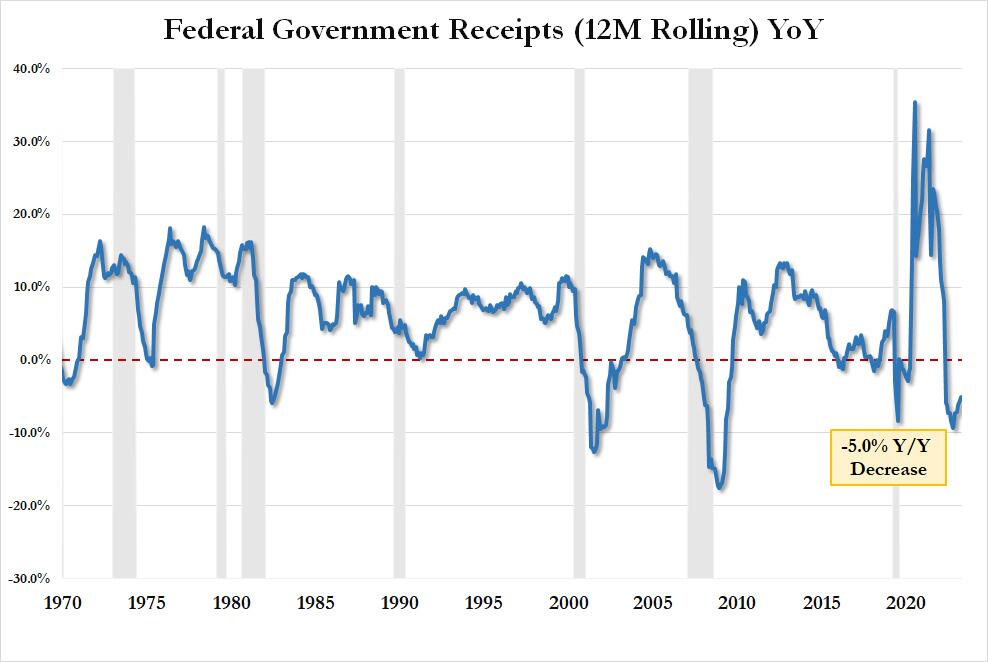
… which was the result of $332 billion in govt tax receipts – translating into $4.580 trillion in LTM tax receipts, and which was down 5% compared to a year ago…
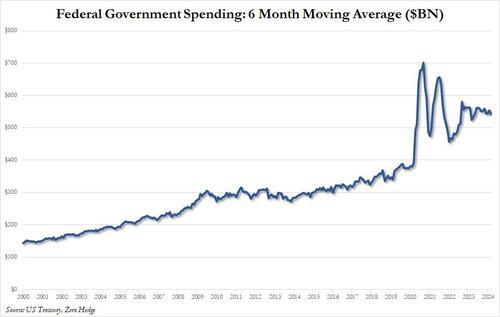
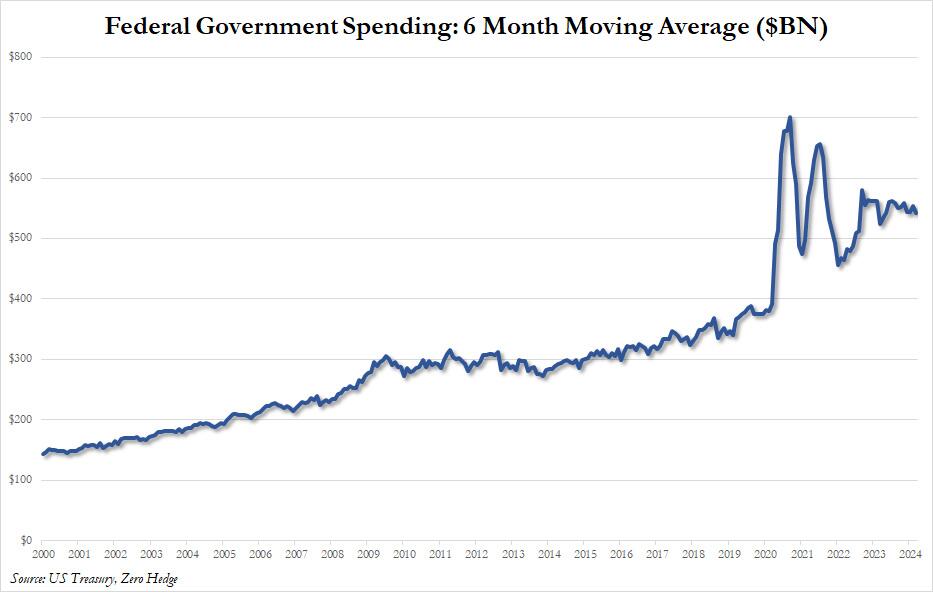
… offset by the now traditional ridiculous monthly outlays, which in March amounted to $568 billion, up from $567 billion in February and the highest monthly spending total in calendar 2024, which translated into a 6 month moving spending average (for smoothing purposes) of $542 billion. Take a wild guess what will happen to the chart below during and after the next recession.
This, incidentally, is a reminder that the US does not have a tax collection problem – it has a spending problem, and no amount of tax changes will fix it; in fact all higher taxes will do is force more billionaires to move to Dubai where they pay zero taxes.
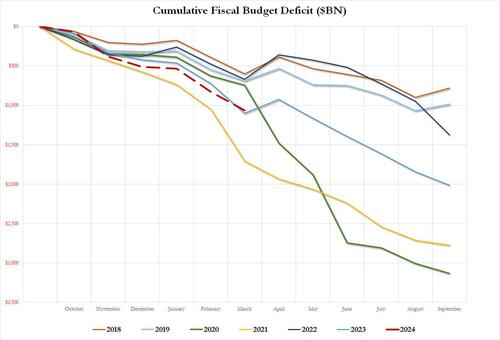
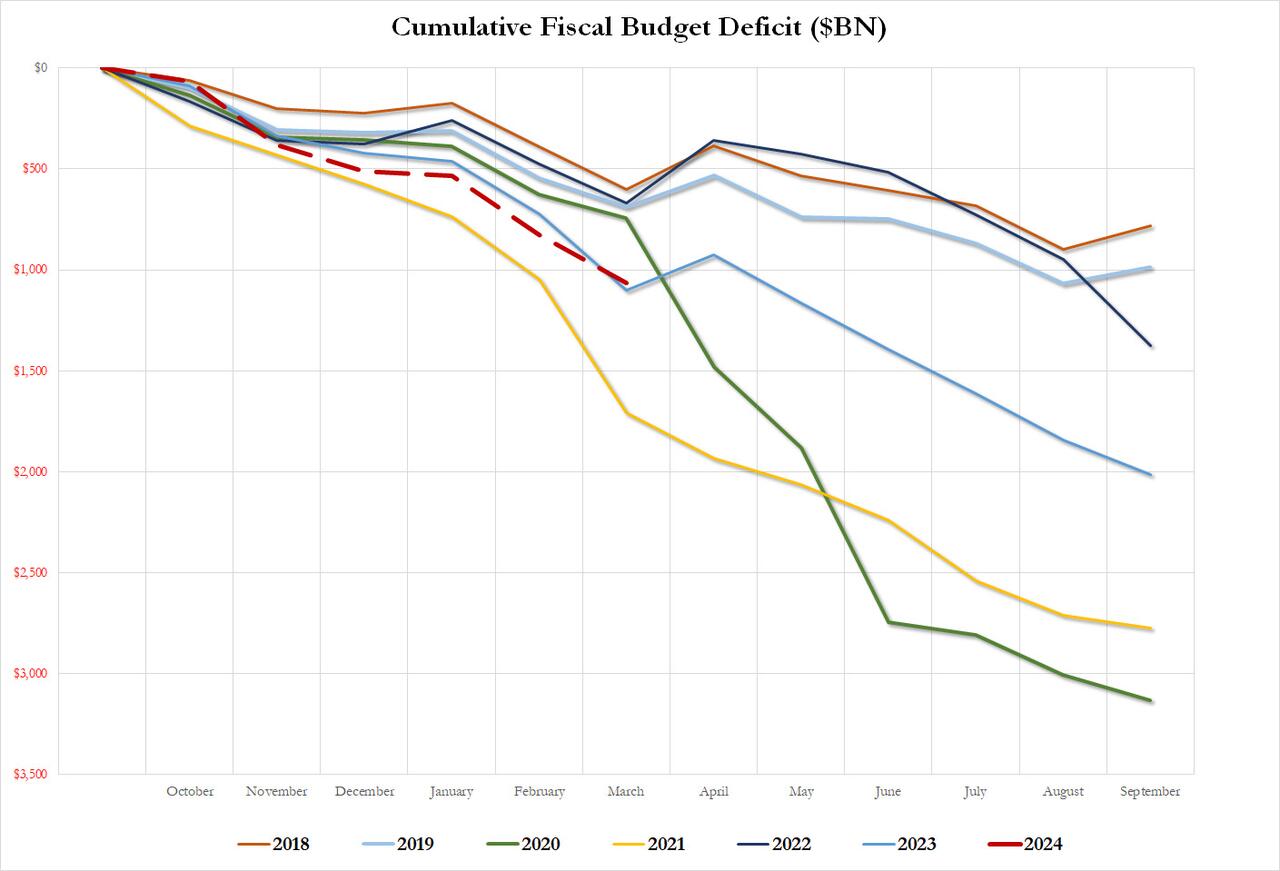
Putting the YTD deficit in context, in the first six months of fiscal 2024, the US deficit hit $1.065 trillion, just shy of the $1.1 trillion reached last year, which was the 2nd highest on record and only the post-covid 2021 was worse. Annualized, we expect total deficit to hit $2.2 trillion in fiscal 2024, a year when the US is supposedly “growing” at a nice, brisk ~2.5% pace. One can only imagine what the GDP growth would be if the US wasn’t set to have a wartime/crisis deficit…
… and we can’t even imagine what US deficit will be after the next recession/depression.
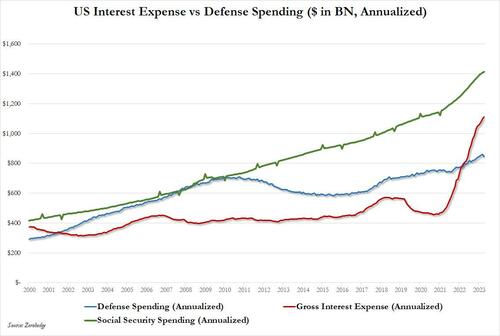
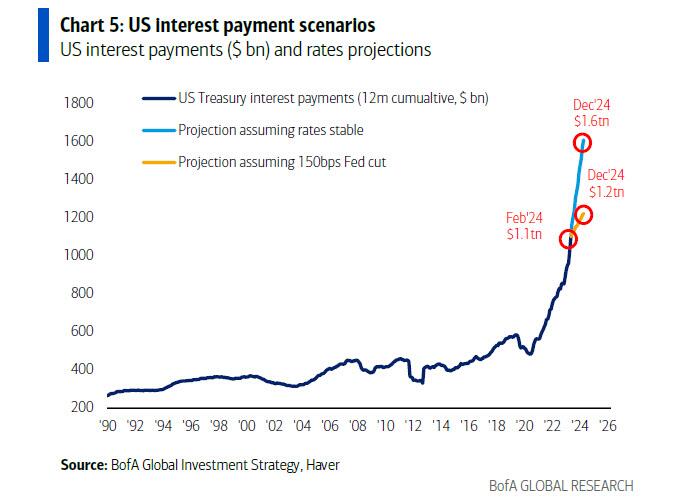
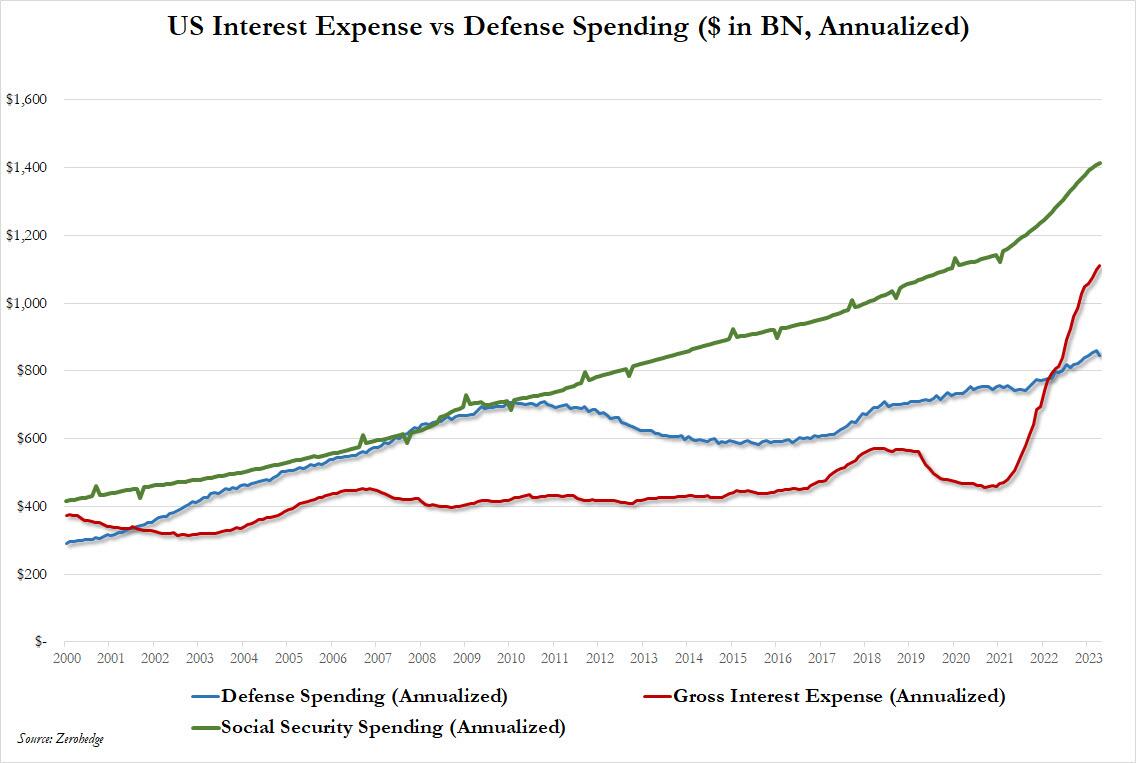
Meanwhile, as reported previously, total US interest continues to explode, and after surpassing total annual defense spending about a year ago, just the interest on US debt will soon become the single largest government outlay as it surpasses social security by the end of 2024, when according to BofA’s Michael Hartnett it hits $1.6 trillion…
.. and surpasses Social Security spending as the single largest spending category in the US government.
Biden has wanted to get rid of Social Security for a long-time and now wants to get rid of Medicare Advantage programs and put everyone on Medicare. Looks like Cloward-Piven!
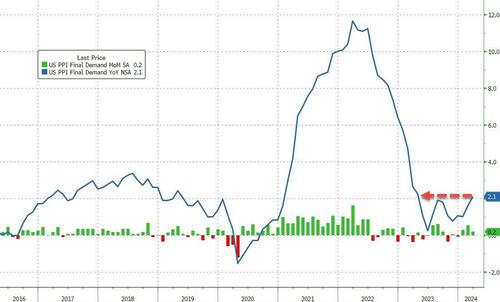
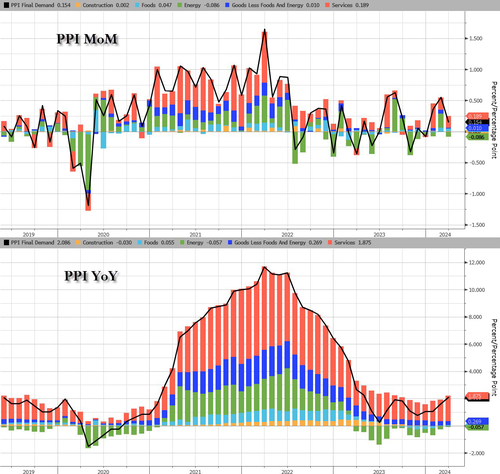
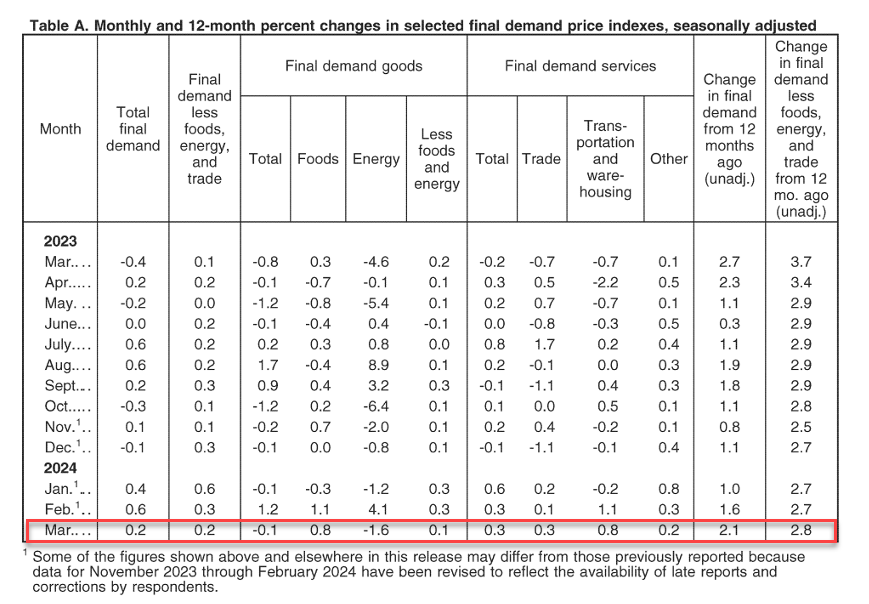
On top of skyroceting budget deficits, we have Producer Prices rising at fastest pace in a year in March.
After yesterday’s CPI-surge, PPI followed along, with headline producer prices rising 0.2% MoM (+0.3% MoM exp), pushing the YoY PPI to +2.1% (+2.2% exp) from +1.6% – the highest since April 2023…
Source: Bloomberg
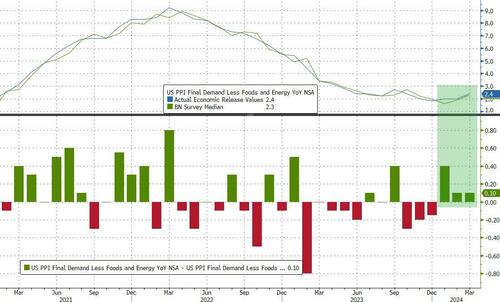
Core CPI rose 2.4% YoY (hotter than the expected 2.3%) – the third hotter-than-expected core PPI print in a row…
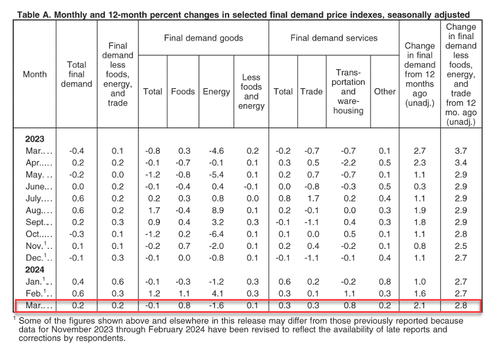
Under the hood, Services prices rose while goods prices declined MoM.
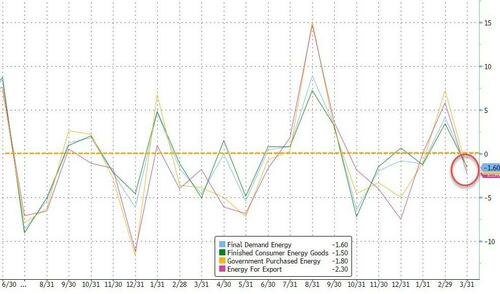
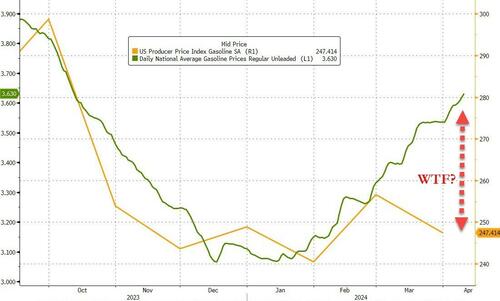
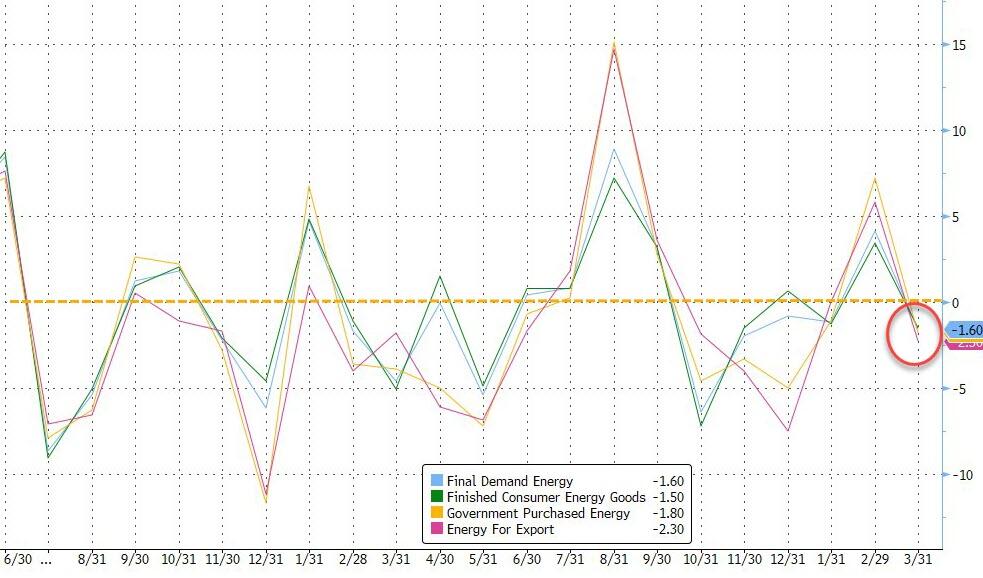
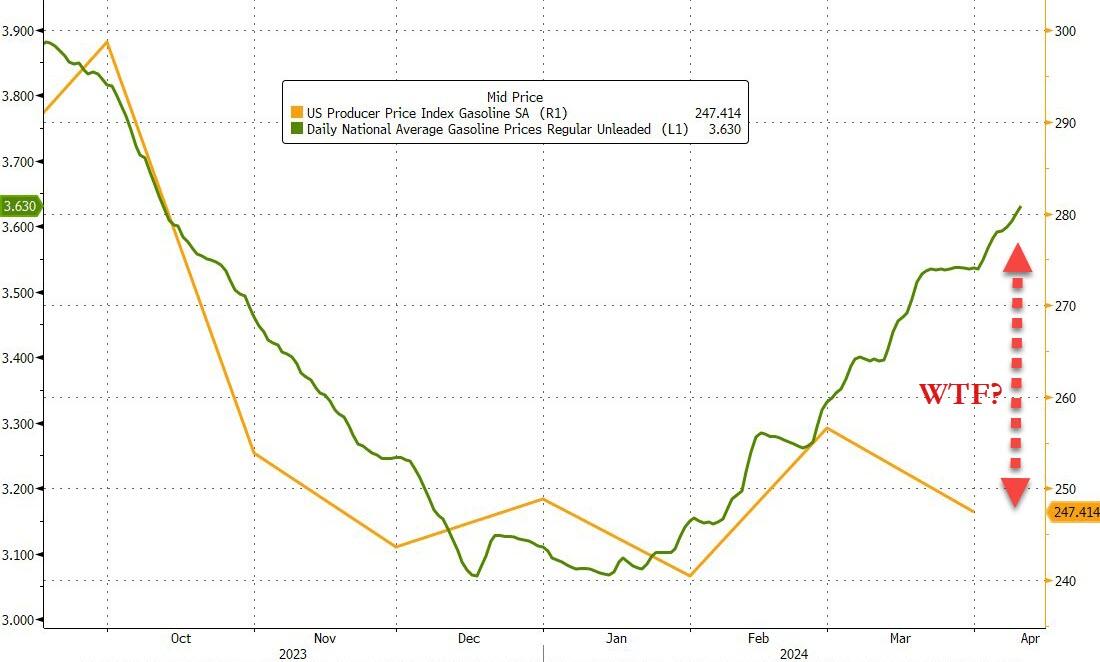
One thing that stands out as rather odd is the 1.6% MoM decline in Energy costs in the month… as prices soared for crude and gasoline?
Leading the March decline in the index for final demand goods, prices for gasoline decreased 3.6 percent…
And blame the markets for why the print was hot:
A major factor in the March increase in prices for final demand services was the index for securities brokerage, dealing, investment advice, and related services, which rose 3.1 percent.
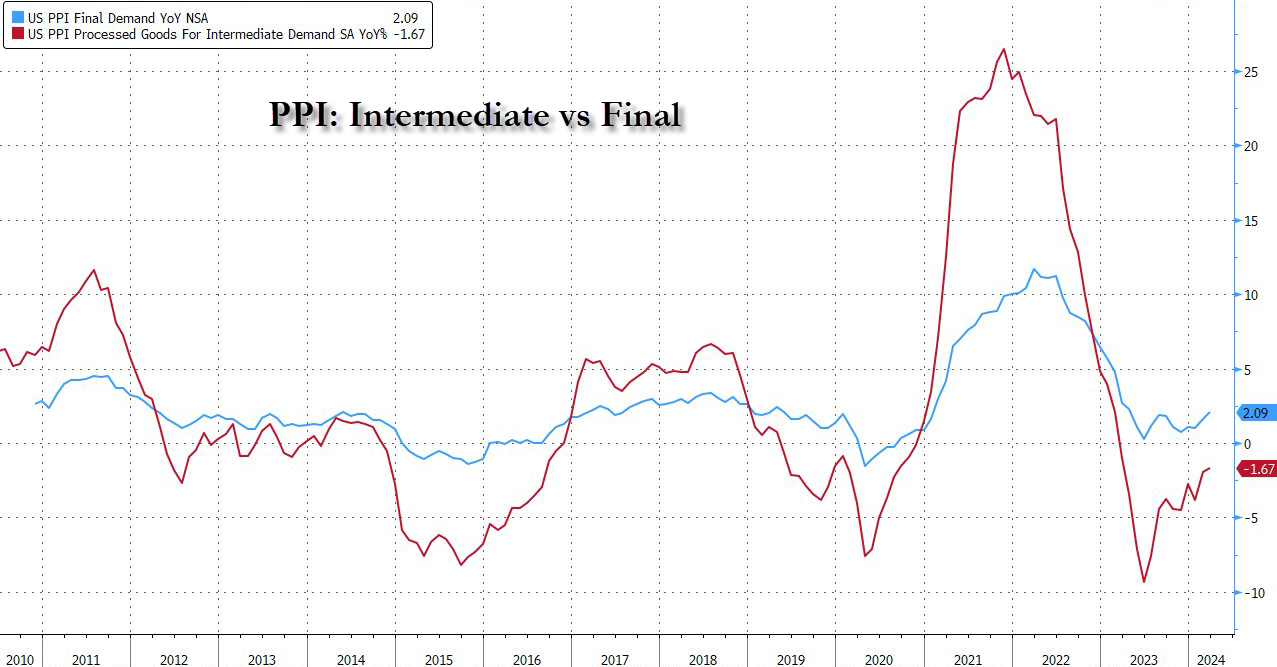
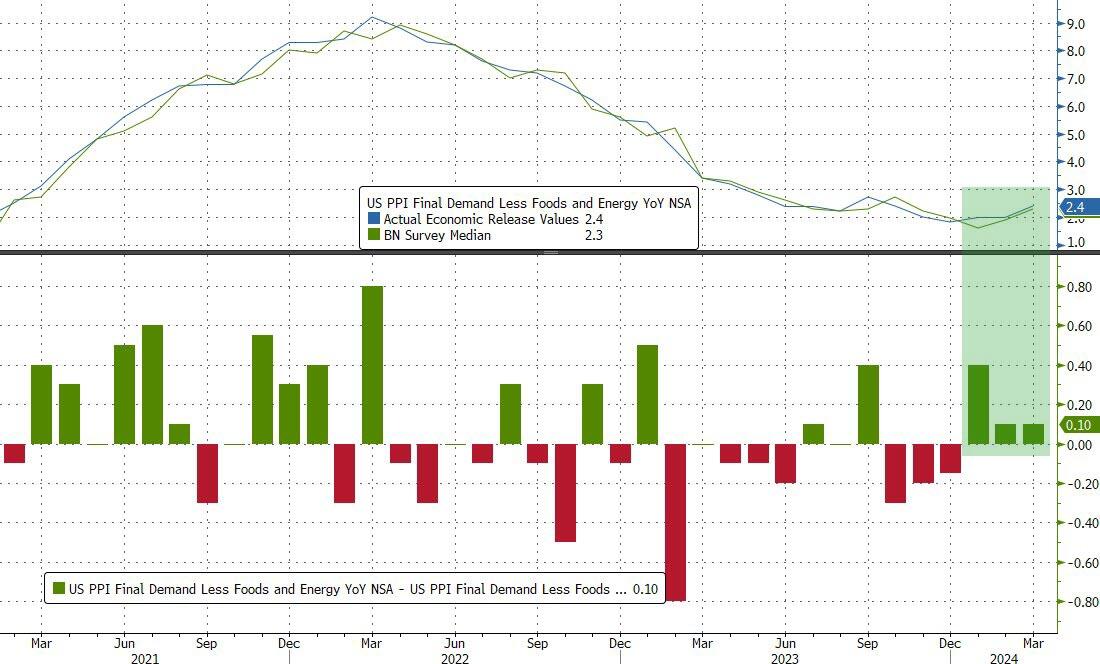
And on a YoY basis, Services costs are accelerating…
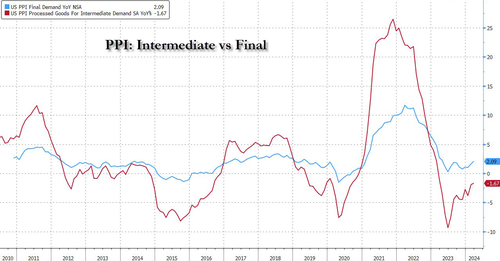
Pressure continues to build in the inflation pipeline too…
While some may cling with grim hope to the ‘cooler than expected’ headline PPI print, core PPI is hot, damn hot, and headline PPI is rising. Not at all what The Fed, or Biden, wants to see – no matter how hard they spin it.
This is Victor Davis Hansen from Stanford’s Hoover Institute.
Funky cold Joe Biden is his reaction to inflation caused by his outragous spending. His legion of sycophants are now saying inflation is a good thing or don’t notice it. But Biden will never stop spending .
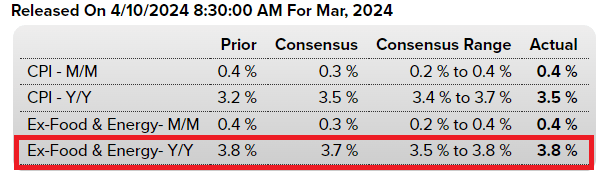
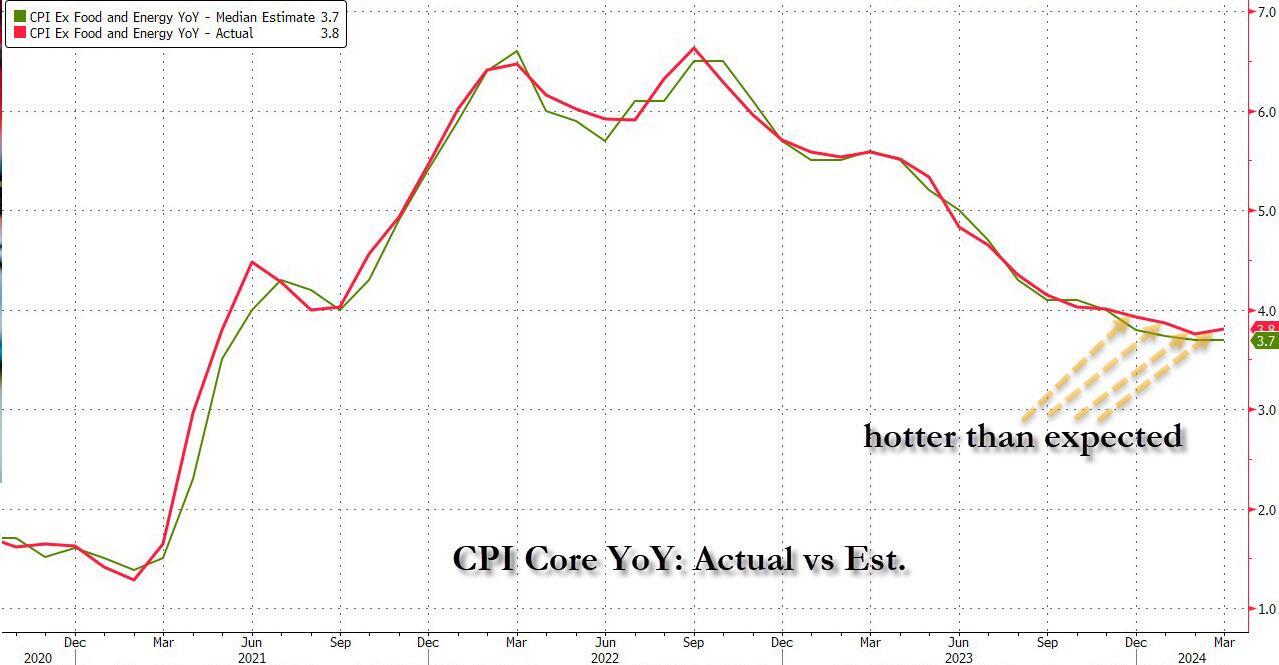
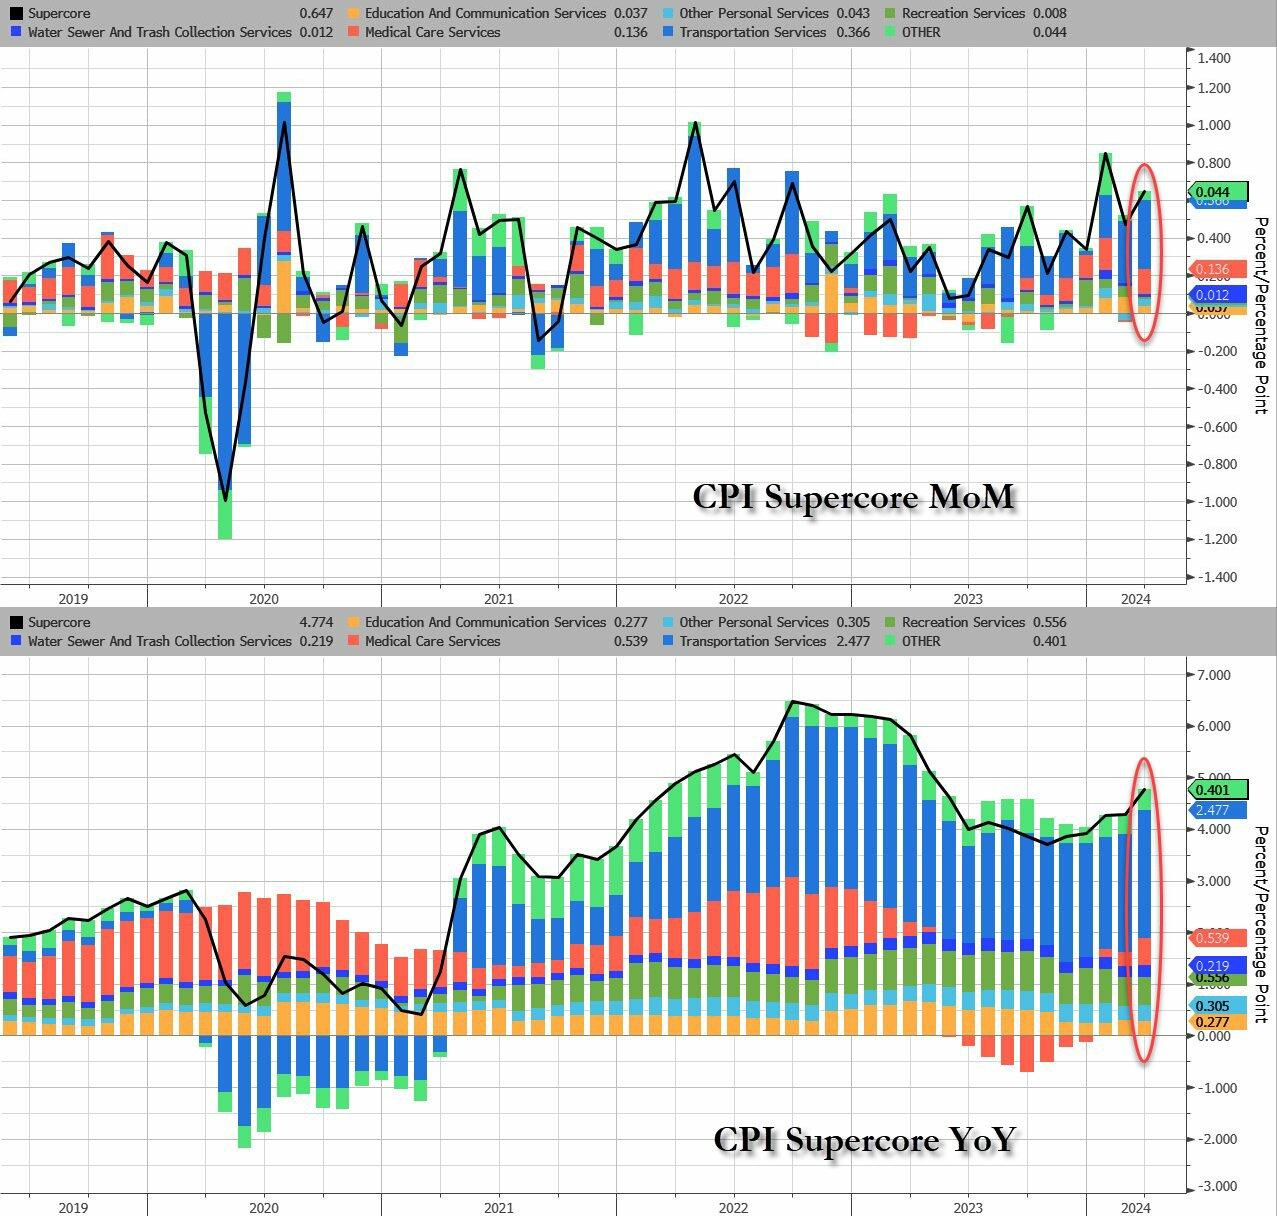
Coming into today’s CPI number, which followed three previous red-hot inflation prints, we said that it’s time for a “miss” (the first of 2024) not because the data demands it – on the contrary, prices continue to rise at a frightening pace – but because a dovish CPI print today would be the last opportunity for the Fed to set a timetable for a rate cut calendar ahead of November’s election.
Well, you can wave goodbye to all that, because we just got the 4th consecutive “inflation beat” in a row…
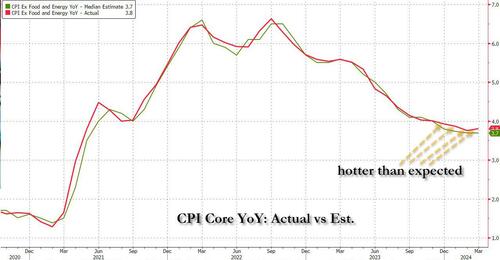
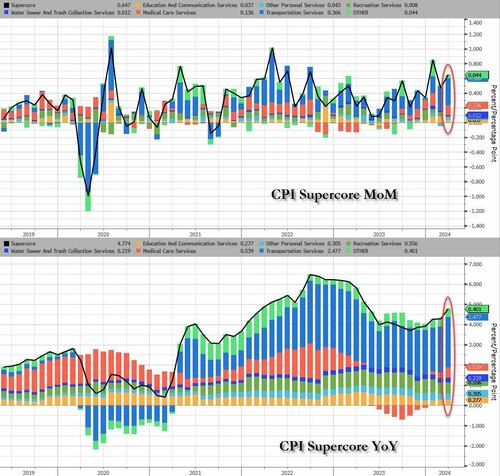
… with supercore inflation coming in blazing hot…
… thanks to a boiling inflation print which saw every single CPI metric coming in hotter than expected – was a shock, not because it reflected reality, but because it effectively sealed Biden’s fate because as Bloomberg’s Chris Antsey writes, “obviously, this is very bad news for Joe Biden… we’re approaching the point where high inflation is bound to still be in voters’ minds when they head to the polls, regardless of how the price figures come in over summer.”Easy financial conditions continue to provide a significant tailwind to growth and inflation. As a result, the Fed is not done fighting inflation and rates will stay higher for longer.”
It’s about to get even worse: recall today we have a $39 billion 10-year auction which is already being dubbed “sloppy” and a definitive break of 4.5% could easily extend if underwriting dealers are left holding the bag. As it stands, the 10yr has popped above the 4.5% parapet. Ian Lyngen at BMO Capital Markets says:“We expect the setup to the auction will break 4.50% in 10-year yields with ease.”
Obviously, this is very bad news for Joe Biden. It’s still only April, and we’ll have another half-a-year’s worth of inflation reports before the election. But we’re approaching the point where high inflation is bound to still be in voters’ minds when they head to the polls, regardless of how the price figures come in over summer.
Joe Biden continues to act like a gangsta giving away student loan forgiveness despite being told no by the US Supreme Court. As I said, Funky Cold Joe Biden. But Biden’s gangstaism favors the top 0.5% of net worth people, not the masses.
As Biden gropes for more voters, claiming he was raised in Puerto Rican, Greek, Black, and every other race on the planet, he probably sings “Ride The White Horse” to The Presidency. Reminiscint of Hillary Clinton claiming she kept a packet of hot sauce in her purse when talking to a black commentator.
1. Everybuddy: 100% of workforce 2. Wisense: 100% of workforce 3. CodeSee: 100% of workforce 4. Twig: 100% of workforce 5. Twitch: 35% of workforce 6. Roomba: 31% of workforce 7. Bumble: 30% of workforce 8. Farfetch: 25% of workforce 9. Away: 25% of workforce 10. Hasbro: 20% of workforce 11. LA Times: 20% of workforce 12. Wint Wealth: 20% of workforce 13. Finder: 17% of workforce 14. Spotify: 17% of workforce 15. Buzzfeed: 16% of workforce 16. Levi’s: 15% of workforce 17. Xerox: 15% of workforce 18. Qualtrics: 14% of workforce 19. Wayfair: 13% of workforce 20. Duolingo: 10% of workforce 21. Rivian: 10% of workforce 22. Washington Post: 10% of workforce 23. Snap: 10% of workforce 24. eBay: 9% of workforce 25. Sony Interactive: 8% of workforce 26. Expedia: 8% of workforce 27. Business Insider: 8% of workforce 28. Instacart: 7% of workforce 29. Paypal: 7% of workforce 30. Okta: 7% of workforce 31. Charles Schwab: 6% of workforce 32. Docusign: 6% of workforce 33. Riskified: 6% of workforce 34. EA: 5% of workforce 35. Motional: 5% of workforce 36. Mozilla: 5% of workforce 37. Vacasa: 5% of workforce 38. CISCO: 5% of workforce 39. UPS: 2% of workforce 40. Nike: 2% of workforce 41. Blackrock: 3% of workforce 42. Paramount: 3% of workforce 43. Citigroup: 20,000 employees 44. ThyssenKrupp: 5,000 employees 45. Best Buy: 3,500 employees 46. Barry Callebaut: 2,500 employees 47. Outback Steakhouse: 1,000 48. Northrop Grumman: 1,000 employees 49. Pixar: 1,300 employees 50. Perrigo: 500 employees
But, according to the government-supplied data…
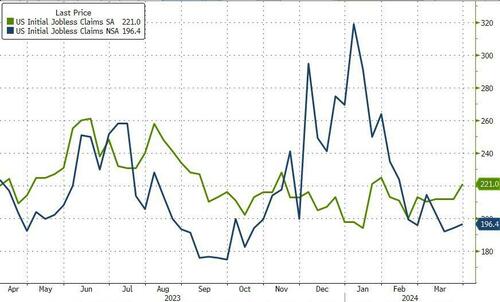
The number of Americans filing for jobless benefits for the first time last week rose from 212k to 221k (SA) to its highest since Jan, and claims ticked modestly higher on an NSA basis…
Source: Bloomberg
Continuing claims remain glued around 1.8mm Americans – where they have been for nine months…
Source: Bloomberg
But, here’s the thing… WARNs are soaring… and Challenger-Grey just announced that March saw the most job cuts (90,309) since January 2023…but government-supplied data on initial jobless claims continues to smoothly tick along near record lows…
Source: Bloomberg
The WARN data is very disturbing.
Ah, Bidenomics!!
If Trump wins in November, will all this data suddenly be ‘allowed’ to reflect reality?
But the feral pigs are already here in Washington DC as elected representative and non-elected bureaucrats.
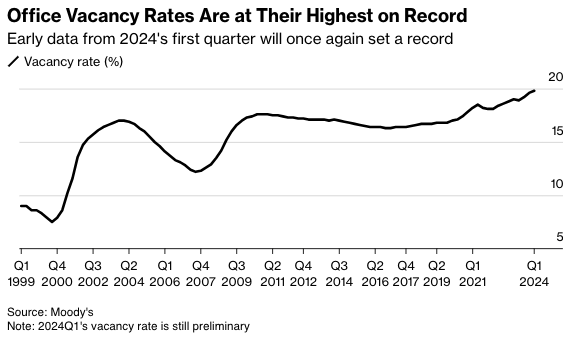
The rising supply of office space is due to a combination of surging remote and hybrid work that forces companies to reduce corporate footprints. Also, companies are exiting imploding progressive cities and high-taxed blue states for red ones while downsizing space. In the report, office tower vacancies rose to a record 19.8%, up from 19.6% in the fourth quarter of 2023.
Even with the increase, there is an eerily calm across the commercial real estate sector. This comes as the Federal Reserve’s interest rate hiking cycle is higher for longer, indicating that the pain train is nearing (perhaps after the presidential election).
“The office stress isn’t quite done yet,” Thomas LaSalvia, Moody’s head of commercial real estate economics and one of the authors of the report, told Bloomberg in an interview. He noted recent positive economic indicators stave off a “perfect storm in the office sector.”
“There are spots of light and there are spots of extreme darkness,” LaSalvia said, adding, “This is part of a longer-term evolution where we are seeing obsolete buildings in obsolete neighborhoods.”
The high office vacancy rate continues to be terrible news for landlords and developers eager to fill their buildings, and the Fed’s hiking cycle has made refinancing very challenging.
Viswanathan said there have been no major fireworks in CRE tower debt because the debt is being “extended and modified rather than refinanced,” which “mitigates a default wave and a sharp pick-up in losses on CRE loan portfolios.”
Yes, both residential and commercial real estate are thunderstruck under Bidenomics.
Mortgage applications decreased 0.6 percent from one week earlier, according to data from the Mortgage Bankers Association’s (MBA) Weekly Mortgage Applications Survey for the week ending March 29, 2024.
The Market Composite Index, a measure of mortgage loan application volume, decreased 0.6 percent on a seasonally adjusted basis from one week earlier. On an unadjusted basis, the Index decreased 0.1 percent compared with the previous week. The seasonally adjusted Purchase Index decreased 0.1 percent from one week earlier. The unadjusted Purchase Index increased 1 percent compared with the previous week and was 13 percent lower than the same week one year ago.
The Refinance Index decreased 2 percent from the previous week and was 5 percent lower than the same week one year ago.
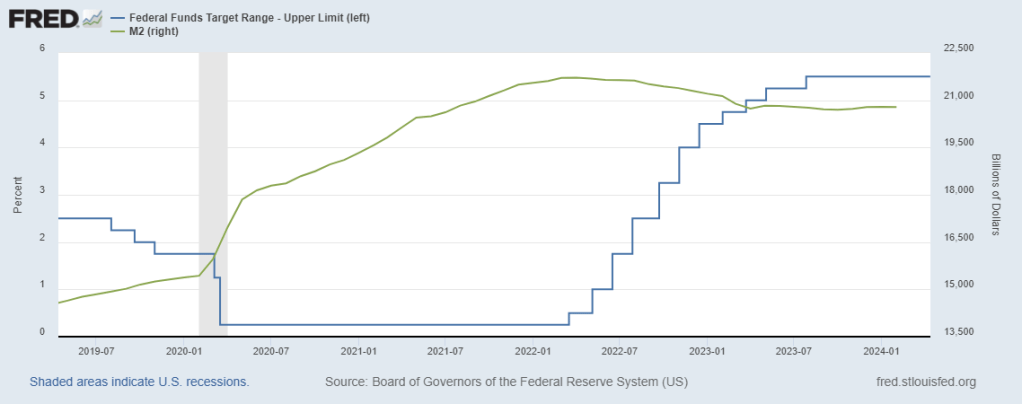
What a mess! With M2 Money up 8.4% under Biden (green line), home prices are up a staggering 39.2% under Sheriff Joe and his deputy Fed chair Jerome Powell.
And conforming mortgage rates (30Y) are up 148% under Biden’s Reign of Error.
Thanks O’Biden! Although Biden is the figurehead, Obama and his team are still running The White House. Regardess of whether it is Biden or Obama (or Soros/World Economic Forum) calling the shots, the US housing market is on a highway to hell.
Bidenomics “helping” the middle class and low wage workers.
The staggering amount of Fed money printing combined with insane, reckless spending by The Federal government (hereafter called The Feral Government) has caused massive distortion in the US economy.
Second, the US Treasury 10-year yield is up tp 4.35%, the highest in 2024.
Third, with the 10-year Treasury rising towards 5%, watch for the 30-year mortgage rate to rise AGAIN making housing even more unaffordable. Or as Robert Palmer almost sang, Simply Unaffordable. Today, the 30-year mortgage rate is 7.567%. Look for it to climb to over 8% very soon.
Fourth, BOOM: federal debt explodes $41 billion higher yesterday, breaching $34.6 trillion for first time ever; we’re on track to borrow $2.9 trillion this fiscal year – how long before the bond vigilantes have to remind everyone just how much power they have?
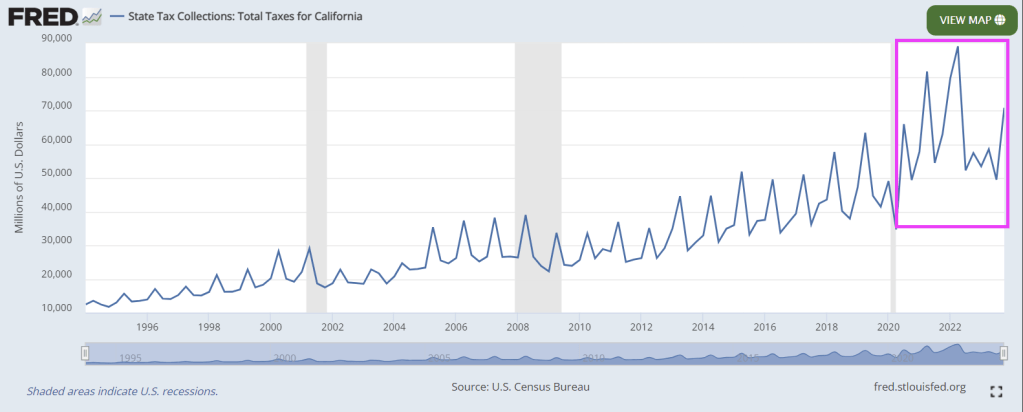
There is gold in them thar hills in California. And politicians like Gavin Newsom (aka, Pond Scum) not only spend all their cash available from (ruinous) taxes, but also spend like drunken miners and run up massive deficits and debts.
Governor Gavin Newsom bragged of a surplus, but California is seriously underwater. The next recession will hit the state extremely hard.
California’s total state and local government debt now stands at almost $1.6 trillion, or about half the state’s GDP.
That isn’t an alarming ratio when compared to the national debt, which has now soared to 128 percent of U.S. GDP with no end in sight. But Californians carry this $1.6 trillion state and local debt ($40,000 per capita) in addition to their share of the national debt (about $90,000 per capita).
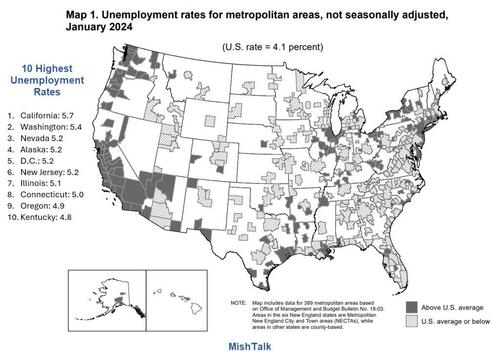
Unsurprisingly, California has the highest unemployment rate in the nation at 5.7 percent vs. 4.1 percent nationally.
A Booming Economy?
California has massive problems although the stock market is at a record high and the economy is allegedly booming. The next recession will hit California exceptionally hard, and it’s not too far off.
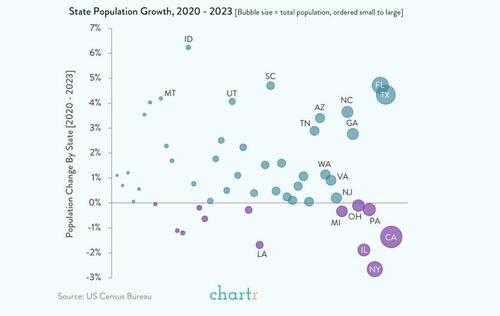
But thanks to Newsom’s Presidential ambitions (God help us!), along with virtually psychopathic state legislators, California has been tax crazy (particularly in 2022). This has helped to drive a demoralized middle class to Arizona, Texas, Nevada and other lower tax states.
And then we have California’s fast food minumum wage disaster, causing closing of small, family-owned restaurants. And causing massive layoffs in the fast food industry and probably leading to an AI takeover of corporate resturants (I remember taking my poor wife to Olive Garden and I refused to use to electronic ordering system and demanded a real waiter to serve us. The waiter told us that nobody liked the electronic ordering system).
While not the only guilty party, Newsom is a leader … in bankrupting California with his budgetary fantasies and Presidential aspirations.
I am surprised that Newsom hasn’t used the themesong from Jim Bowie as his themesong.


You must be logged in to post a comment.