A recent paper by Michael Stegman, Ted Tozer and Richard Green reminds me of The Who’s song “Won’t Get Fooled Again.” Except that apparently Stegman, Tozer and Green did get fooled again.
I remember testifying in the House of Representatives in Washington DC on the financial crisis and housing markets. I pointed out that low down payment mortgages lending to households with low credit scores was very dangerous. I had the data and presented it to the House committee on financial services.
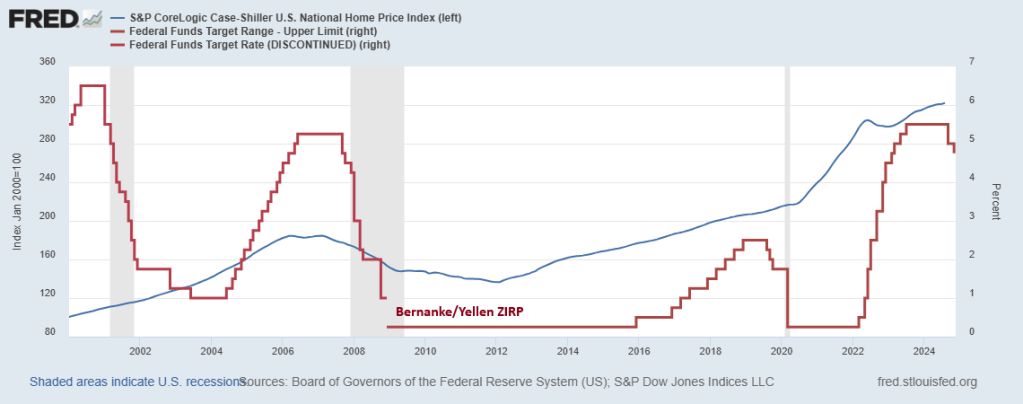
The problem with Stegman et al’s paper is that it ignores The Federal Reserve and Federal spending. After the financial crisis of 2008 when housing prices declined (especially in bubble states like Arizona, Nevada and Florida), Berananke and Yellen adopted a zero interest rate policy that resulted in housing prices rising again. Then we have Powell’s lowering of rates to near-zero following the Covid outbreak and the insane level of Federal spending that ensued helping to drive housing prices to dangerous bubble levels. Making first time homeowner purchases almost impossible.
So, like the 2000s, the pursuit of homeownership will lead to insance policy proposals. If nothing else, the Stegman et al proposal will lead to MORE inflation in housing prices and set the stage for a housing bubble burst of epic proportions.
Apparently, Stegman et al DID get fooled again. Or they just don’t care.
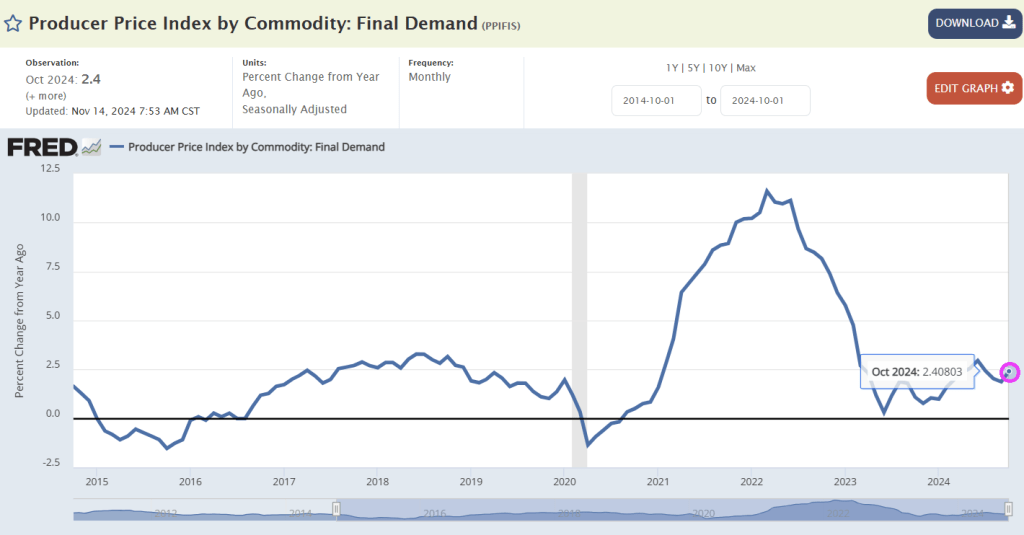
After yesterday’s in line – but really cooler than whispered – CPI which restored hope in a December rate cut, all eyes are on this morning’s PPI print to boost dovish hopes that the Fed’s easing cycle would remain on track. It was not meant to be, however, as the PPI came in hotter than expected across the board on both a monthly and annual basis.
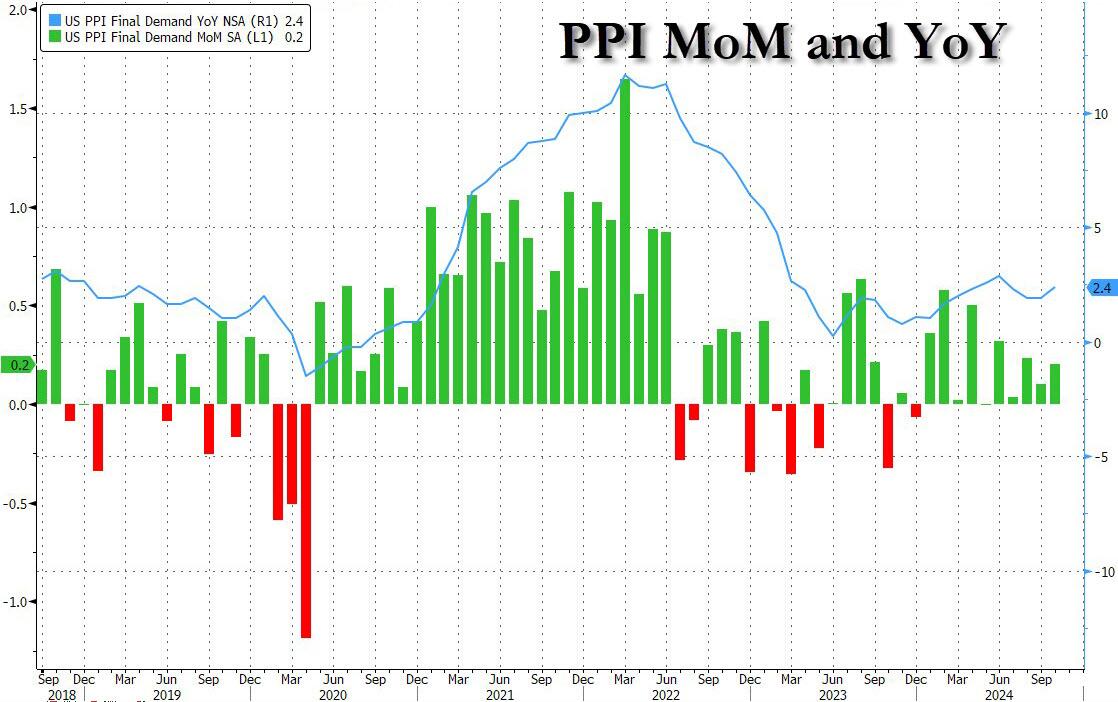
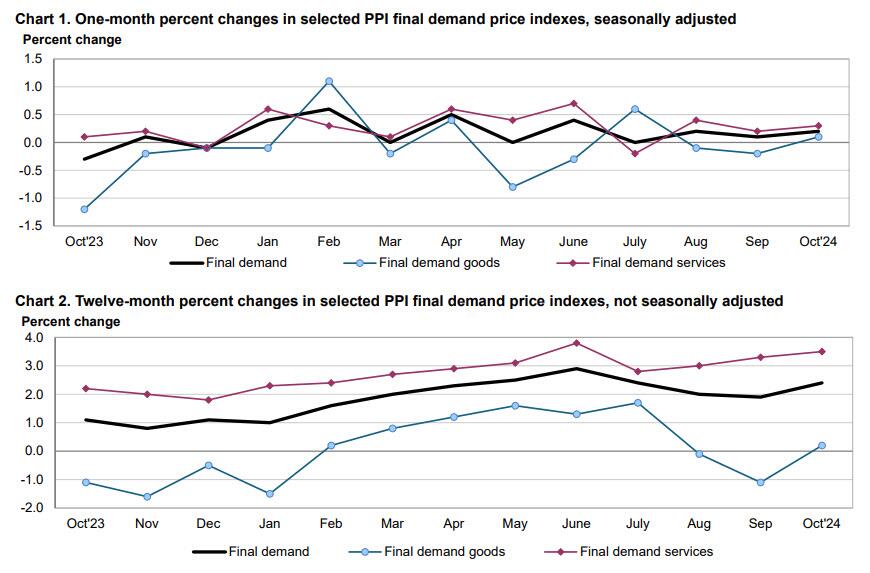
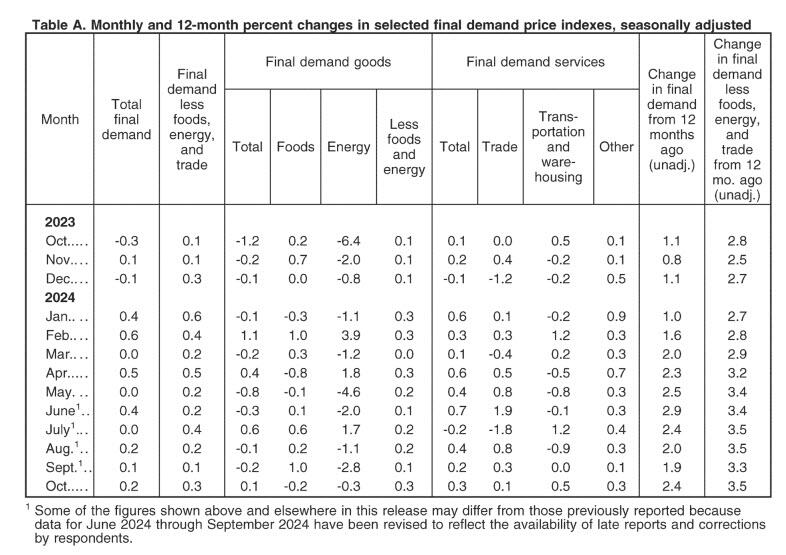
Starting at the top, headline PPI rose 0.2% MoM (in line with the +0.2% expected) but September was revised higher from 0.0% to 0.1%; meanwhile on an annual basis, headline PPI rose 2.4%, higher than the 2.3% expected, with the last month also revised higher from 1.8% to 1.9%.
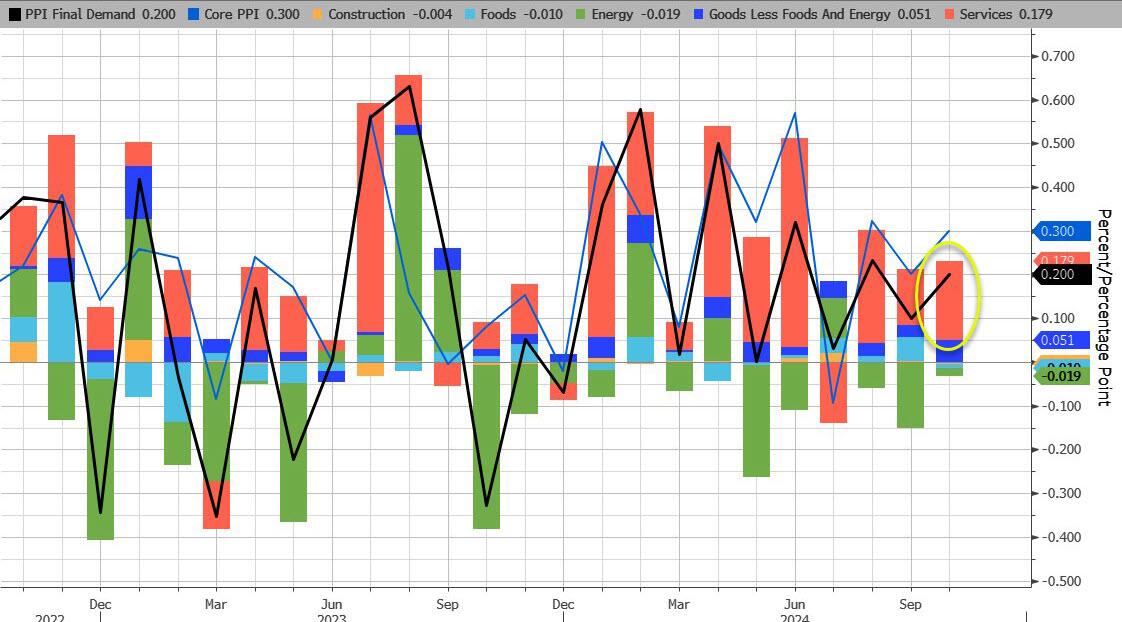
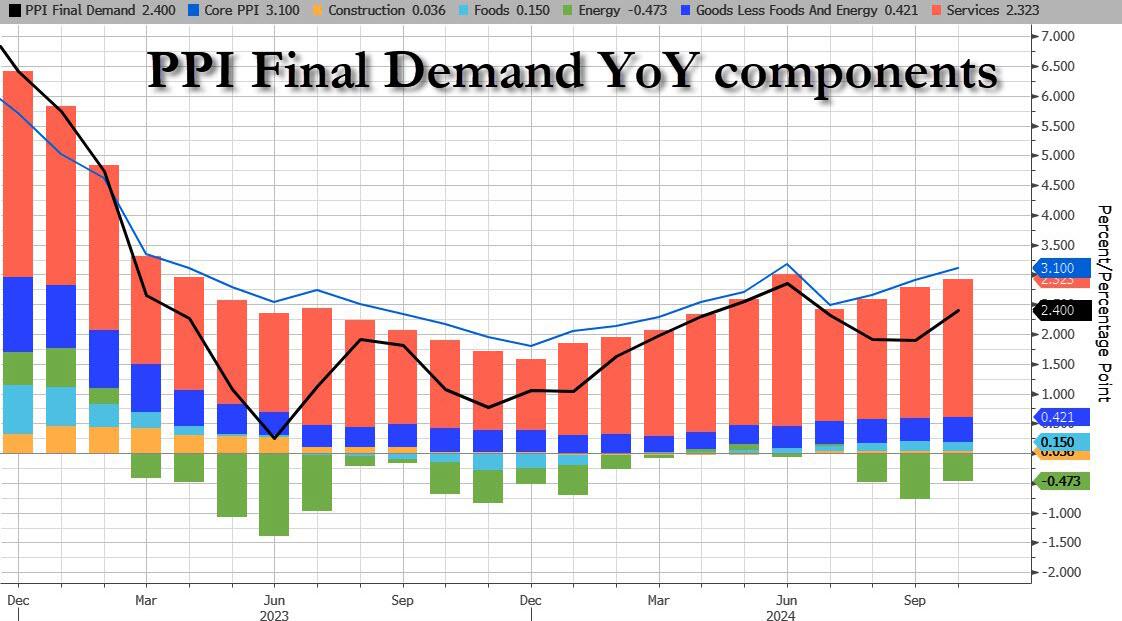
Unlike last month when a drop in energy prices weighed heavily on the headline PPI number, this month energy subtracted just 0.02% from the final print, the lowest detraction since July. Meanwhile, Services added a hefty 0.179% to the bottom line number.
Indeed, according to the BLS, most of the rise in final demand prices can be traced to a 0.% advance in the index for final demand services. Prices for final demand goods inched up 0.1%, the first increase in the index since July.
Taking a closer look at the components:
Final demand services: The index for final demand services increased 0.3 percent in October after rising 0.2 percent in September. Over three-fourths of the broad-based advance in October is attributable to prices for final demand services less trade, transportation, and warehousing, which moved up 0.3 percent. The indexes for final demand transportation and warehousing services and for final demand trade services also increased, 0.5 percent and 0.1 percent, respectively. (Trade indexes measure changes in margins received by wholesalers and retailers.)
Product detail:
Over one-third of the rise in the index for final demand services can be traced to prices for portfolio management, which advanced 3.6 percent. The indexes for machinery and vehicle wholesaling; airline passenger services; computer hardware, software, and supplies retailing; outpatient care (partial); and cable and satellite subscriber services also moved higher.
In contrast, margins for apparel, footwear, and accessories retailing fell 3.7 percent. Prices for securities brokerage, dealing, investment advice, and related services and for truck transportation of freight also declined.
Final demand goods: The index for final demand goods inched up 0.1 percent in October following two consecutive decreases. The advance can be traced to a 0.3-percent rise in prices for final demand goods less foods and energy. Conversely, the indexes for final demand energy and for final demand foods declined 0.3 percent and 0.2 percent, respectively.
Product detail:
An 8.4-percent increase in the index for carbon steel scrap was a major factor in the advance in prices for final demand goods. The indexes for meats, diesel fuel, fresh and dry vegetables, and oilseeds also moved higher.
In contrast, prices for liquefied petroleum gas fell 18.1 percent. The indexes for chicken eggs, processed poultry, and ethanol also decreased.
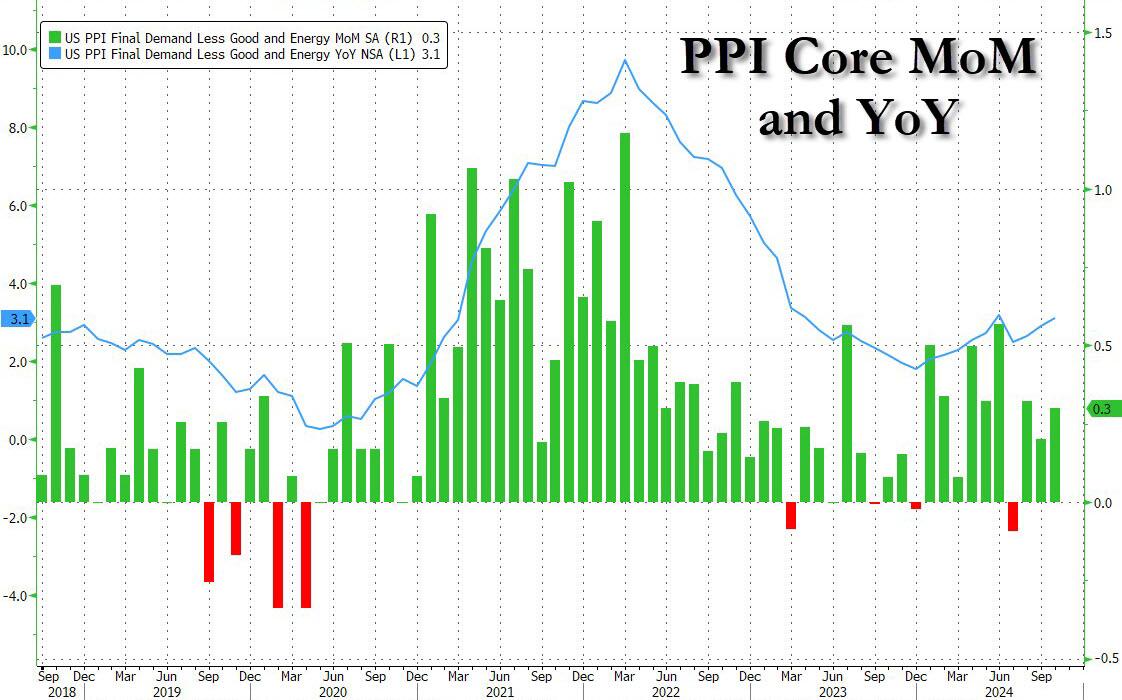
Even more problematic for the doves, however, is that core PPI jumped to +3.1% YoY (hotter than the 3.0% exp) with the prior month revised higher to 2.9% from 2.8%. This was the second hottest print going back to March 2023 with just the June outlier surge hotter than October…
… as sticky Services costs continue to rise.
The hotter than expected PPIs have pushed yields and the dollar higher, even as the market waits to see the details of what impact today’s numbers will have on the Fed’s preferred core PCE metric – according to UBS key PPI components to PCE look hot – although Bloomberg noted a big jump in air passenger services (3.2%), which suggests some upside risks (i.e., 0.3% core PCE).
The most notable takeaway from the data appears to be the increase in final demand for services in October, which is similar to the factors that increased CPI yesterday — shelter, food and energy, which are components the Fed cannot control with interest rates.
Bottom line: this is a long way from the Fed’s mandated 2%, and it’s moving in the wrong direction, something which has not been lost on the market, where Treasury curves are flattening after the data, which suggests traders are wavering over the prospects of a December rate cut. That has yet to be reflected in rates markets — bets have been trimmed but marginally, not enough to really change the swaps market outlook as of now. According to BBG’s Vince Cignarella, sizeable block trades are going through Treasuries, mostly in the five-year tenor and some ten-year tenors, which looks like positioning for higher yields and flatter curves.
The office sector of commercial real estate has been in a depression for about two years, with prices of older office towers plunging by 50%, 60%, or 70% from their last transaction, and sometimes even more, with some office towers selling for land value, with the building by itself being worth next to nothing even in Manhattan.
Landlords of office buildings are having trouble collecting enough in rent to even pay the interest on their loans, and they’re having trouble or are finding it impossible to refinance a maturing loan, and so many of them have stopped making interest payments on their mortgages, and delinquencies continue to spike.
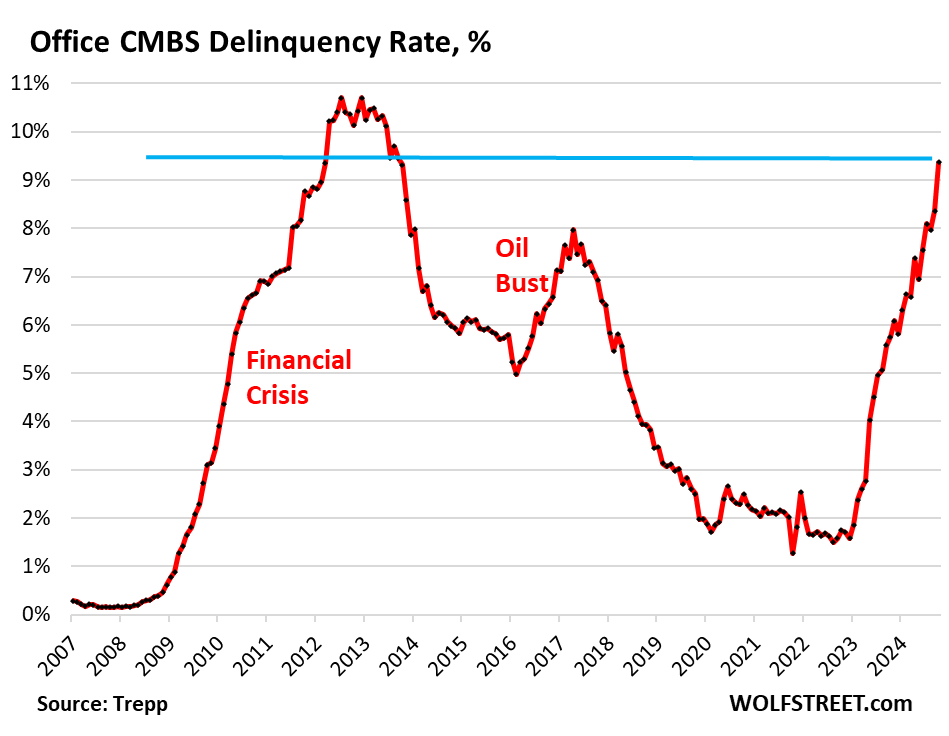
The delinquency rate of office mortgages backing commercial mortgage-backed securities (CMBS) spiked to 9.4% in October, up a full percentage point from September, and the highest since the worst months of the meltdown that followed the Financial Crisis. The delinquency rate has doubled since June 2023 (4.5%), according to data by Trepp, which tracks and analyzes CMBS.
Office CRE fund managers have spread the rumor that office CRE has bottomed out, but the CMBS delinquency rate doesn’t agree with this bottomed-out scenario; it’s aggressively spiking.
Three months ago, the delinquency rate surpassed the surge in delinquencies that followed the American Oil Bust from 2014 through 2016, when hundreds of companies in the US oil-and-gas sector filed for bankruptcy as the price of oil had collapsed due to overproduction, which devastated the Houston office market in 2016.
But now there’s a structural problem that won’t easily go away with the price of oil: A huge office glut has emerged after years of overbuilding and industry hype about the “office shortage” that led big companies to hog office space as soon as it came on the market with the hope they’d grow into it. However, during the pandemic, companies realized that they don’t need all this office space, and vast portions of it sits there vacant and for lease, with vacancy rates in the 25% to 36% range in the biggest markets.
Mortgages are considered delinquent by Trepp when the borrower fails to make the interest payment after the 30-day grace period. A mortgage is not considered delinquent here if the borrower continues to make the interest payment but fails to pay off the mortgage when it matures. This kind of repayment default, while the borrower is current on interest, would be on top of the delinquency rate here.
Loans are pulled off the delinquency list if the interest gets paid, or if the loan is resolved through a foreclosure sale, generally involving big losses for the CMBS holders, or if a deal gets worked out between landlord and the special servicer that represents the CMBS holders, such as the mortgage being restructured or modified and extended.
Survive till 2025 has been the motto. But that might not work either. The Fed has cut its policy rate by 50 basis points in September and is likely to cut more but in smaller increments. Many CRE loans are floating-rate loans that adjust to a short-term rate (SOFR), and short-term rates move largely with the Fed’s policy rates. And floating-rate loans will have lower interest rates as the Fed cuts.
Long-term rates, including fixed-rate mortgage rates have risen sharply since the Fed started cutting rates, so that option isn’t appealing.
So the hope in the CRE industry is that rate cuts will be steep and many, thereby reducing floating-rate interest payments, making it easier for landlords to meet them. And so the prescription was: Survive till 2025, when interest rates would be, they hope, far lower than they were.
But rate cuts will do nothing to address the structural issues that office CRE faces. The landlord of a nearly empty older office tower isn’t going to be able to make the interest payment even at a lower rate when the tower is largely vacant.
And these older office towers face the brunt of the vacancy rates, amid a flight to quality now feasible because of vacancies even at the latest and greatest properties. And there are a lot of these older office towers around that have been refinanced at very high valuations in the years before the pandemic, but whose valuations have now plunged by 50%, 60%, or 70%, and they have become a nightmare for lenders and CMBS holders.
It turns out that Powell’s “emergency” 50bps rate cut was – drumroll – another major policy mistake by the Fed. Or it is Presidential election interference by The Biden/Harris Administration giving Cacklin’ Kamala as talking point?
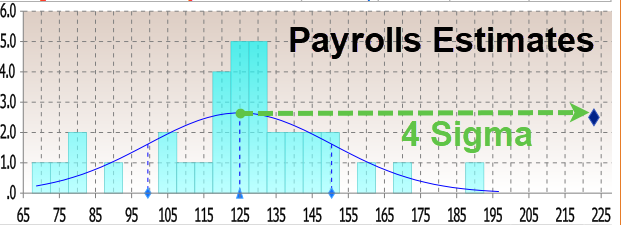
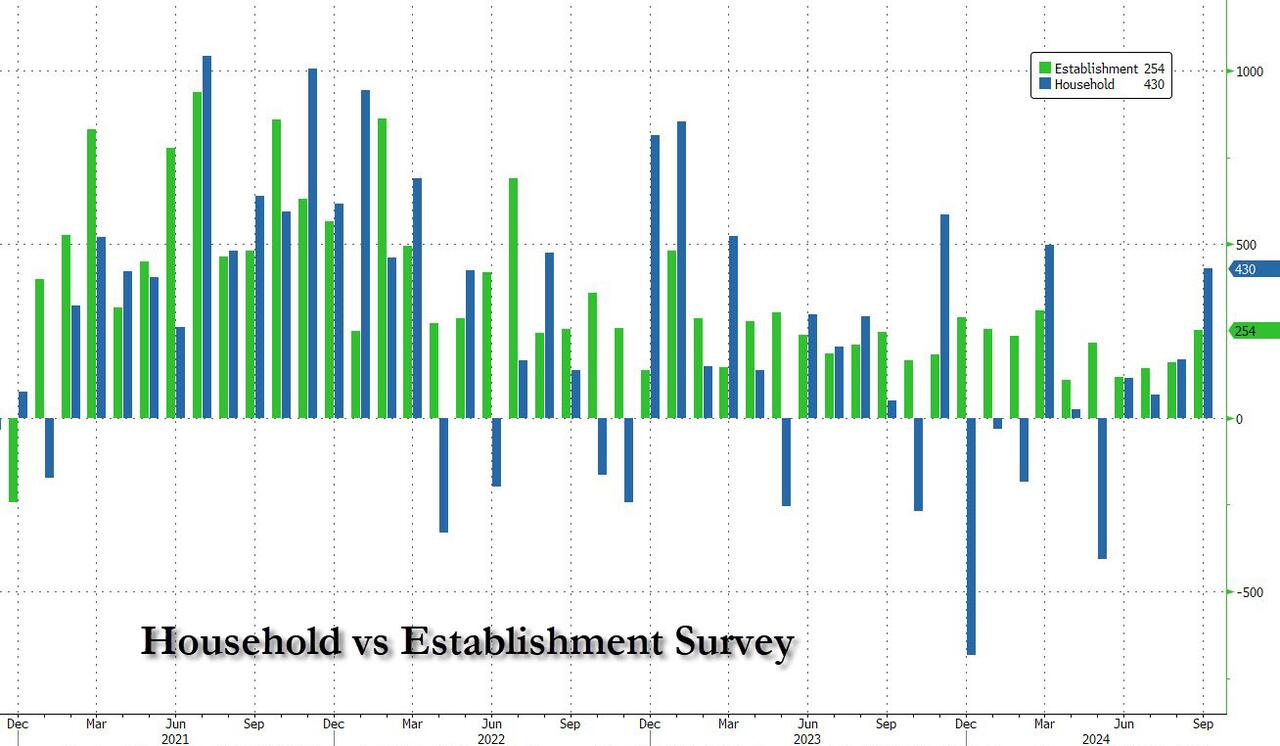
Moments ago, the BLS reported that at a time when prevailing consensus was for jobs to continue their recent downward slide sparked by the near-record annual jobs revision and several months of downbeat jobs reports, in September the US unexpectedly added a whopping 254K jobs, the biggest monthly increase since March…
There’s more: unlike previous months where we saw repeat downward job revisions, the BLS said that both prior months were revised up, to wit: the change in total nonfarm payroll employment for July was revised up by 55,000, from +89,000 to +144,000, and the change for August was revised up by 17,000, from +142,000 to +159,000. With these revisions, employment in July and August combined is 72,000 higher than previously reported.
Some context: as UBS notes, the moving six-month average on nonfarm payrolls is 167k. The estimate is that 150k is about consistent with a return of the economy to trend growth. Which means that inflation is about to come back with a vengeance, just as the Fed launches its easing cycle.
Remarkably, while payrolls jumped by the most in half a year, the number of employed people also surged, rising by a whopping 430K, also the biggest one-month jump since March.
It wasn’t just the payrolls, however, which came in far stronger than estimates: the unemployment rate also came in stronger than expected, and thanks to the jump in employed workers coupled with the decline in unemployed workers (from 7.115MM to 6.834MM), it dropped from 4.2% to 4.1% (and down from 4.3% two months ago which spared the entire recession panic).
Among the major worker groups, the unemployment rate for adult men (3.7 percent) decreased in September. The jobless rates for adult women (3.6 percent), teenagers (14.3 percent), Whites (3.6 percent), Blacks (5.7 percent), Asians (4.1 percent), and Hispanics (5.1 percent) showed little or no change over the month.
And here is the rub, because in a vacuum the super strong jobs numbers would have been fantastic, the only issue is that the September blowout comes as the Fed launches an easing cycle and as wages are once again rising as we have warned for the past 3 months. Indeed, in September, the average hourly earnings rose 0.4% sequentially, beating the estimate of 0.3%, while on an annual basis, wage growth was 4.0%, up from an upward revised 3.9% and beating the 3.8% estimate.
One note here: the average workweek for all employees edged down by 0.1 hour to 34.2 hours in September, which means the hourly earnings increase is not “pure” but rather a function of denominator adjustments. In manufacturing, the average workweek was unchanged at 40.0 hours, and overtime edged down by 0.1 hour to 2.9 hours. The average workweek for production and nonsupervisory employees on private nonfarm payrolls remained at 33.7 hours.
What sector had the biggest growth? UNPRODUCTIVE government workers! A record 785,000 government workers were added in September, pushing total govt workers also to a new record high.
The Biden/Harris Administration has given away billions of dollars to foreign nations (like Ukraine) and illegal immigrants so far this year,
– $24,400,000,000 to Ukraine.
– $11,300,000,000 to Israel.
– $1,950,000,000 to Ethiopia.
– $1,600,000,000 to Jordan.
– $1,400,000,000 to Egypt.
– $1,100,000,000 to Afghanistan.
– $1,100,000,000 to Somalia.
– $1,000,000,000 to Yemen.
– $987,000,000 to Congo.
– $896,000,000 to Syria.
– $9,000 per illegal immigrant that has entered the U.S.
And claim that FEMA has no money left for Hurricane Helene victims who have received only $750 per person. So I have plenty of reasons to have no trust or confidence in the Biden/Harris Mal-administration.
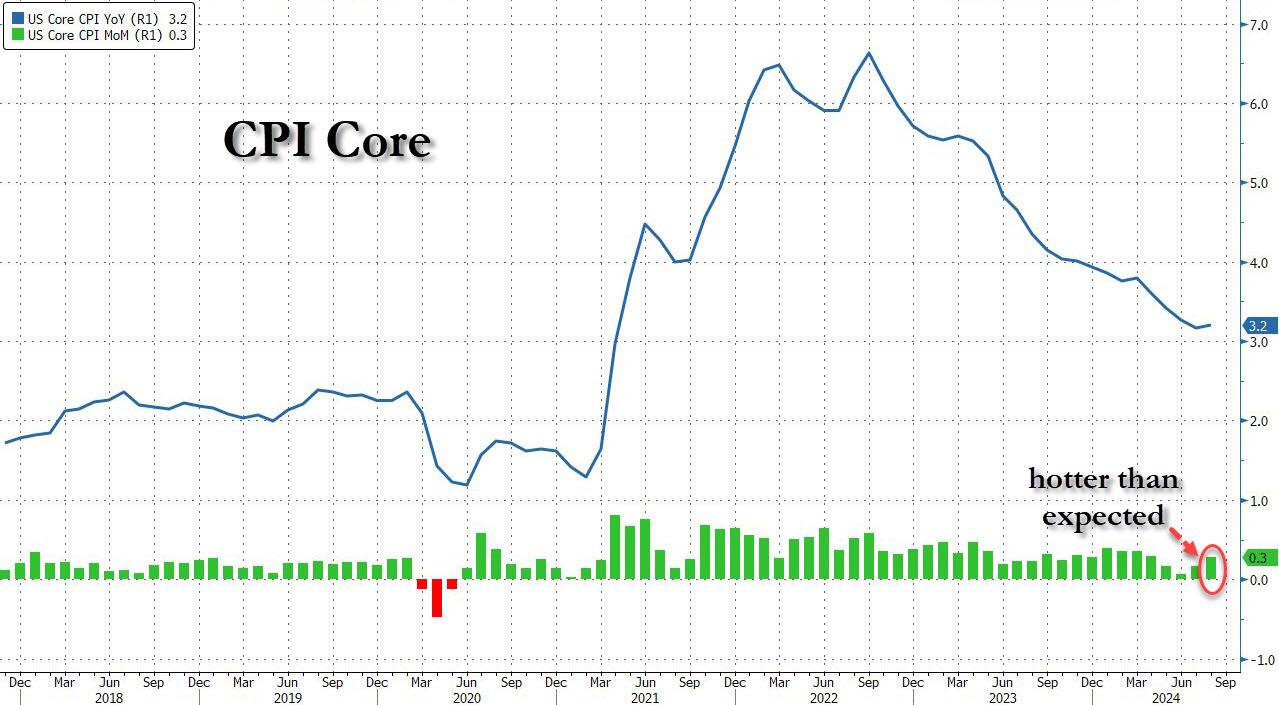
Following last month’s modest miss in CPI which sparked speculation about a 50bps cut, which was then boosted by the jobs report miss and the huge downward revision, moments ago the BLS reported that – as only a handful of Wall Street strategists warned – CPI actually came in hotter than expected at the core level, rising 0.3% MoM vs expectations of a 0.2% print, with all remaining metrics coming in line, to wit:
CPI 0.2% MoM (or 0.187% unrounded), Exp. 0.2% – in line
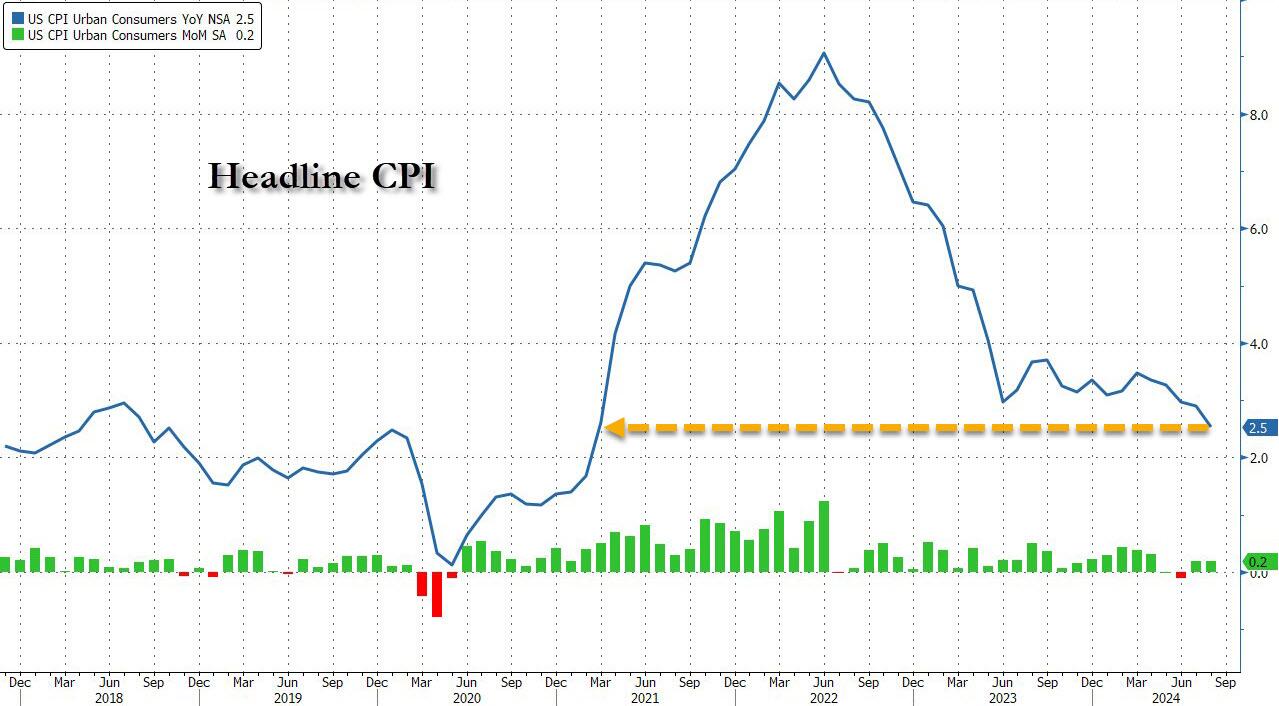
And visually, here is the headline print, where the annual CPI increase dropped to just 2.5% from 2.9%, the lowest since February 2021…
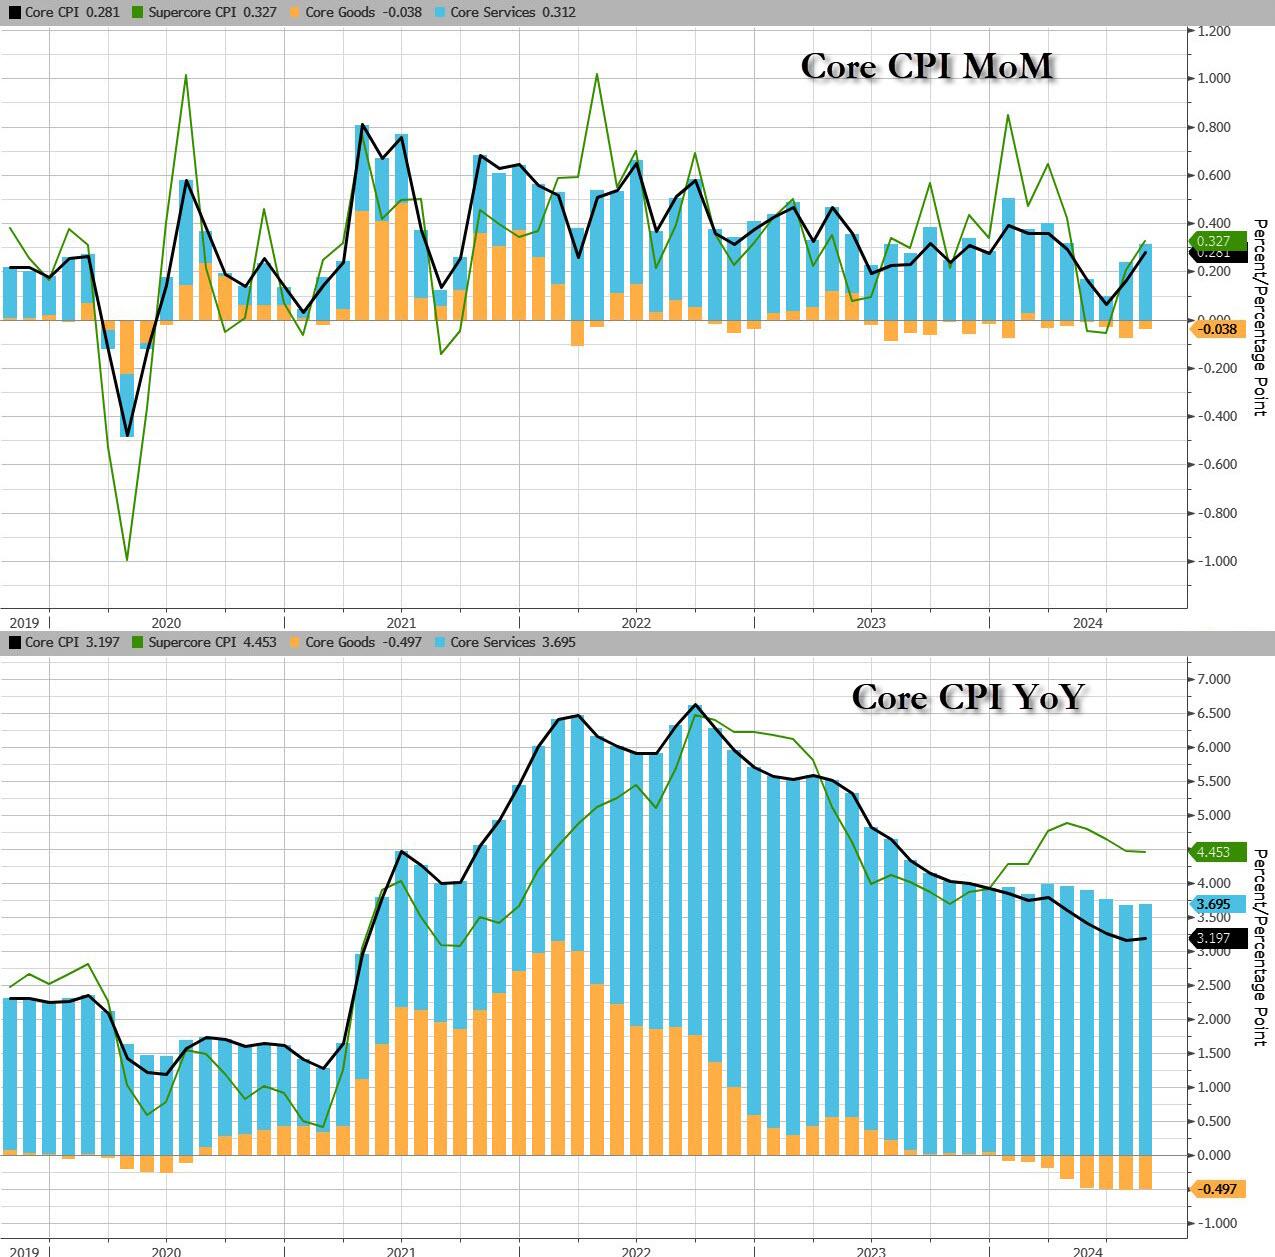
.. and the core….
…. as goods deflation is stalling and may even print positive in the coming months, while core service inflation remains the biggest driver.
That was s the 51st straight month of MoM increases in Core CPI, and a new record high.
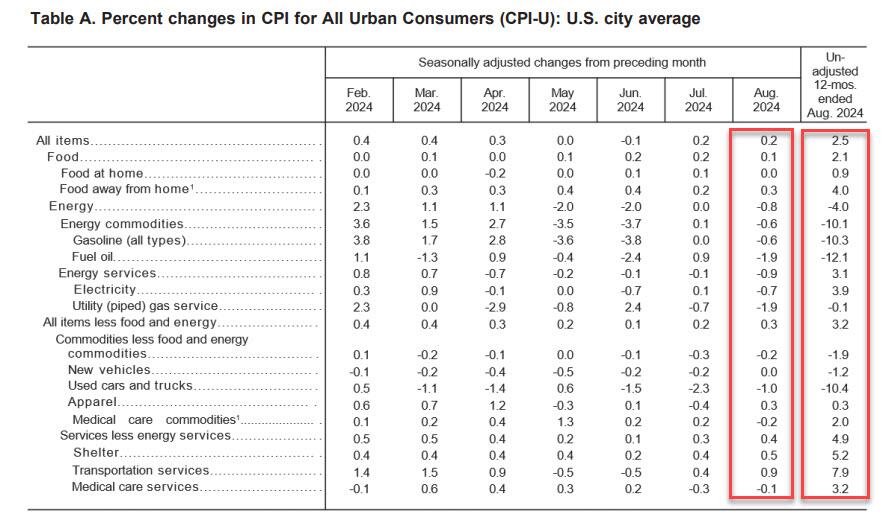
Under the hood, used car prices fell 1.0%, moderating from last month’s 2.3% drop, while airline fares jumped 3.9%, a big reversal to last month’s bizarre -1.2% drop. Car insurance costs jumped another 0.6%, after rising 1.2%; furniture prices dropped 0.3% reversing last month’s 0.3% rise.
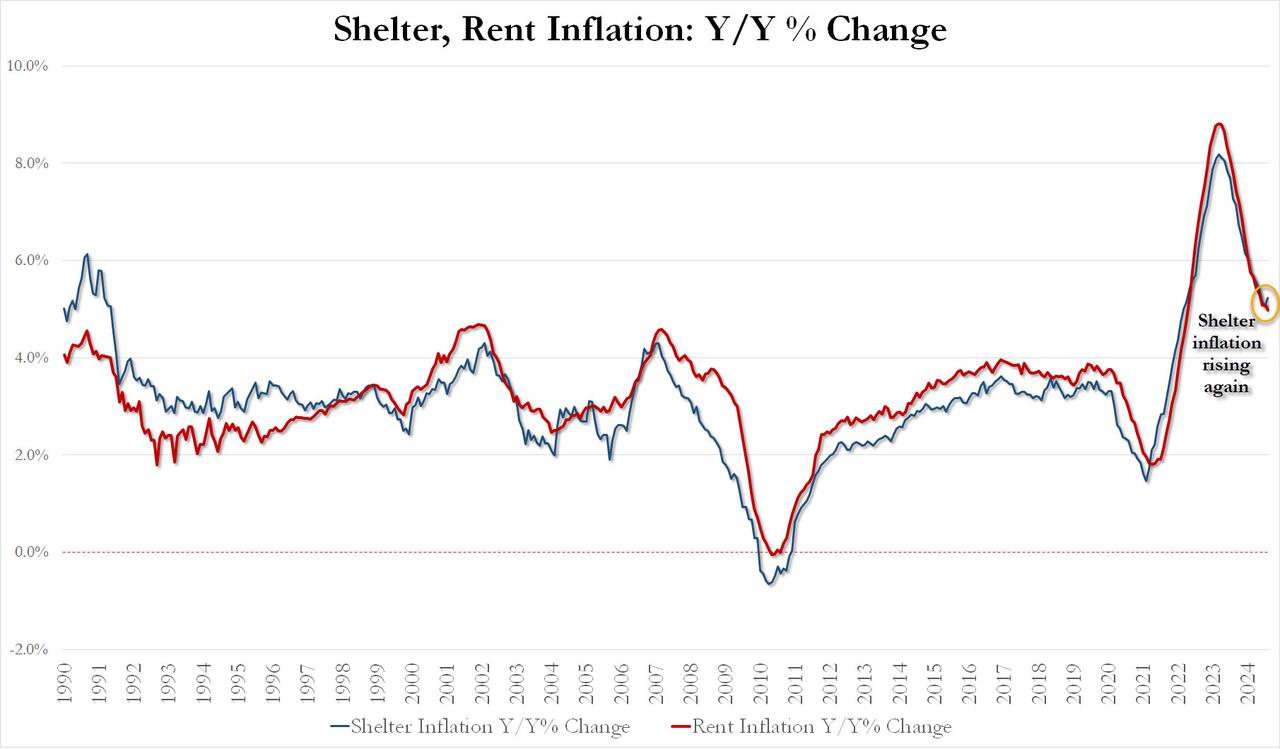
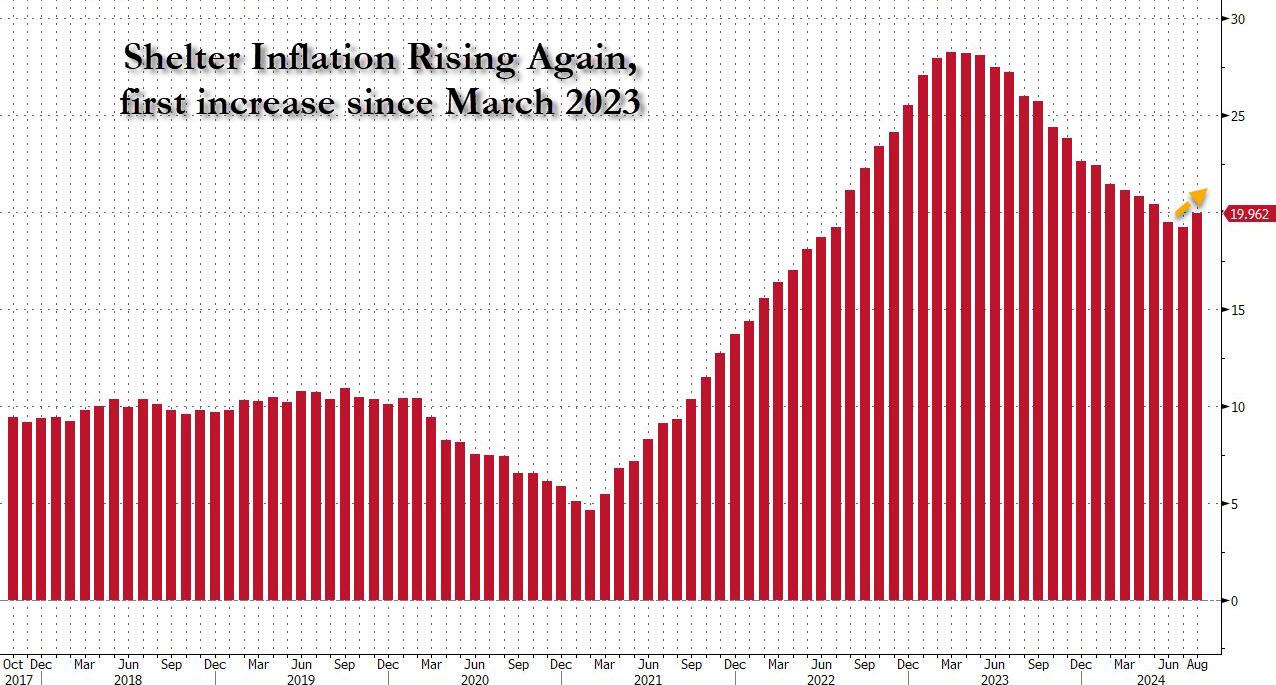
Perhaps more worrying is the fact that while rent inflation has flatlined, shelter inflation posted its first increase since early 2023!
August Shelter inflation up 0.43% MoM and up 5.23% YoY vs 5.05% in July
August Rent Inflation up 0.39% MoM and up 4.97% YoY vs 5.09% in July
And the first monthly increase since March 2023 highlighted:
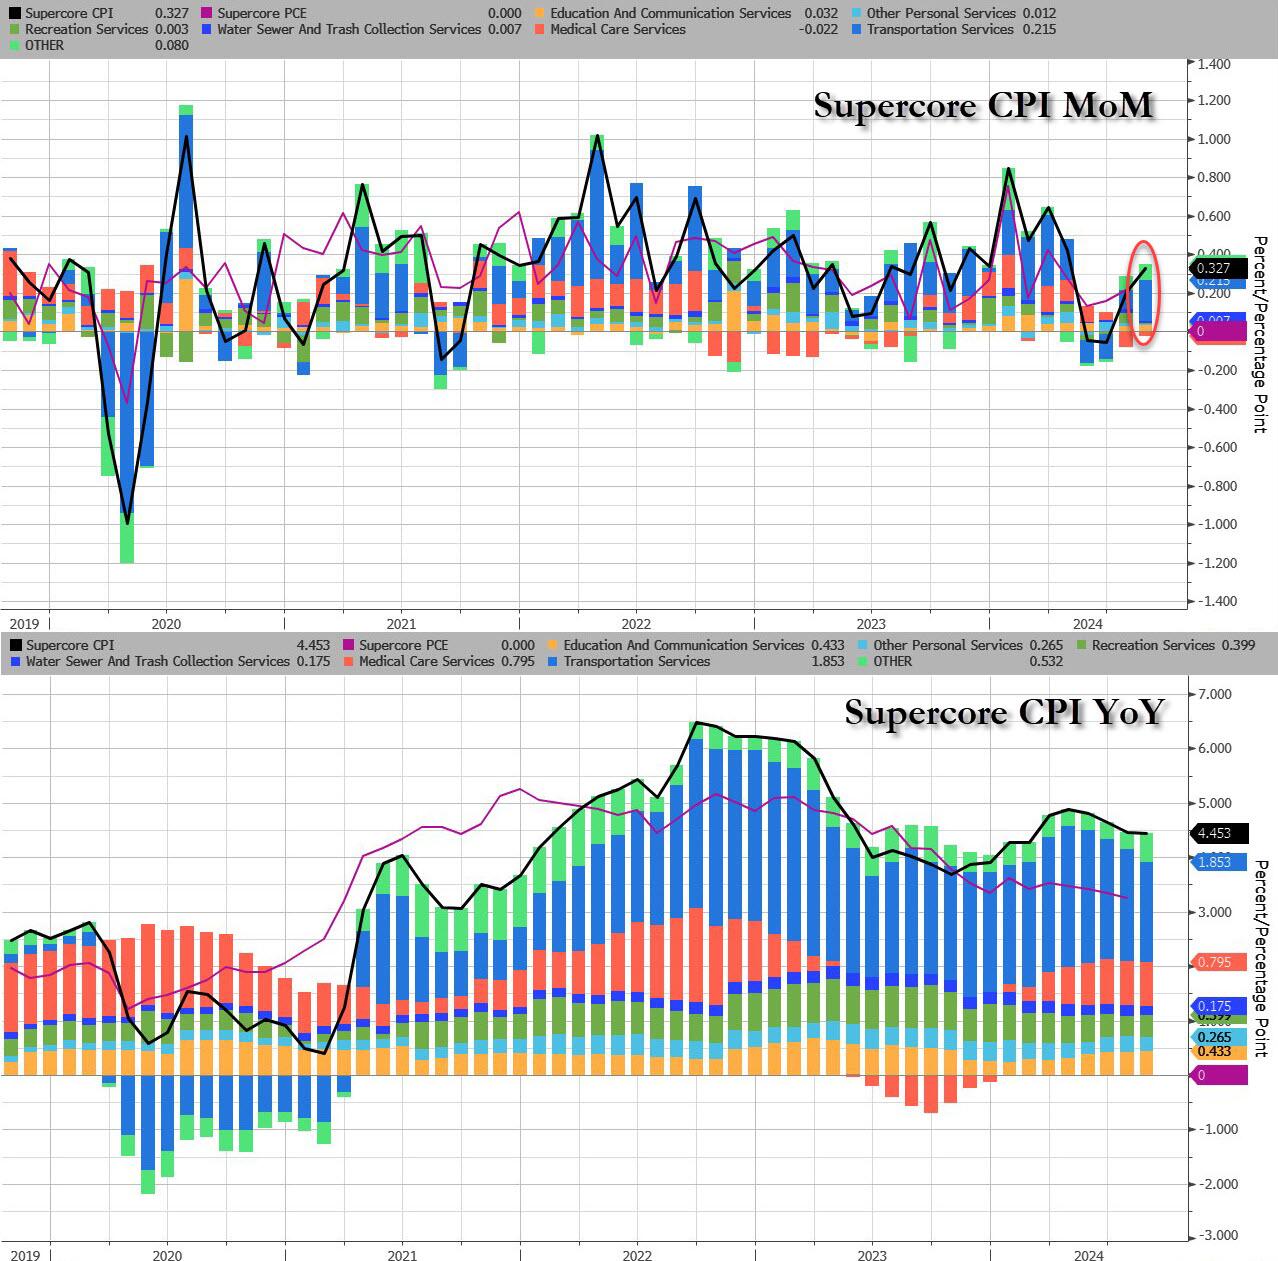
Last, but not least, and perhaps most ominous of all, is that while inflation refuses to be “killed” even as the Fed is about to start cutting rates, Supercore CPI rose 0.33% MoM, the biggest monthly increase since April, driven by continued acceleration in transportation services, which jumped the most in 5 months.
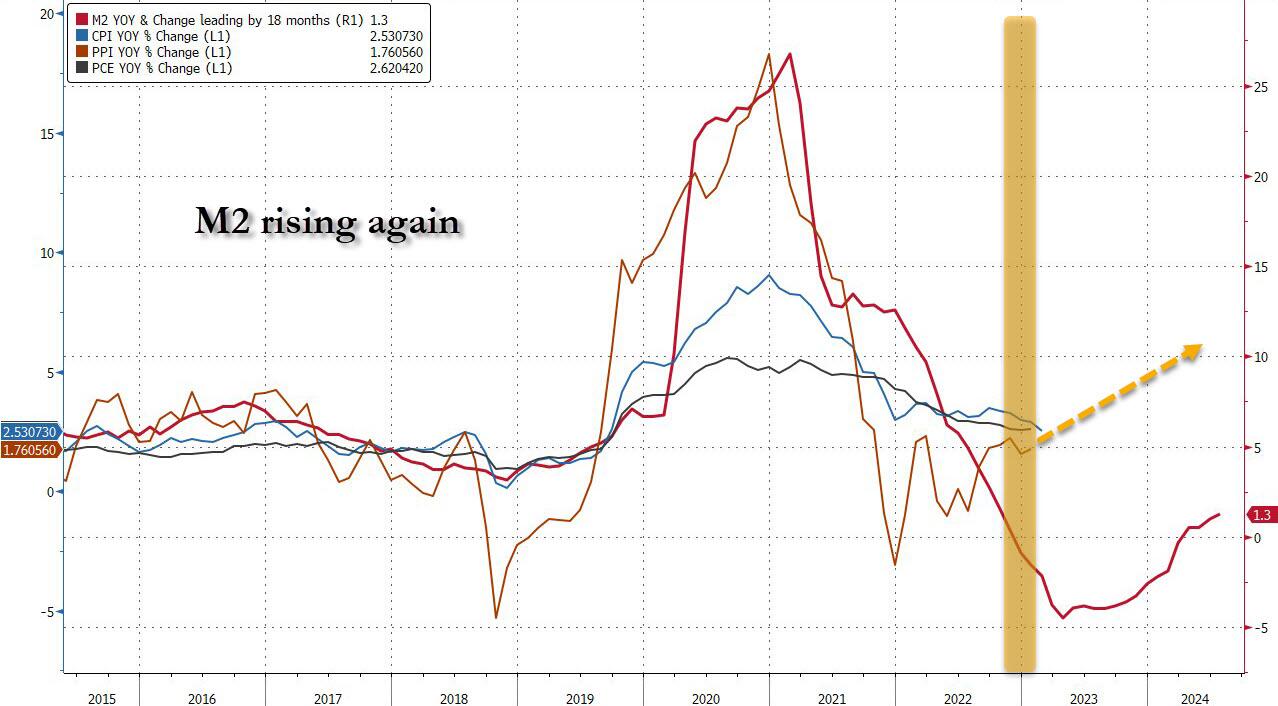
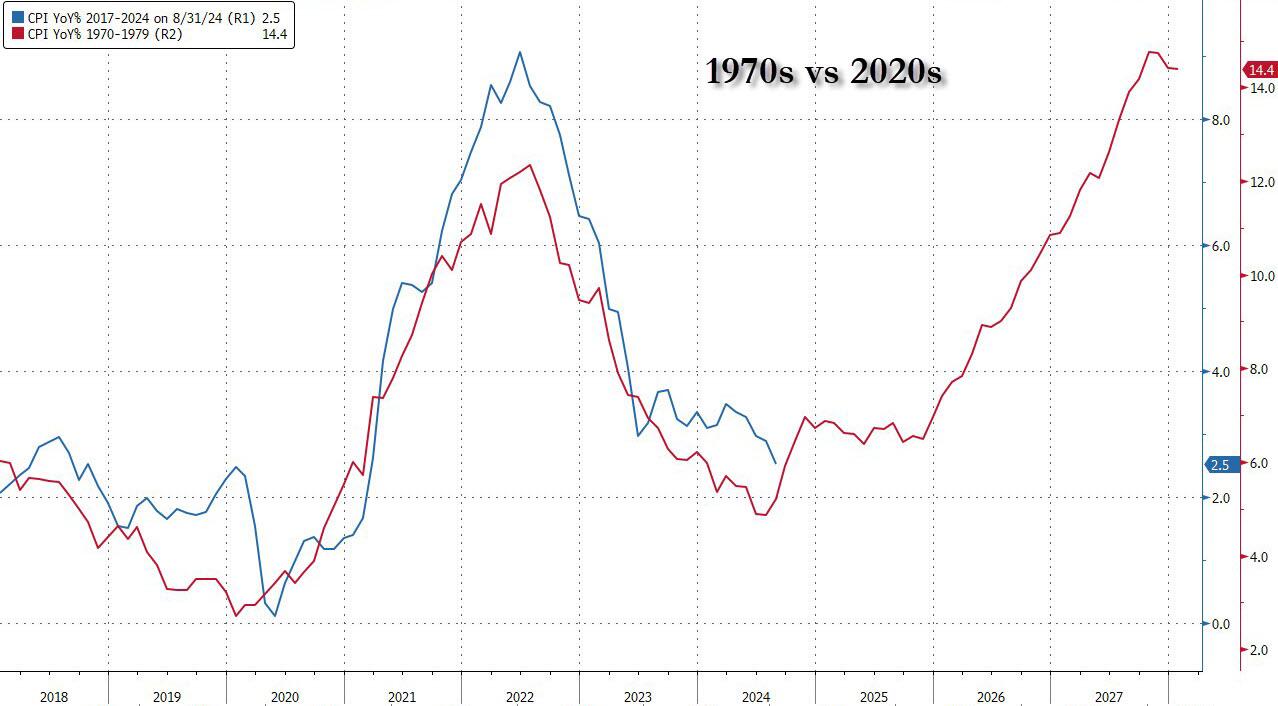
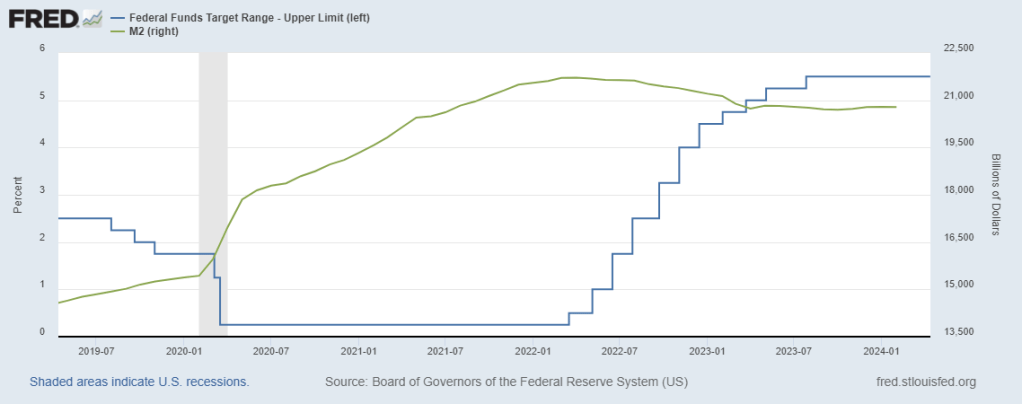
Finally, money supply growth is reaccelerating…
Which begs the question: how long until the Fed’s next easing cycle unleashes the Arthur Burns fed:
Putting it all together:
Underlying inflation unexpectedly picked up, as core CPI increased 0.3% from July, the most in four months, and 3.2% from a year ago
Only five of the 65 forecasts in Bloomberg’s survey called for a 0.3% increase in the core CPI. Almost everyone else was at 0.2%, and four had it at 0.1%. The five were right.
Shelter prices, the largest category within services, climbed 0.5%, the most since the start of the year and the second month of acceleration, defying widespread expectations for a downshift. Owners’ equivalent rent — a subset of shelter and the biggest individual component of the CPI — rose at a similar pace.
Airfares rose a hefty 3.9% in August after falling for the previous five months while costs for energy and used vehicles fell
Risk assets pumped and dumped and bond yields rose. S&P 500 futures dropped steeply immediately after the report came out, before paring losses. The yield on 10-year Treasuries advanced two basis points to 3.66%. The dollar wavered.
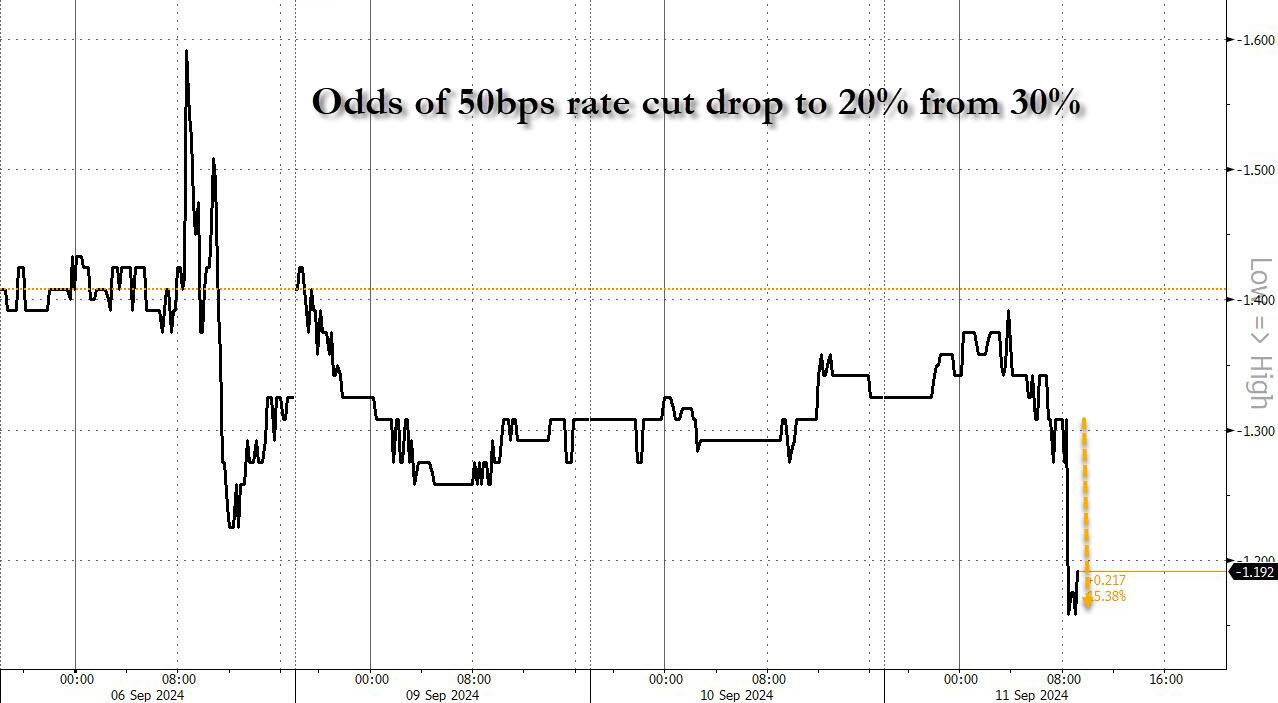
And while one can stick a fork in the market’s hopes for a 50bps rate cut (odds slumped from 30% to 20%… and from 50% last Friday)…
… the question remains: will the Fed really cut rates as shelter inflation inflects higher for the first time since 2023.
After last night’s ABC Presidential debate. Where Kamala acted like she was auditioning for part in the movie “Mean Girls” and the ABS moderators acted like pure Soviet-era Russian journalists.
Here is a breakdown of the annual cost of regulations:
And “China” Kamala (ChiKam) plans even MORE regulations!
Federal regulation’s total compliance costs and economic effects are at least $2.117 trillion annually in Ten Thousand Commandments’ estimate, and almost certainly higher.
An October 2023 National Association of Manufacturers (NAM) report models regulatory compliance at $3.079 trillion annually.
US households pay on average $15,788 annually in a hidden regulatory tax, which consumes 17 percent of income and 22 percent of household expenses.
These outlays exceed expenditures on health care, food, transportation, entertainment, apparel, services, and savings. Only the costs of housing, which stand at $24,298 annually, exceed regulation.
The higher NAM figure implies $22,962 per household, or 31 percent of the household expense budget.
The regulatory tax of $2.117 trillion rivals individual income tax costs estimated at $2.328 trillion for 2023 and stands at nearly four times the corporate income tax of $546 billion.
The NAM cost figure of $3.1 trillion annually would exceed the sum of both ($2.9 trillion).
If it were a country, US regulation would be the world’s 10th-largest economy, ranking behind Canada and ahead of Italy.
If we exclude the US economy from the list, the US regulation economy would be the ninth largest, still behind Canada and ahead of Italy.
The 10.34 billion hours Washington says it took to complete federal paperwork in 2022, according to the Information Collection Budget, translate to the equivalent of 14,883 human lifetimes.
The tally of final rules for 2023 stood at 3,018, which is the second-lowest count since at least 1976.
On the other hand, the Federal Register containing those rules surged to 89,368 pages, the second-highest tally on record and a 12 percent rise over 2022.
Although we have fewer new rules, they appear to be broader in scope.
During calendar year 2023, agencies issued 3,018 rules, whereas Congress enacted 68 laws. Thus, agencies issued 44 rules for every law enacted by Congress.
This Unconstitutionality Index—the ratio of regulations issued by agencies to laws passed by Congress and signed by the president—underlines how much agency lawmaking has replaced that of elected officials. The average ratio over the past 10 years is 23 rules for every law.
Since the Federal Register first began itemizing final rules in 1976, 217,565 have been issued. Since 1993, when the first edition of Ten Thousand Commandments appeared, agencies have issued 120,475 final rules.
A 2023 draft consolidated version of the White House Report to Congress on the Benefits and Costs of Federal Regulations caught up on fiscal years 2020–2022. The report for 2023 has still not been released.
A total of only 31 “major” rules had both benefits and costs quantified, and these add $13 billion to the annual regulatory cost bill; another 56 rules with costs but not benefits quantified add another $46 billion to annual costs.
Employing our lower estimate, regulatory burdens of $2.1 trillion amount to nearly 8 percent of US gross domestic product (GDP), reported by the Commerce Department at $27.36 trillion in 2023.
The NAM regulatory figure implies 11 percent of GDP.
Regulatory costs stand at over 60 percent of the level of corporate pretax profits of $3.523 trillion.
The NAM figure would take that to over 80 percent.
When regulatory costs of $2.1 trillion are combined with federal outlays of $6.135 trillion, the federal government’s share of the $27.36 trillion economy reaches at least 30 percent. State and local spending and regulation add to these costs.
Until April 2023, a subset of each year’s 3,000-plus rules was deemed economically significant, referring to annual economic effects of $100 million or more. Biden’s Executive Order 14094 (“Modernizing Regulatory Review”) eliminated that category and initiated a higher $200 million Section 3(f)(1) Significant category.
In the year-end 2023 edition of the twice-yearly Unified Agenda of Federal Regulatory and Deregulatory Actions, 69 federal departments, agencies, and commissions present 3,599 regulatory actions flowing through the pipeline as follows:
2,524 rules in the active (prerule, proposed, final) phase
431 recently completed rules
644 long-term rules
Of the 3,599 regulations in the fall 2023 Unified Agenda’s pipeline, 304 are Section 3(f)(1) Significant category rules (which implies at least $60 billion in economic impact), as follows:
233 rules in the active (prerule, proposed, final) phase
41 completed rules
30 long-term rules
Despite his own higher $200 million threshold, high-significance rules in the Biden pipeline outnumber the Bush, Obama, and Trump years when the lower $100 million threshold applied.
Major rules as defined in the Congressional Review Act leave a $100 million threshold intact despite Biden’s executive order. The Government Accountability Office database contains 76 finalized major rules for 2023. The Biden average exceeds those of Bush, Obama, and Trump.
Final rules affecting small business appear to be mounting and could generate calls for reform. Biden’s three years have averaged 870 rules annually in the Federal Register affecting small business, compared with 694 and 701 for Obama and Trump, respectively.
Of the 3,599 rules and regulations in the fall 2023 Unified Agenda pipeline, 690 affect small businesses; of those, 370 required an official “regulatory flexibility analysis.”
Biden-era mandates affect state and local governments at heights not seen in over a decade. Rules in the Unified Agenda pipeline affecting state governments stand at 507, while rules affecting local governments stand at 349.
The five most active rule-producing executive branch entities in the Unified Agenda—the departments of the Interior, the Treasury, Transportation, Commerce, and Health and Human Services—account for 1,497 rules, or 42 percent of all rules in the pipeline. The five most active independent agencies account for another 318 rules.
From the nation’s founding through 2022, more than 15,635 executive orders have been issued. Biden issued 24 executive orders in 2023, well below his peak 77 of 2021. Biden’s presidential memoranda continue to outstrip the average of recent predecessors.
Public notices in the Federal Register always exceed 22,000 annually, with uncounted guidance documents and other proclamations that hold potential regulatory effect among them, whereas other guidance documents issued do not appear in the Federal Register at all. In 2023, 23,197 notices were issued. There have been 714,563 public notices since 1994 and over a million since the 1970s.
DC bureaucrats are out of control. Treasury Secretary Yellen calls for $78 TRILLION to tackle climate change. So to quote The Carpenters, they’ve only just begun to regulate.
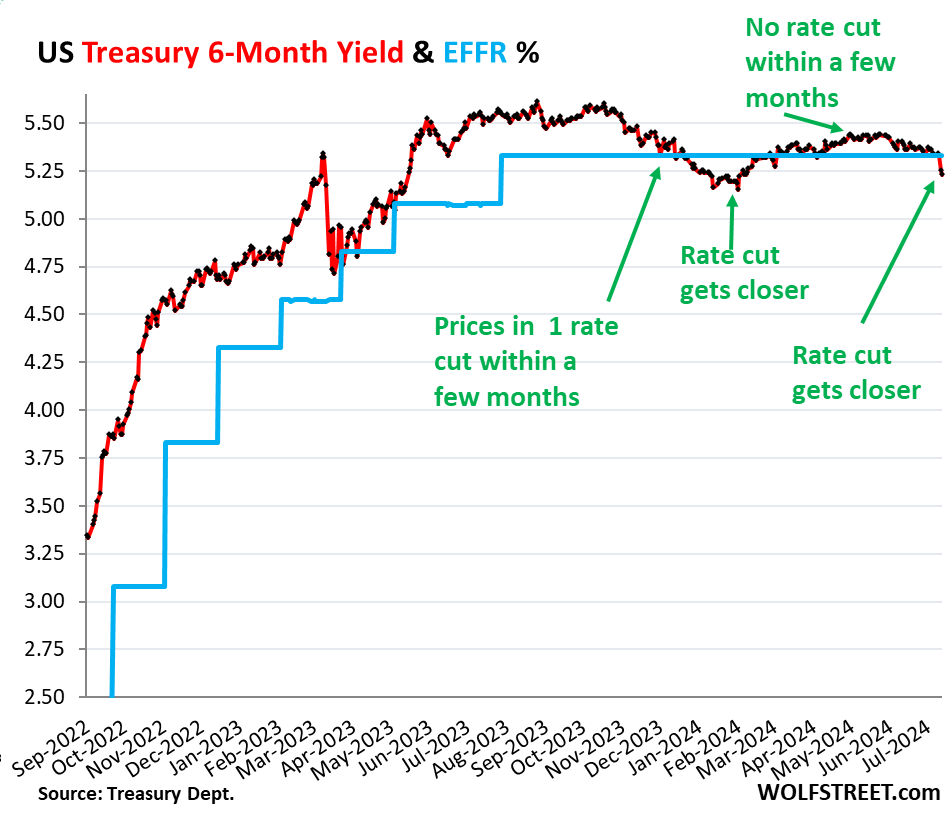
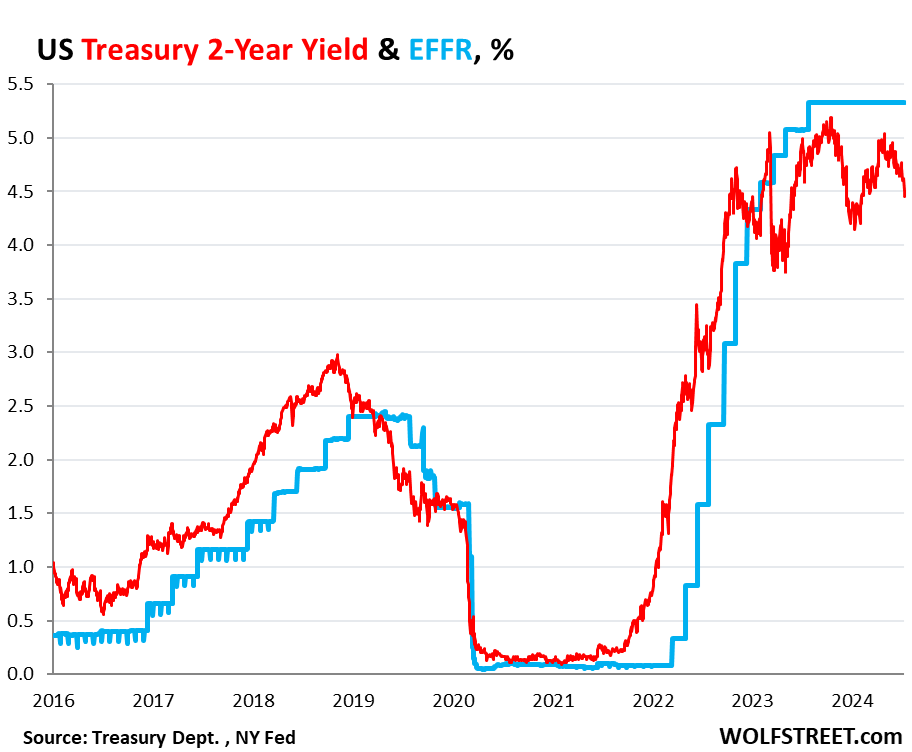
It brought the 6-month yield just a tad below the lower end of the Fed’s target range for the federal funds rate (5.25-5.50%), and below the effective federal funds rate (EFFR), currently 5.33% (blue in the chart below):
So the 6-month yield is now pricing in one rate cut within its 6-month window, more heavily weighted toward the first two-thirds or so of that window, after having already wrongly done so at the beginning of this year.
Back in late November through January, the 6-month yield had also priced in a rate cut within its 6-month window. By February 1, the yield had dropped to 5.15%, a sign the market was certain that there would be a rate cut at the March FOMC meeting.
But the market was wrong. Instead, we got a series of ugly inflation readings for January, February, March, and April, and there still hasn’t been a rate cut.
By March and April, with ugly inflation readings accumulating, rate cuts within the 6-month window of the 6-month yield were taken off the table.
May had provided a much softer inflation reading. And with Thursday’s CPI report of June, a rate cut within the 6-month window of the 6-month yield, weighted toward the first two-thirds of the window, was back on the table.
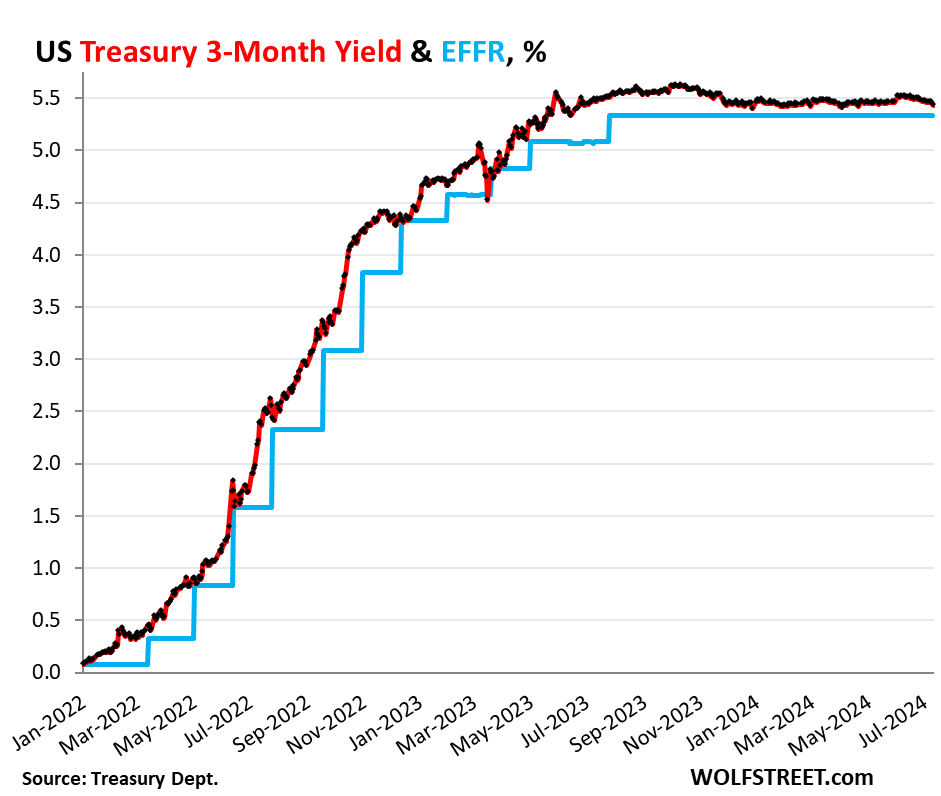
But the shorter-term Treasury yields are not pricing in a rate cut within their shorter windows. The shorter yields didn’t move much since the CPI report, and all were near the upper end of the Fed’s policy rates (5.5%), and all were above the EFFR (5.33%):
1-month yield: +1 basis point to 5.47%
2-month yield: +2 basis points 5.52%
3-month yield: -3 basis points to 5.43%
4-month yield: -5 basis points to 5.41%
In other words, the Treasury market is not expecting a rate cut in July at all, but sees a good chance of a rate cut in September, not as strong a chance as they saw in late January, when they saw a rate cut with near certainty by March that never came.
The three-month yield is not seeing any rate cuts within the first two-thirds of its window. No rate cut in July, and the September 18 FOMC meeting statement is beyond the first two-thirds of the window and has less impact on the current three-month yield:
The market for the 2-year yield has been wrong all along.
The 2-year Treasury yield demonstrates how wrong the Treasury market has been all along about the Fed’s rate hikes and rate cuts: it expected far fewer and smaller rate hikes than what the Fed eventually did. And then without ever rising to the level that would price in the actual rates that the Fed has held for nearly a year, it started pricing in rate cuts before the Fed even stopped hiking rates.
So back in April 2022, the two-year yield was about 2.5%. Now, today, 2.5% sounds like a lousy yield, but back then – after 15 years of near-0% interrupted by a few years of higher yields that maxed out at around 2.4% in 2019 – 2.5% sounded pretty good, and the market thought that was getting pretty close to the Fed’s terminal rate.
In February 2022, before the Fed’s rate hikes started, Goldman Sachs predicted that the Fed would hike seven times in 2022, each by 25 basis points, and then in 2023 three times by 25 basis points each, one hike per quarter, to reach a terminal target range for the federal funds rate of 2.5-2.75% by Q3 2023.
The Fed ended up doing more double that, and by July 2023.
So the 2-year Treasury note that sold at auction in April 2022 with a coupon of 2.5% and with a yield close to that sounded like a good deal, and we, being part of the Treasury market, nibbled on some too. Two years was as long as we went. The rest of our Treasuries are T-bills.
Those 2-year notes matured in April 2024, and we got paid face value, and we earned about 2.5% in interest each year over those two years. The entire market was wrong – and so were we. The Fed would raise to 5.25-5.5% by July 2023, more than double the yield we received, and its rate is still there, and the yields of our two- three- and four-month T-bills have by far outrun our 2-year note.
The 2-year yield closed at 4.45% on Friday. The market never once came even close to betting that the Fed would hold rates above 5% for long, and they’ve been above 5% for over 14 months. And the 2-year yield has been below the EFFR for almost the entire time since January 2023, having turned into the Doubting Thomas.
The market was wrong about the Fed’s rates, and all 2-year notes that were bought at auction and that matured in 2024 or will mature in 2024 were a lousy deal. Buyers would have been better off with a series of short-term T-bills that stick closely to Fed’s actual policy rate — rather than follow market projections.
Someday, the market is going to get the rate-cut bets right. But it will only take a few more lousy inflation readings for the rate cuts to get moved further into the future. On Friday, the PPI showed up with red-hot services inflation, now delineating a clear U-Turn in December. Producers that pay those higher prices for services will try to pass them on, and so they may ultimately filter into consumer prices and higher inflation readings over the next few months. Or if producers cannot pass on the higher costs of services, their margins will get squeezed.
Inflation is unpredictable. Once inflation has broken out in a big way, as history shows us, it tends to come in waves and tends to dish up nasty surprises. And it already has dished up nasty surprises multiple times so far, including each of the first four months of this year.
During the first three months of 2023, U.S. office vacancy topped 20 percent for the first time in decades. In San Francisco, Dallas, and Houston, vacancy rates are as high as 25 percent. These figures understate the severity of the crisis because they only cover spaces that are no longer leased. Most office leases were signed before the pandemic and have yet to come up for renewal. Actual office use points to a further decrease in demand. Attendance in the 10 largest business districts is still below 50 percent of its pre-COVID level, as white-collar employees spend an estimated 28 percent of their workdays at home.
A new report from Moody’s offers yet another grim outlook that the commercial real estate downturn is nowhere near the bottom. Elevated interest rates and persistent remote and hybrid working trends could result in around 24% of all office towers standing vacant within the next two years. The office tower apocalypse will result in more depressed values that will only pressure landlords.
“Combining these insights, with our more than 40 years of historic office performance data, as well as future employment projections, our model indicates that the impact on office demand from work from home will be around 14% on average across a 63- month period, resulting in vacancy rates that peak in early 2026 at approximately 24% nationally,” Moody’s analysts Todd Metcalfe, Anthony Spinelli, and Thomas LaSalvia wrote in the report.
In a separate report, Tom LaSalvia, Moody’s head of CRE economics, wrote that the office vacancy rate’s move from 19.8% in the first quarter of this year to the expected 24% by 2026 could reduce revenue for office landlords by between $8 billion and $10 billion. Factor in lower rents and higher costs, this may translate into “property value destruction” in the range of a quarter-trillion dollars.
In addition to remote working trends, Moody’s analysts pointed out that the amount of office space per worker has been in a “general downward trend for decades.”
At the peak of the Dot-Com boom, office workers used an average of 190 sq ft. The figure has since slid to 155 sq ft in 2023.
“The argument for maintaining or even increasing remote work practices remains compelling for many businesses,” the analysts said, adding, “If productivity remains stable and costs can be reduced by forgoing physical office spaces, the rationale for mandating in-office attendance diminishes.”
Related research from the McKinsey Global Institute forecasts that office property values will plummet by $800 billion to $1.3 trillion by the decade’s end.
Moody’s expects vacancy rates to top out as office towers are demolished or converted to residential ones in the coming years.
“Right-sizing will continue over the next decade as the market shakes out less efficient space for flexible floorplans that support our relatively new working habits,” they said.
Earlier this year, Goldman analyst Jan Hatzius pointed out that a further 50% price decline would make office tower conversions financially sensible.
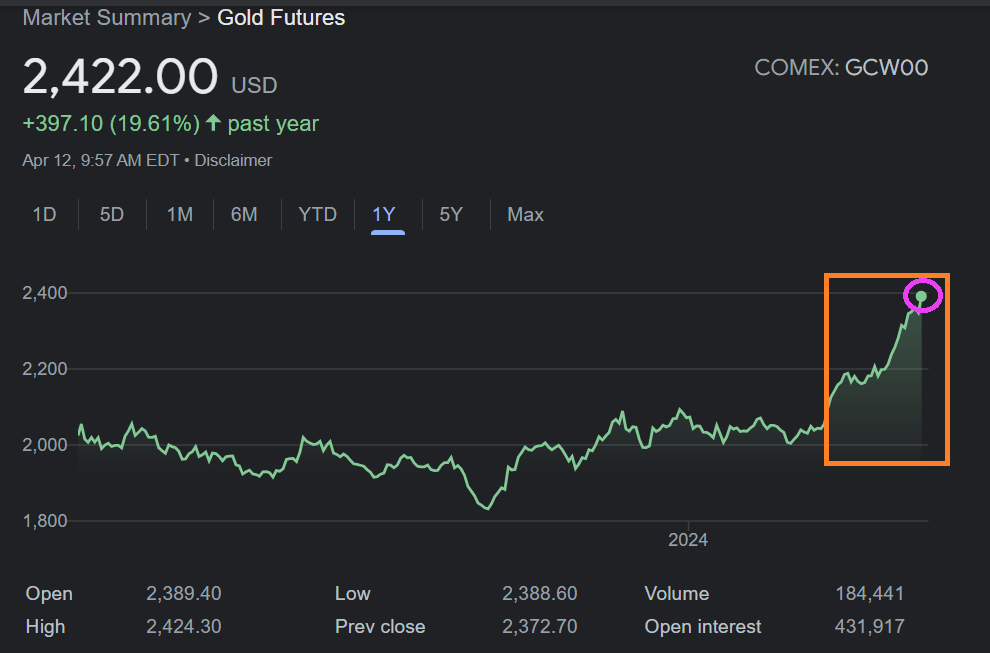
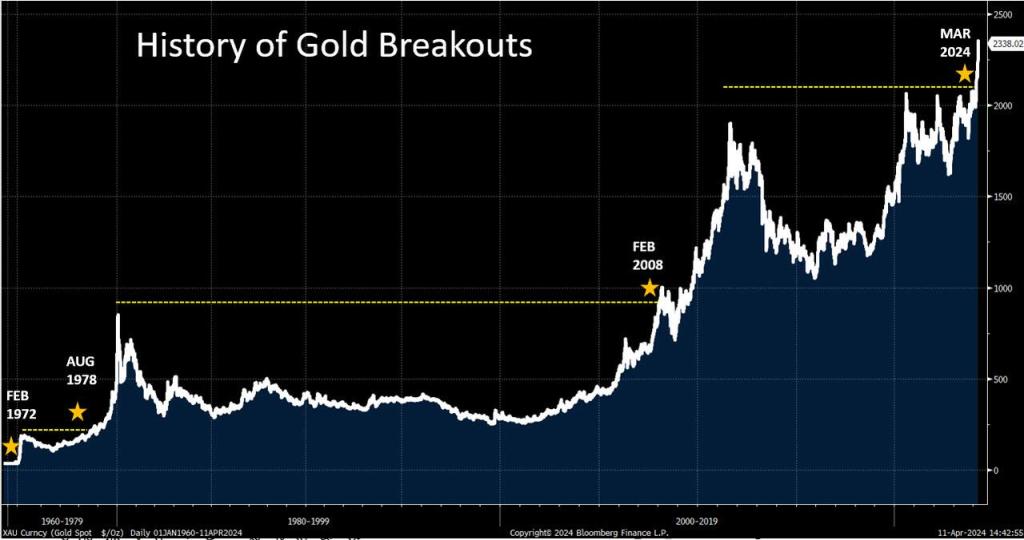
Gold futures prices are soaring and are at $2,422.00. Gold futures prices are up 19.61% over the past year.
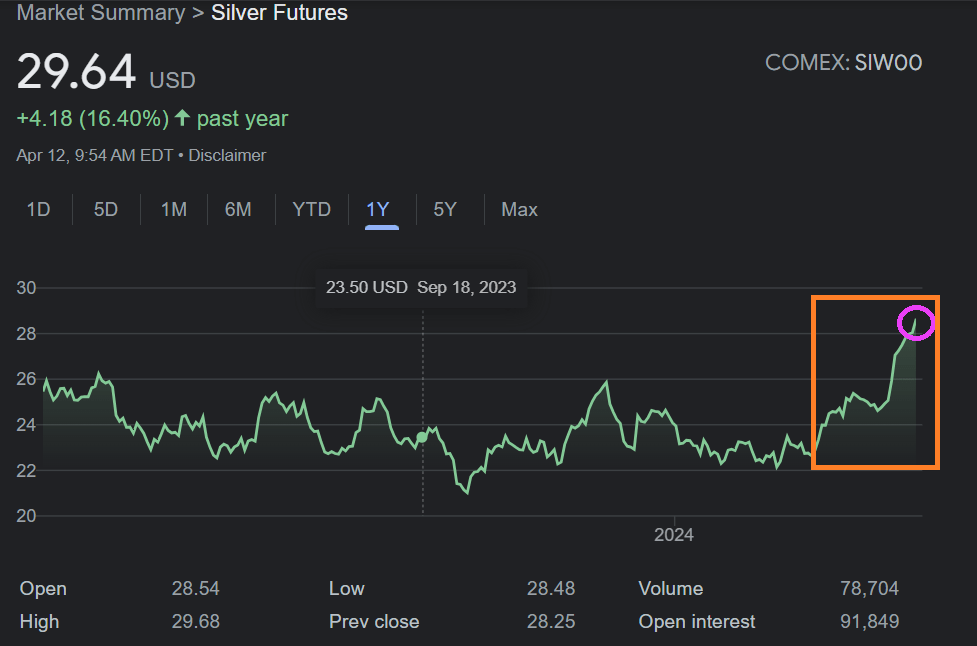
Silver futures prices are also soaring and are at $29.64. Silver futures prices are up 16.40% over the past year.
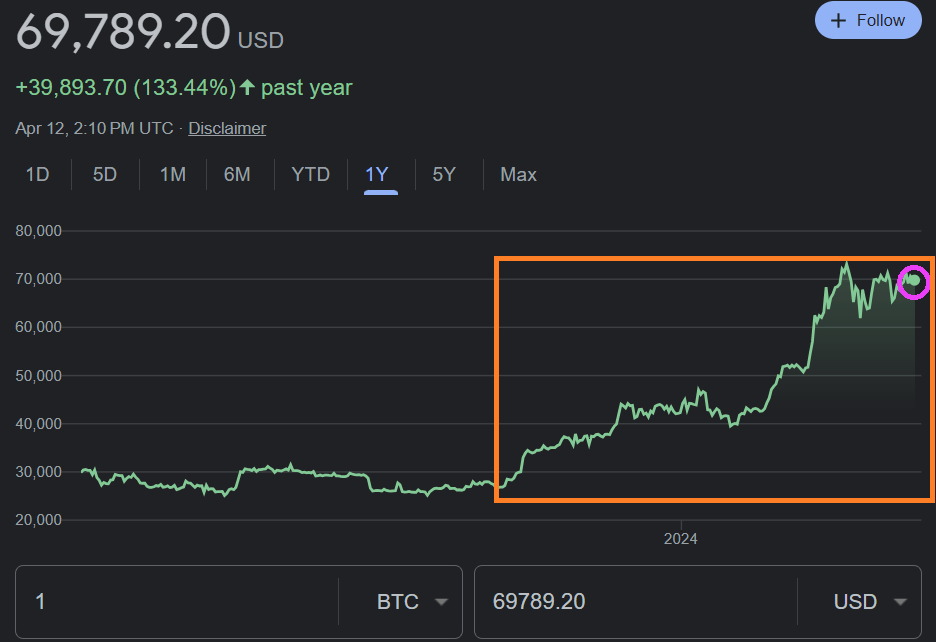
Bitcoin is almost at $70,000 and is up 133.44% over the past year.
Returning to gold, we are seeing another gold breakout, like the breakout in 2008.
Even central banks are loading up on gold, silver, and cryptos. Why? Primarily fear of US reckless budgets and exploding debts/deficits (don’t listen to Biden talk about how “he” reduced deficits and debt (both have risen to dangerous levels under he inattentive eyes).
However, calming the jangled nerves of pension funds is that the S&P 500 stock market index is up 26.04% over the past year.
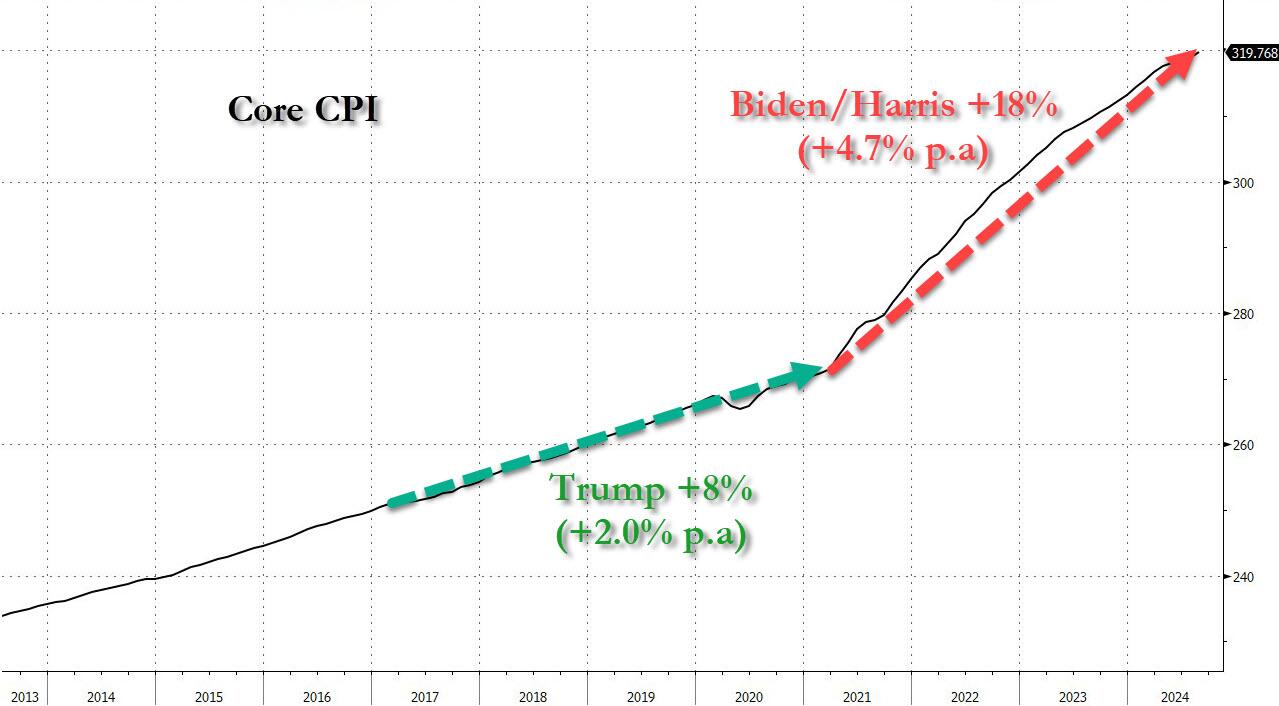
Overall prices are up by 19.4% since Biden took office.
Of course, the S&P 500 is not sustainable given that it has been driven by excessive spending by the Biden Adminstration coupled with still massive monetary stimulus from The Federal Reserve.
In summary, gold, silver and cryptos are rising on FEAR! Of Biden, Congress and The Fed.
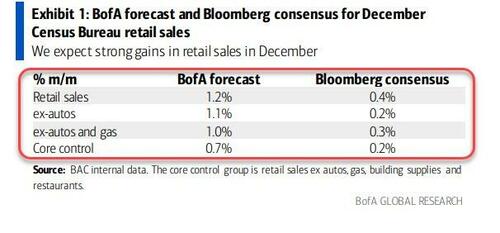
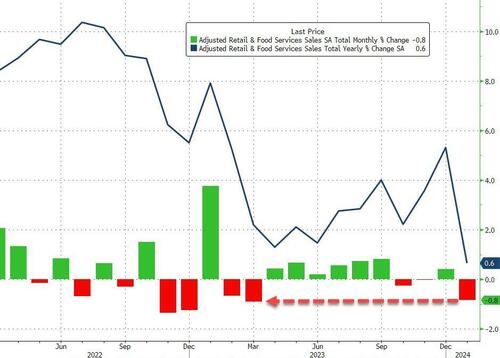
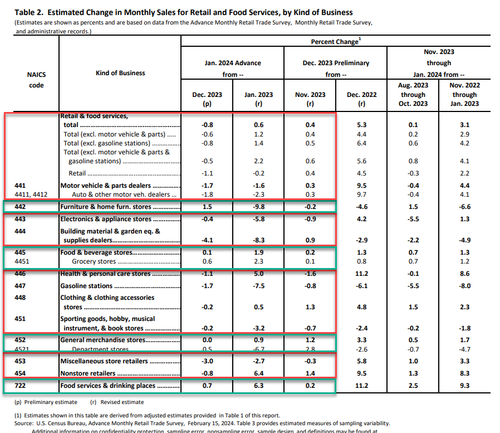
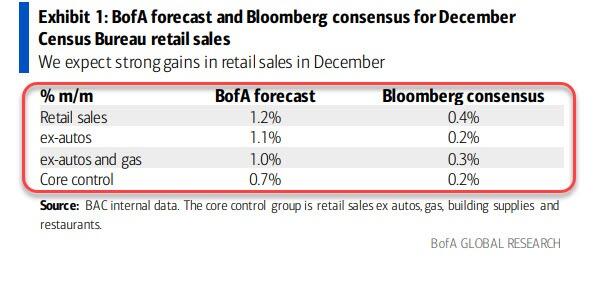
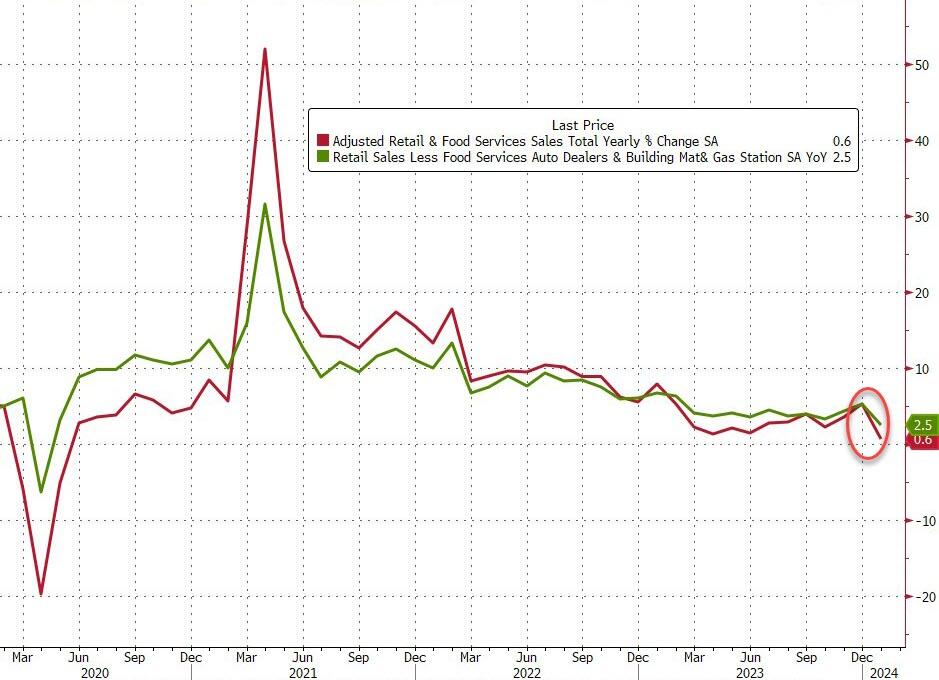
After they unexpectedly surged in November and December (driven in large part by a jump in Food Services), headline retail sales in January were expected to decline just 0.2%, but BofA nailed it once again with a large 0.8% MoM drop. That dragged the YoY retail sales down to just 0.6%…
Source: Bloomberg
That is the worst monthly decline since March 2023 and worst YoY rise since May 2020.
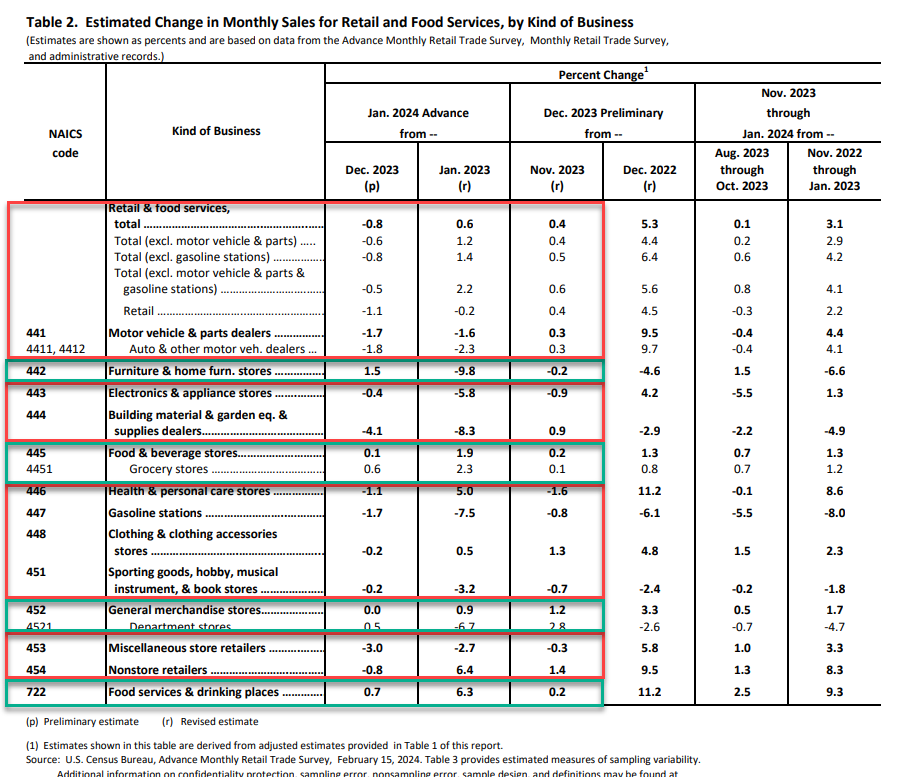
It wasn’t pretty…
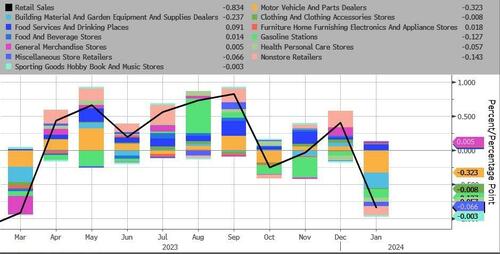
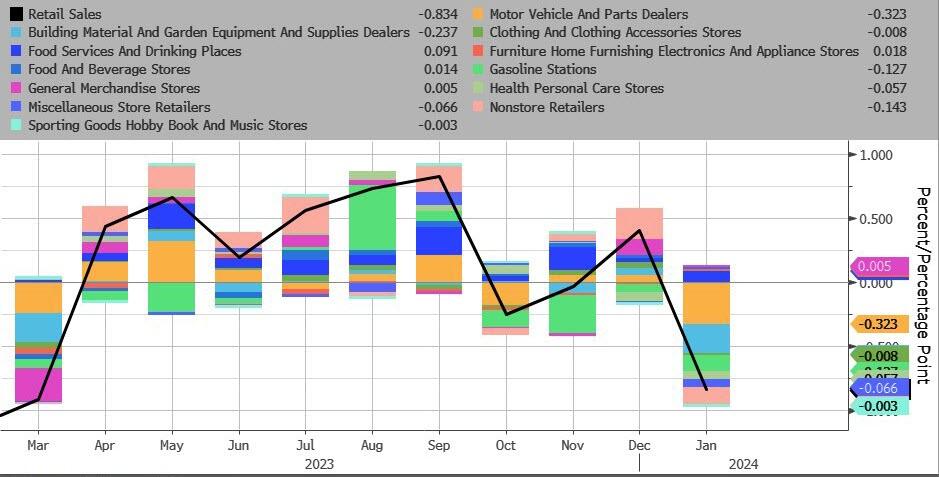
Motor Vehicles and Parts and Building Materials saw the largest decline MoM…
Source: Bloomberg
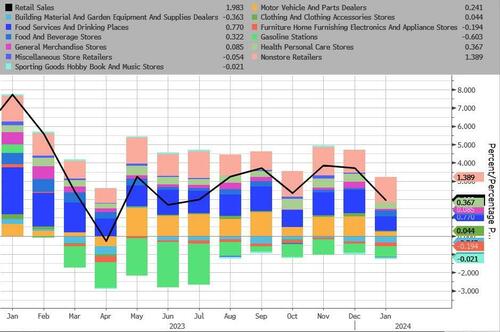
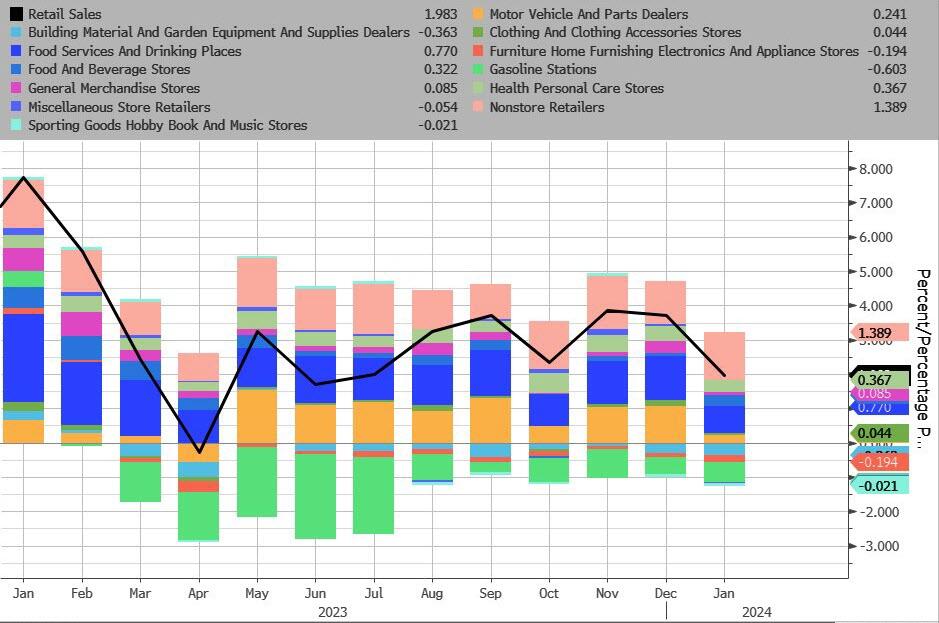
On a YoY NSA basis, Gas Stations and Building Materials were the biggest drag, while online retailers and Food Services were the biggest upside drivers…
Source: Bloomberg
Core Retail Sales also declined (-0.5% MoM vs +0.2% exp), which dragged the YoY levels down to their lowest since the COVID lockdowns…
Source: Bloomberg
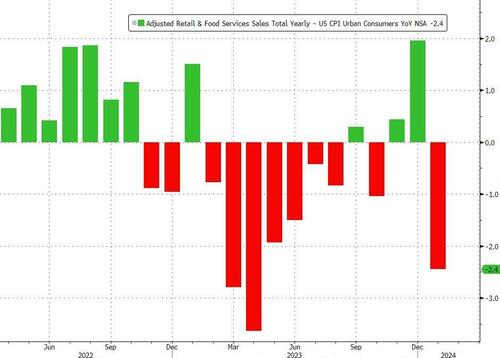
Adjusted (crudely) for inflation, this was a huge drop in ‘real’ retail sales. REAL retail sales have declined for 11 of the last 15 months – in other words, on a crude basis (Ret Sales – CPI), Americans aren’t buying more shit.
Source: Bloomberg
Finally, the control group – used to feed through to the GDP calculation – tumbled 0.4% MoM (vs expectations of +0.2%).
Soft-landing morphing into a stagflationary crash-landing?


You must be logged in to post a comment.