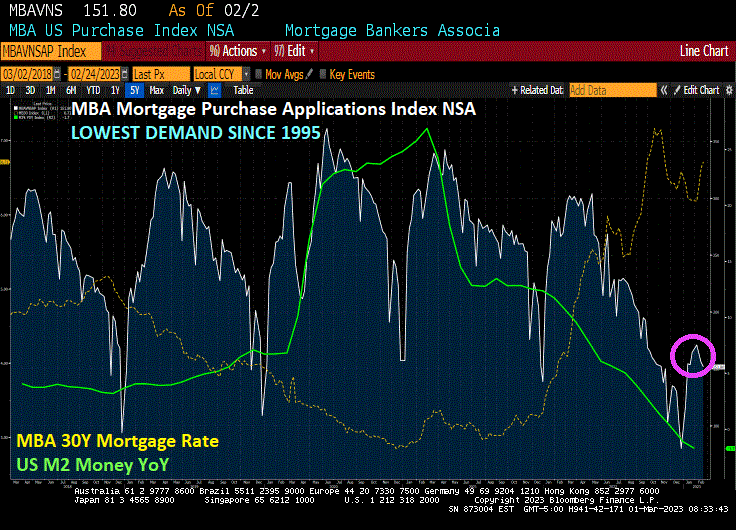
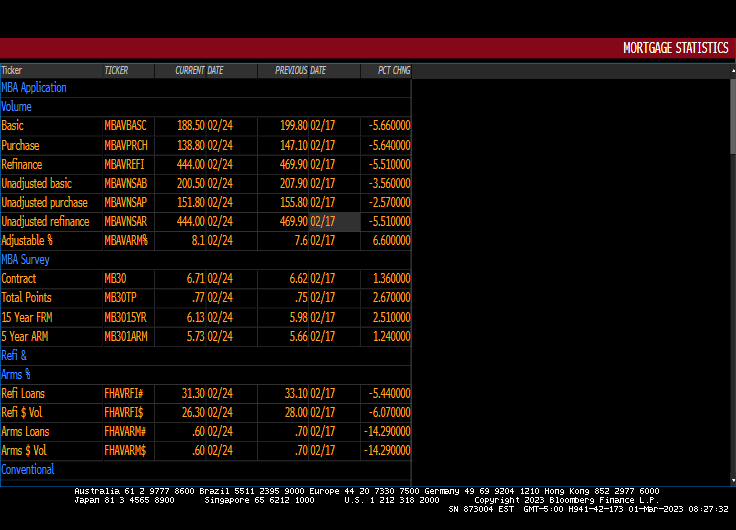
Today’s mortgage application (demand) numbers from the Mortgage Bankers Association was disappointing to say the least. Mortgage purchase demand just sank to it lowest level since 1995.
Typically, mortgage purchase applications peak in May or June of each year before beginning their annual lemmings drive downwards. But this year is seeing a early turn for the worse.
The unadjusted Purchase Index decreased 3 percent compared with the previous week and was 44 percent lower than the same week one year ago. The Refinance Index decreased 6 percent from the previous week and was 74 percent lower than the same week one year ago.
The Fed is hell bent on removing the punch bowl to fight inflation. Looks like Biden’s economic plan is turning the punch bowl into a dust bowl.
Sweet home DC! At least for the ruling elites. For the rest of us mortals, Bidenflation is crushing our finances.
To combat Bidenflation, The Fed has signaled that they will continue to raise interest rates. But at what cost?
(Bloomberg) — The world’s leading central banks are finally pushing their interest rates into restrictive territory, causing fears of overkill in financial markets and stoking chatter that policymakers may need to pivot at some point.
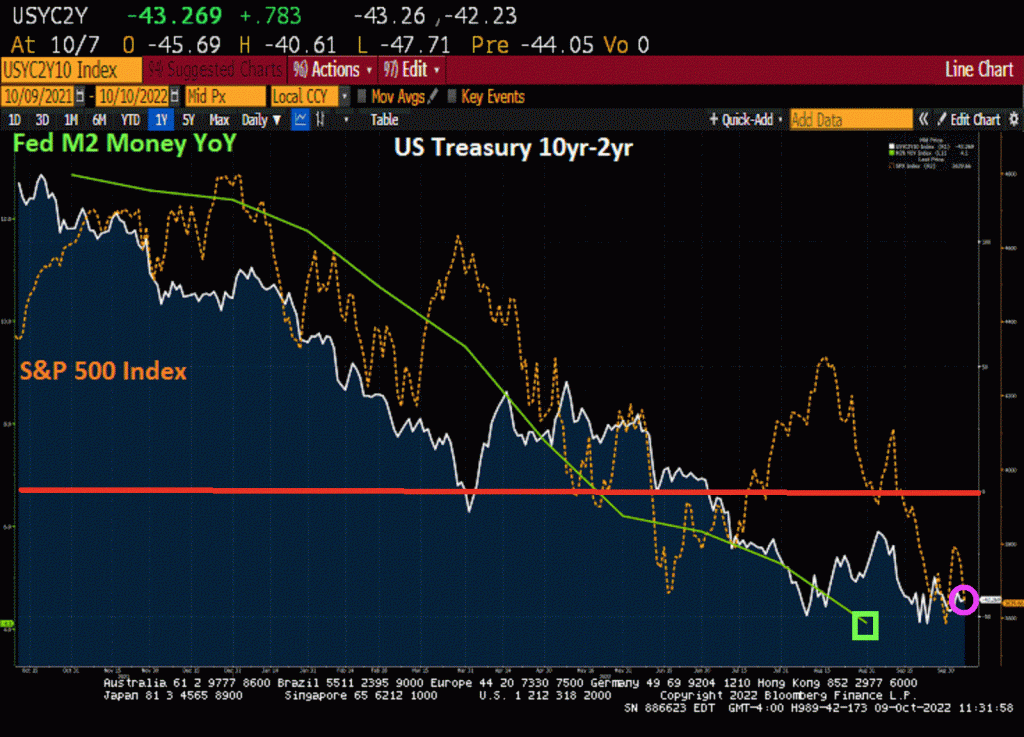
And with the withdrawal of monetary stimulus comes the slowdown of US M2 Money growth (green line). And with that slowdown, we see a declining stock market and an inverted US Treasury yield curve.
Of course, Biden could reverse his green energy agenda and allow for oil and natural gas exploration … again. Or begin building nuclear power plants again. But nooooo.
Another peril is rising mortgage rates.
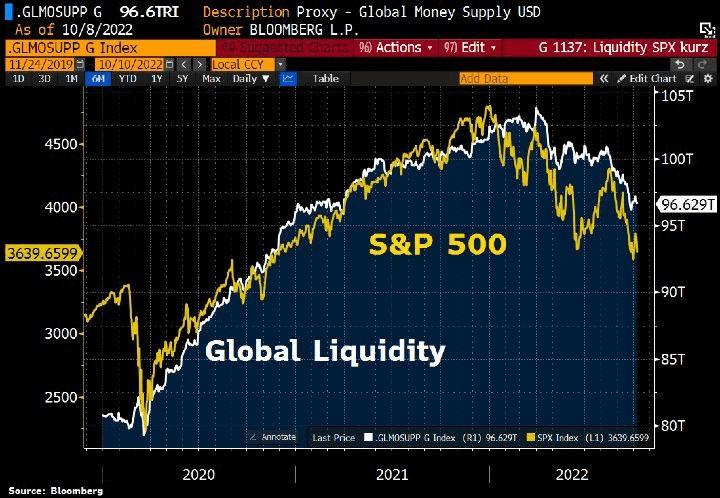
Here is the S&P 500 against global liquidity.
Speaking of Freddie King, here is Joe Biden’s favorite song: hideaway.
Yesterday, I told my family “The good news is that Rotolo’s Pizza tastes even better reheated in the morning. The bad news? I ate the only two piece left.”
Which brings me to the September jobs report. The good news is that 263k jobs were added to the US economy. That means 10,521k jobs have been added in the 21 months under Biden! (Bear in mind that 12,100k jobs were added in the 7 months under Trump following the Covid economic shutdown, yet no media outlet trumpeted that accomplishment).
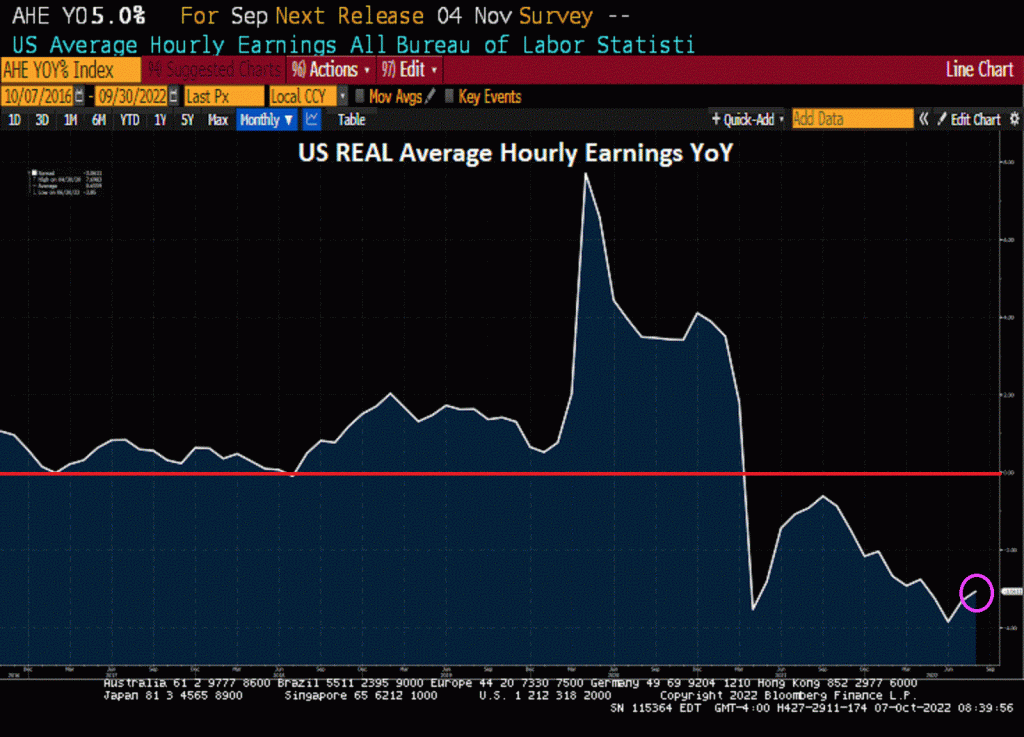
The bad news? While nominal average hourly earnings grew by 5% YoY, when I subtract Bidenflation from that number I get -3.06% growth. Or should I say that REAL wages are shrinking under Biden.
Now for the “Biden Miracle” of jobs being added. Here is a chart of NFP jobs added (white line) against M2 Money and headline inflation. Both The Fed and the Federal government pumped trillions into the economy leading to the highest inflation rate in 40 years. Once governments stopped with their Covid shutdown nonsense, jobs would return regardless of who was President. BUT Federal spending and Fed money printing went off the rails in early 2020.
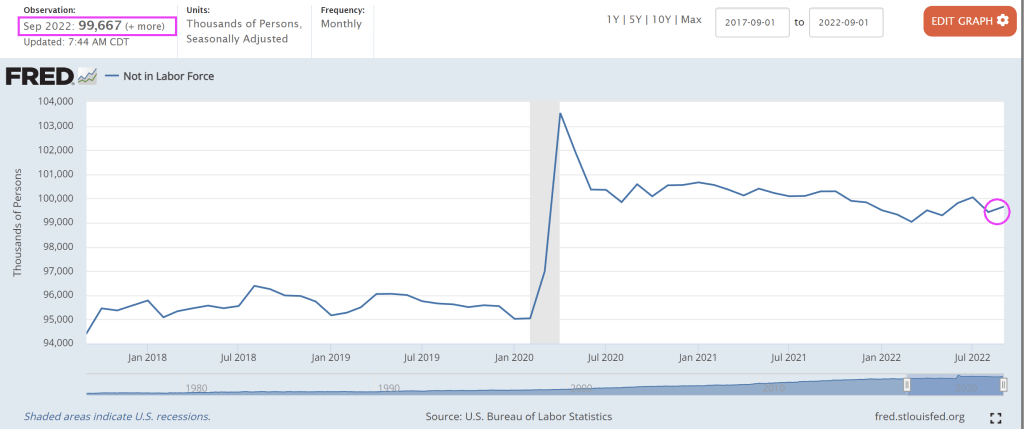
As Paul Harvey used to say, “Here is the rest of the story.” Labor force participation fell in September and the U-3 unemployment rate fell slightly to 3.5%.
But labor force dropouts increased leading U-3 unemployment to decline. The number of people NOT in the labor force grew to nearly 100 million. Nothing has been the same since Covid.
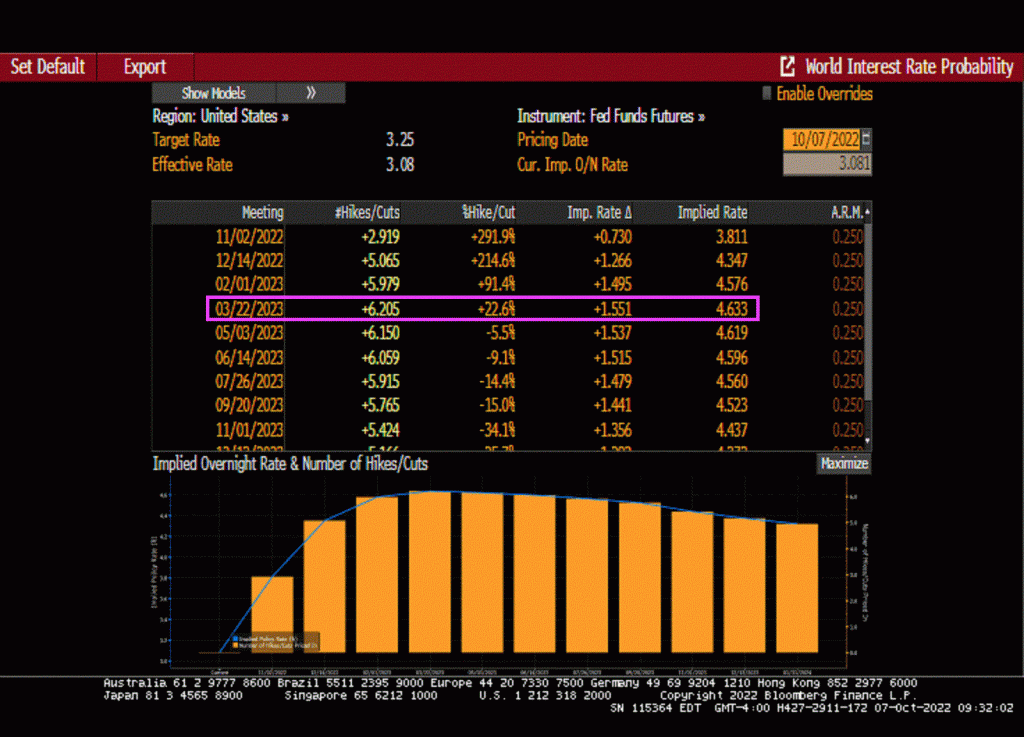
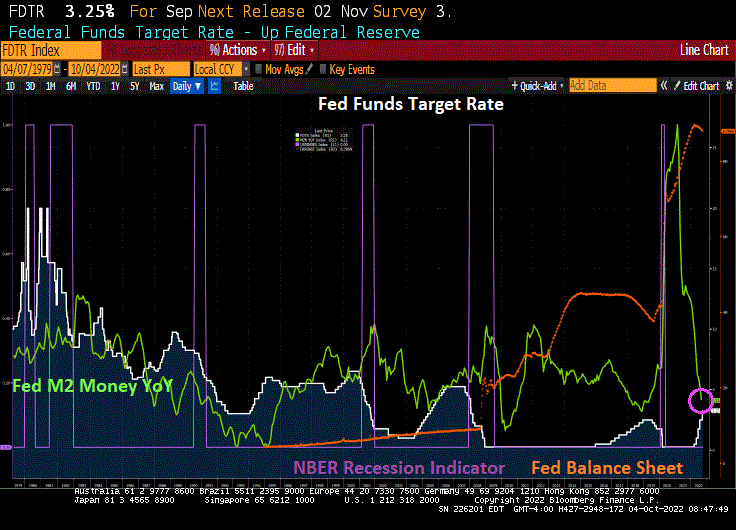
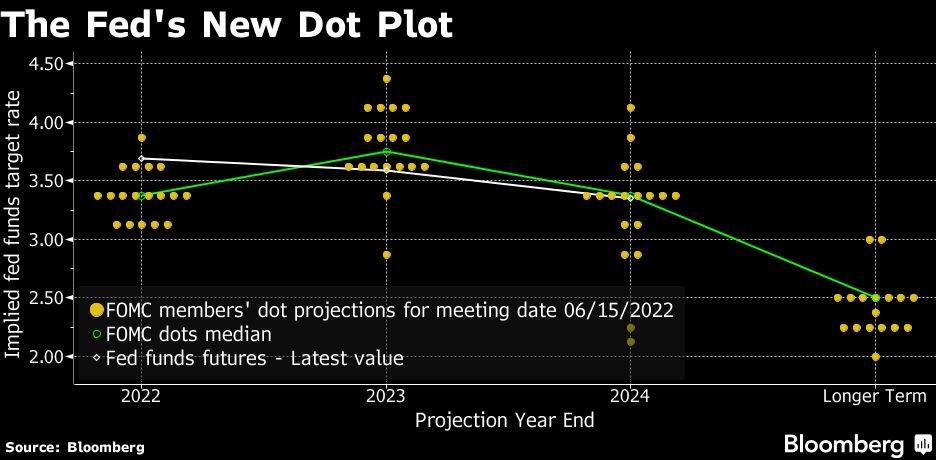
So what will The Fed do? According to Fed Funds Futures data (WIRP), The Fed will keep raising rates until March ’23 then slowly start lowering interest rates again.
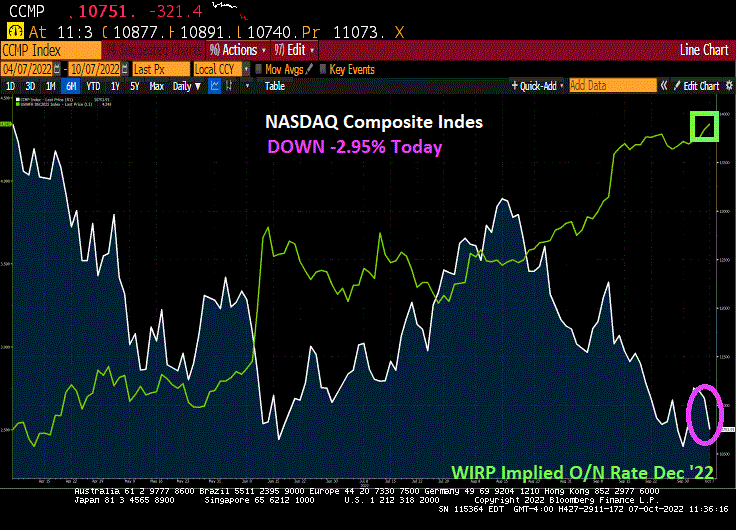
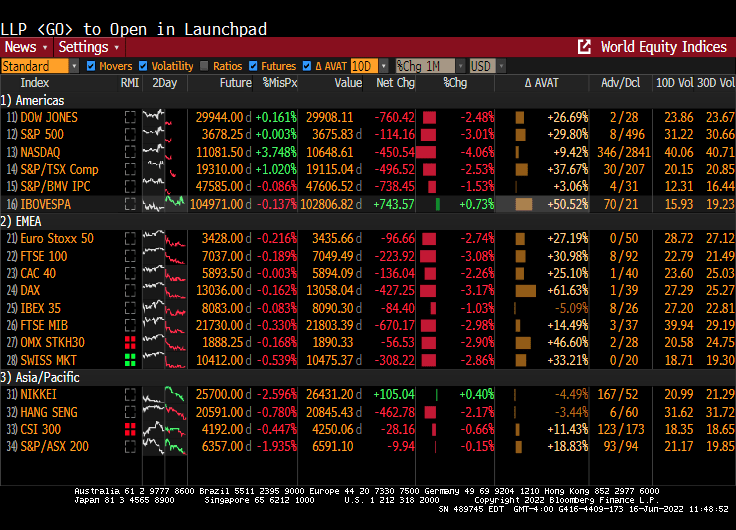
And with that “positive” jobs report, The Dow is down almost -500 points and the NASDAQ is down over -3%.
And with Fed tightening, we are seeing a collapse in M2 money supply.
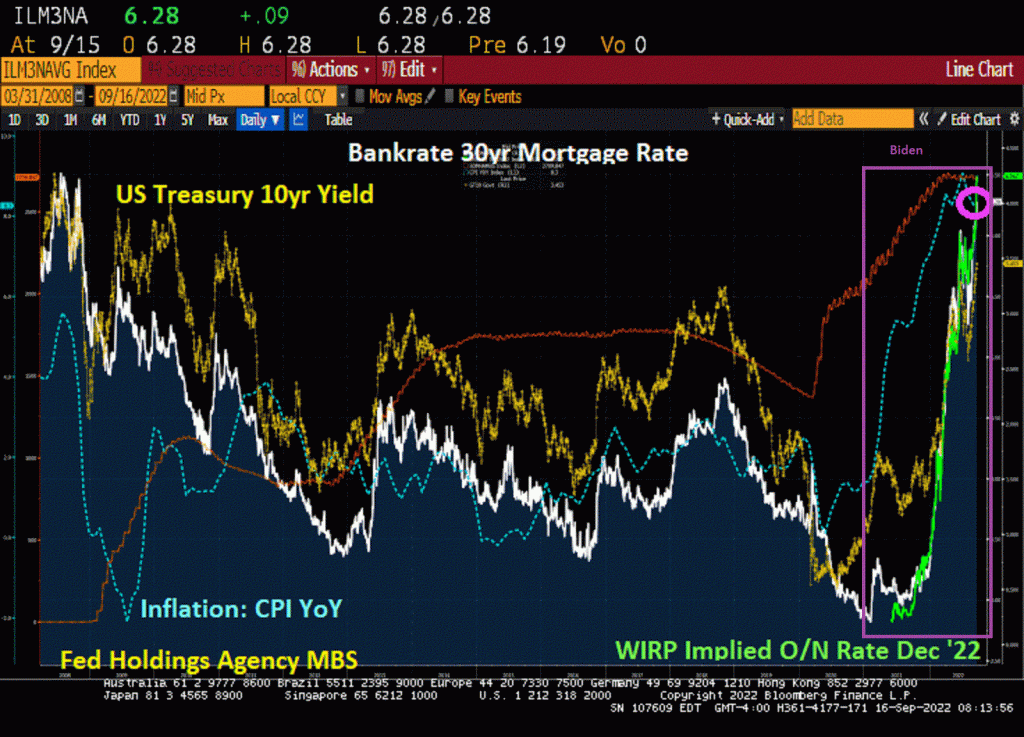
On the real estate side, Bankrate’s 30-year mortgage rate dropped to 6.85% as the 10-year US Treasury yield drops.
On the home price front, according to the Black Knight Home Price Index (HPI), median home prices fell 0.98% in August, only marginally better than July’s upwardly revised 1.05% monthly decline July. August 2022 marked the largest single-month price declines seen since January 2009 and rank among the eight largest on record. The monthly rate of home price decline is now rivaling that seen during the Great Recession – the question is how long it will continue to do so, and how far off peaks prices will fall.
Now, will The Fed pivot to correct the plunging M2 Money growth?
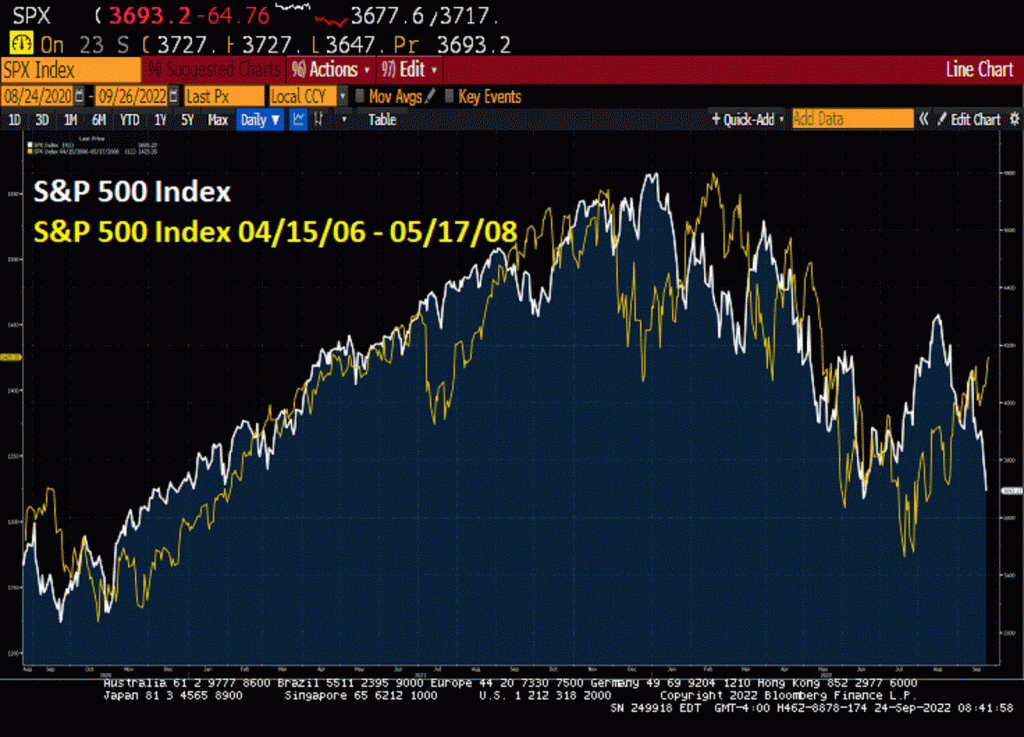
First, let’s look at the S&P 500 index since August 24, 2020 (white line) and compare that to just before The Great Recession 04/15/06 – 05/17/08. They look pretty similar.
Second, let’s look at returns on long-term US Treasuries (10yr+, white line) and US mortgage-backed securities (gold line) since The Fed undertook “Operation Crush Inflation!” (green line).
I saw The President’s press secretary fielding questions about the declining stock returns and impending recession. She responded “But the labor market is strong!” Well, Ms. Karine Jean-Pierre, I am sure President’s Biden economic advisor Jared Bernstein told you unemployment was at a very low level just prior to 1) The Great Recession and 2) The Great Covid-shutdown Recession). So, claiming that the US employment market is strong economy ignores that unemployment will surge if the economy slows … which is what The Fed is trying to do.
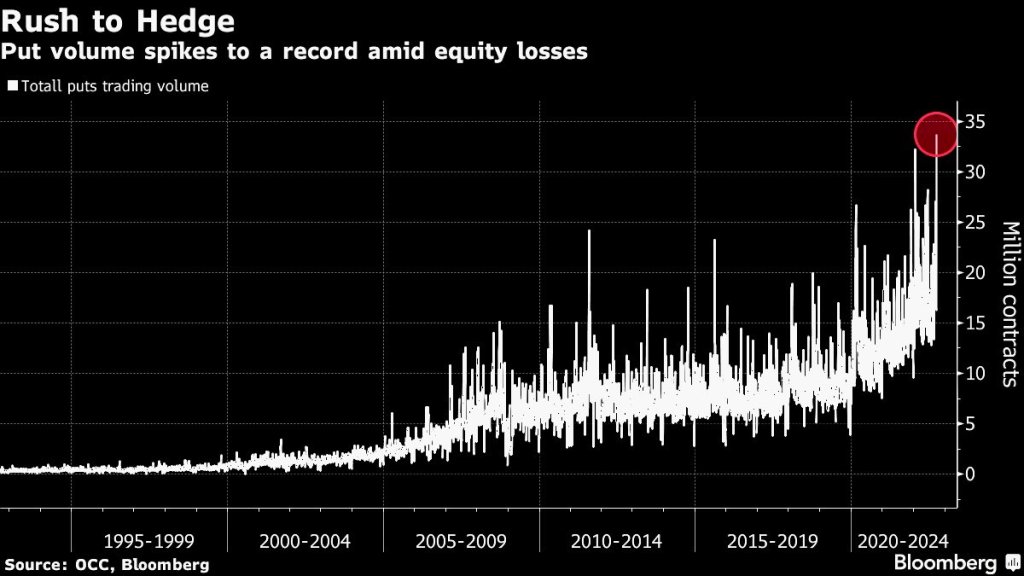
There is a rush to hedge the downside with The Fed tightening the monetary noose.
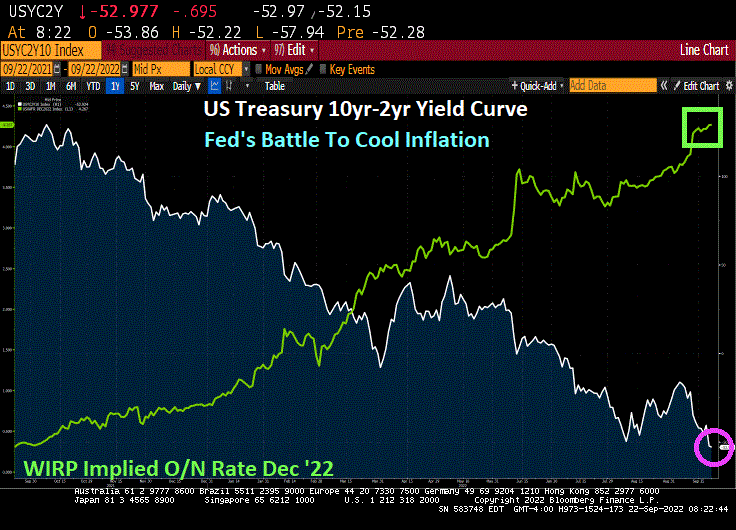
As The Federal Reserve battles inflation (caused by excessive monetary stimulus since 2008), Biden’s green energy policies and excess Federal government spending), we can see that the US Treasury 10yr-2yr yield curve has inverted to -54.4 basis points, the lowest since 1982 after Fed Chair Paul Volcker’s war on inflation.
The US Treasury 10yr-2yr yield curve typically inverts (or goes below zero) several months prior to a recession and is most inverted since 1982.
Fed Funds futures data points to the target rate rising to 4.613% by the May ’23 FOMC meeting … then declining.
Since this is rather miserable news for the economy, I will now play my favorite Bruce Springsteen tune, Sherry Darling.
At least the Dow Jones mini-me futures are up this morning.
The US Dollar/Euro cross currency is rising with Fed tightening.
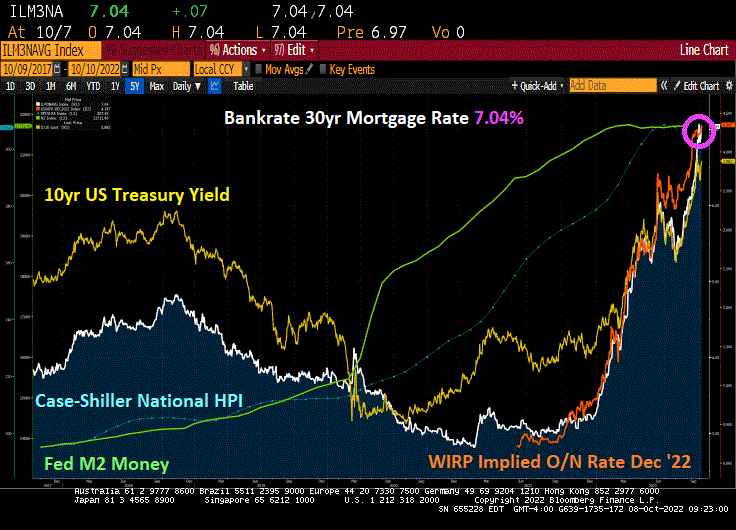
Raging US inflation is resulting in Federal Reserve monetary tightening, causing the 30-year US mortgage rate to hit it highest level since November 2008 (the beginning of Fed Quantitative Easing). Bankrate’s 30-year mortgage rate just hit 6.28%, the highest rate in 14 years.
The Biden Administration will be remembered for crippling inflation, the highest in 40 years AND the highest mortgage rate in 14 years.
And with Fed chatter about hiking rates, Dr T (me) predicts pain for the mortgage market.
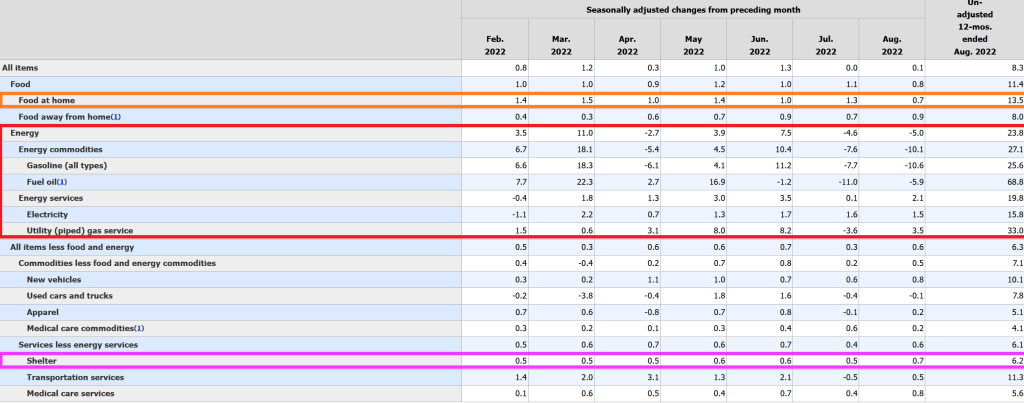
REAL average hourly earnings growth remain in the toilet at -3.06% YoY.
Fuel oil used to heat homes rose 68.8% YoY. Food at home rose 13.5% YoY while rent (shelter) rose “only” 6.2% YoY. Wow, renters are REALLY getting the short-end of the stick from The Fed and the Biden Administration!!
New vehicles are UP 10.1% YoY. Good luck buying those “cheap” electric cars that Mayor Pete Buttigieg trumpets! And wait for the bill when the battery needs to be replaced!!!
Real estate investment trusts (REITs) are an interesting asset class, allowing investors to purchase shares in large-ticket assets like multi-family properties or shopping centers. But given the changing landscape due to online shopping (aka, the Amazon effect), Covid economic shutdowns, etc., REITs should be having a hard time. But aren’t. How come?
Covid economic shutdowns definitely took its toll on retail shopping centers, as an example. And you can see the plunge in the NAREIT All equity index in early 2020. But the NAREIT All-equity index rallied … until The Federal Reserve started tightening their loose monetary policy. Note that as the implied O/N rate rose (orange line), REIT shares declined.
But as the WIRP implied O/N rate settled (pink box), the NAREIT index began to climb again. It is clear that REITs, like other equities, benefit from Fed easing. But how long will The Fed continue tightening?
As of this morning, The Federal Reserve is anticipated to raise their O/N rate to 3.738% by March 22, 2023. Then begin lowering their target rate … again.
Sadly, REITs, like other equity investments such as the S&P 500 index, are sensitive to The Fed’s easing/tightening. Look for REITs to struggle as The Fed tightens, then rally as The Fed eases again.
Here is the (in)famous Hindenburg Omen. Notice how the Hindenburg Omen alarm bells (yellow and red dots) have been silenced by The Fed. But as The Fed tightens (at least until March ’22), we may see the Hindenburg Omen flashing again. Call it the Powellburg Omen.
The NCREIF property index had a decline in the Covid-outbreak era (early 2020) and you can see a slight slowdown in the NCREIF index as The Fed started tightening to fight inflation.


You must be logged in to post a comment.