Biden’s $45 Billion Boondoggle For Office-To- Home Conversions Getting Harder (Biden Has To Find Housing For The 8 Million Illegal Immigrants That Have Crossed Under Biden/Mayorkas!) Why Isn’t The Private Sector Doing The Conversions??

Has anyone considered the impact of Biden/Mayorkas’s open southern border with Mexico? Other than the crime, stress on existing services like healthcare, schools and Social Security. But where will the 8 million illegal immigrants reside? Well. the Biden Administration has an answer: throw money at it! This time, $45 billion to convert empty office space to homes. Not just for illegals, but for anyone.

Conversion from office space to apartments is getting harder. Let’s discuss why, and also what the effort is really all about.

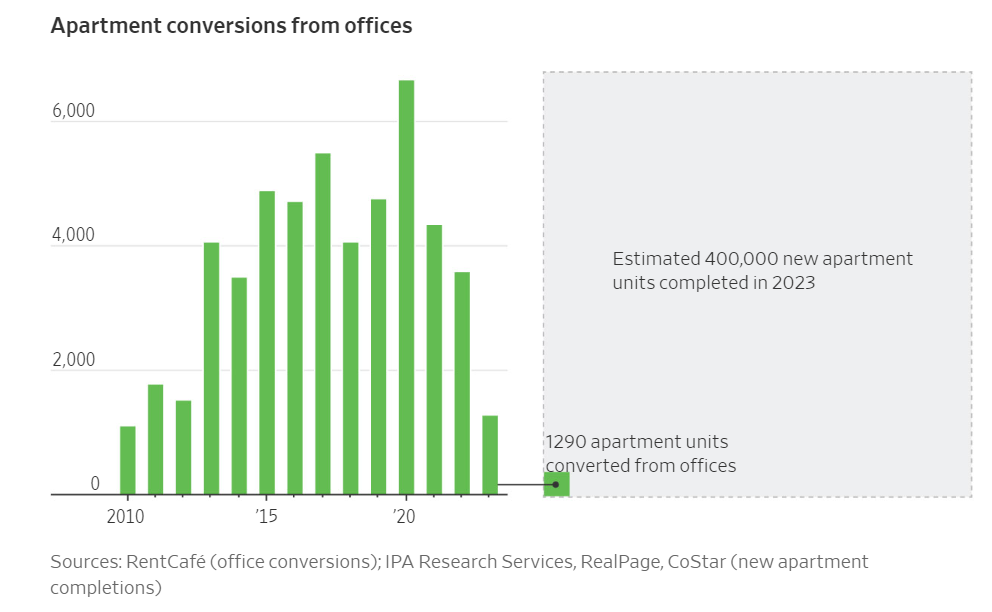
Only 3,575 apartment units were converted from office space last year. The already fraught process now faces even more challenges.

The Wall Street Journal explains why in its report Turning Empty Offices Into Apartments Is Getting Even Harder

Cities hoping to convert emptying office buildings into apartments are running into financing issues, stagnating rental markets and other challenges that are bottling up their efforts.

Developers last year created just 3,575 apartment units in the U.S. through office conversions, according to an analysis by rental listing site RentCafe. That amounts to less than 1% of all apartments built that year through new construction. 

Federal and local governments are also trying to give conversions a boost. The White House said last month that it was updating guidance for existing grants and spending programs to make billions in federal dollars available for these projects. It also said it would seek the conversion of more government-owned properties into housing.

Some cities, such as Washington, D.C., New York and San Francisco, are also taking steps to encourage more conversions. Tax incentives and faster approvals are “rocket fuel” for these projects, said Sheila Botting, a principal at commercial property brokerage Avison Young.

Even so, the process has always been fraught with difficulty and few office buildings are natural candidates. Conversions are easiest in older, lower-quality and mostly empty buildings with small floors. But less than 1% of office space in the biggest U.S. cities ticks those boxes, according to Avison Young.

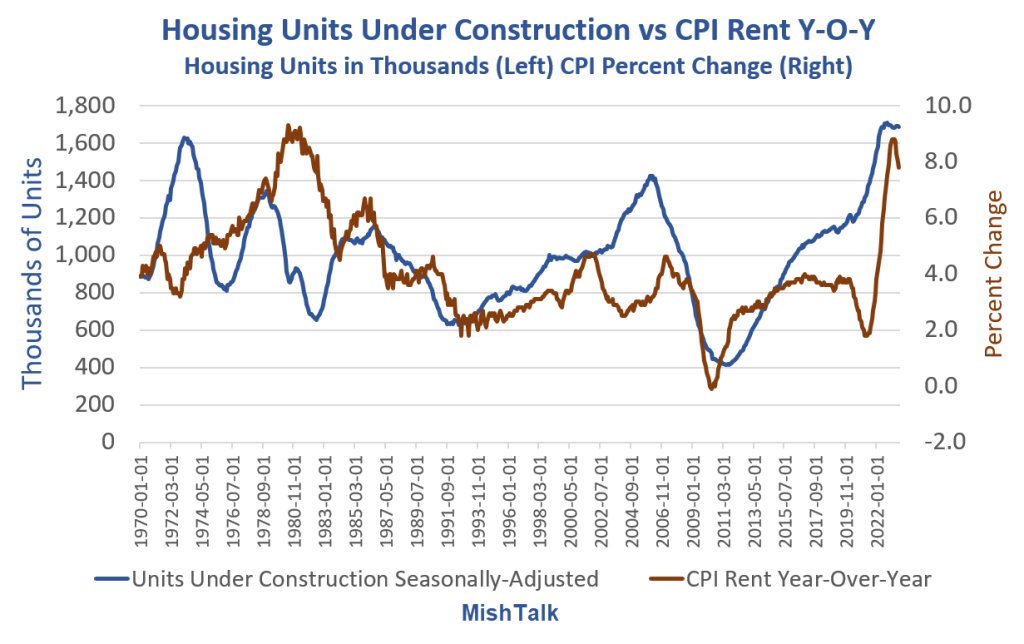
In significant ways, the conversion process is getting even harder now. Slowing rent growth might make apartment conversions less attractive to investors, if the trend persists into next year. Asking rents for apartments have fallen 1.2% nationally over the past 12 months, according to rentals website Apartment List.

Projects Not Economical

Without massive subsidies these projects are not economically feasible. Many aren’t even with massive subsidies.

In downtown Dallas, developer Wolfe Investments seeks to convert an 18-story, 1950s office tower into residential apartments, but has recently been fighting off foreclosure from its lender, Thistle Creek Partners, court records show. 

Developers of One Camelback, a 200,000-square-foot office building in central Phoenix, are trying to convert it into what would be one of the city’s most expensive rental-apartment properties. A website advertises $8,000-a-month apartments, with floor-to-ceiling windows and crystal-clear views of nearby mountains.

But the developers, Sagamore Capital and partners defaulted on a loan of about $70 million. The project’s lender, Delphi Financial Group, has moved to foreclose. An auction of One Camelback is set for later this month, according to documents filed in Maricopa County, Ariz.

Biden Throws $45 Billion in Federal Funds to Convert Offices into Homes

On October 29, Mish (Mike Shedlock) commented Biden Throws $45 Billion in Federal Funds to Convert Offices into Homes

Questions abound. Assume you can convert offices into homes, who wants to live in them? Is a tear down cheaper?

The government has 1,500 office buildings nationally and leases on almost 200 million square feet of additional space that it does not need. Instead of canceling leases and selling the real estate, it’s going to convert them into clean energy spaces.

With enough subsidies, developers will try nearly anything. Then when the projects fail, the developers ask for more money.

How is this Being Paid For?

Taxpayers of course. But Biden is funneling $45 billion from clean energy incentives in the ridiculously named Inflation Reduction Act (IRA) into housing conversions.

You might also be wondering what this has to do with clean energy, and the answer is nothing. The questions keep piling up and I have answers.

What’s Really Going On Here?

Biden is hoping to spread the IRA dollars around to buy more votes.

But to do so, he is taking money away from his other pet projects to fund the idea of the moment. His idea of the moment is to do something about the price of rent.

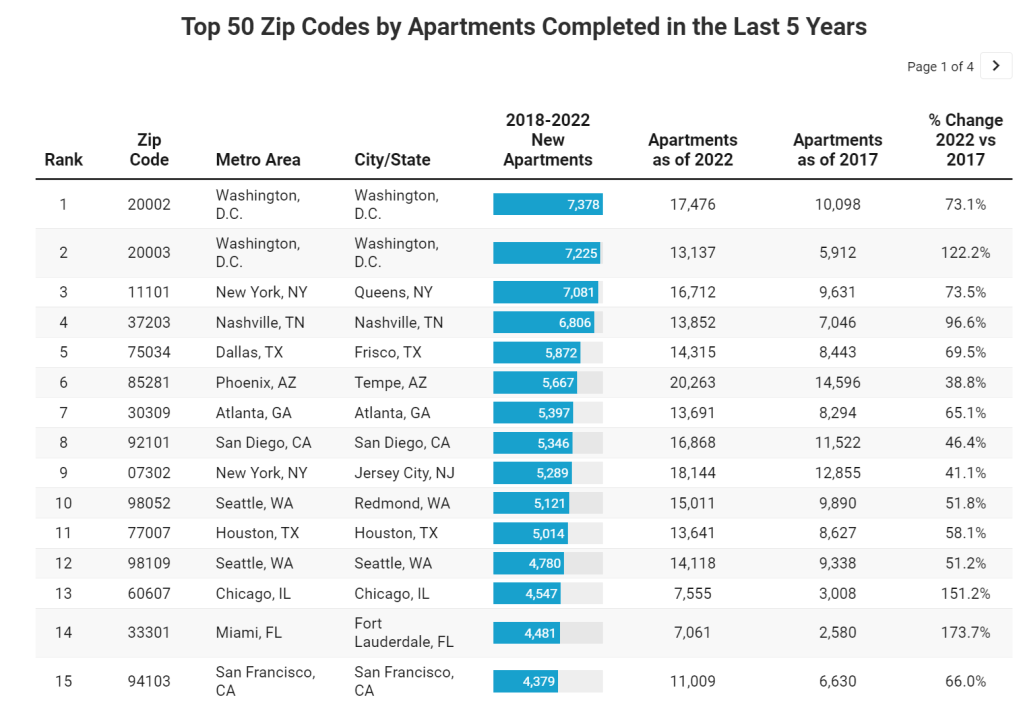
According to RentCafe, Washington DC had two zip codes that led the nation in apartments completed in the last five years (up to 2022).

Why is the private sector doing so few conversions? THAT is the right question. The answer? Office-to-housing conversion is hard and the demand may not be there. But with 8 million illegal immigrants having crossed the border, Biden has to do something. So Biden steps in with $45 billion to convert empty office space to homes. And I have to ask: is this a shadow wealth transfer to large Democrat-controlled cities as an apology for the havoc caused by Biden/Mayorkas open border policy?? Just asking!

So if an idea is really bad and won’t work, like solar power in areas with limited/spotty sunlight or wind turbines in areas with little/sporadic wind, Federal and State governments are always on stand-by to do something really stupid. Like rent control, which creates even worse distortions.

Bizarro World! How the Fed Destroyed the Housing Market and Created Inflation in Pictures

Thanks to Mish (Mike Shedlock) for this wonderful piece!

The Fed erroneously does not consider rising home prices as inflation. Here’s the result in pictures.

Case-Shiller national and 10-city home prices vs CPI, Rent, and Owners’ Equivalent Rent

Chart Note

  • Case-Shiller measures repeat sales of the same home over time. This ensures an accurate comparison of room size, yard size, and amenities. The only drawback is the data lags a bit. The most current data is from July representing transactions in May and June.
  • OER stands for Owners’ Equivalent Rent. It’s the price of rent one would pay to rent one’s own house, unfurnished without utilities.

For 12 years, home prices, OER, Rent, and the overall CPI all rose together. That changed in 2000 with another trendline touch in 2012. Then it was off to the races as the Fed did round after round of QE, suppressing mortgage rates.

Case-Shiller Home Price vs Hourly Earnings, the CPI, and Rent

Case-Shiller national home prices vs CPI, Rent, and Average Hourly Earnings.

As with the previous chart, for 12 years, home prices, rent, the overall CPI and hourly earnings all rose together. That changed in 2000 with another trendline touch in 2012.

How Much Are Homes Overpriced?

If the 12-year trend of home prices rising with average hourly earnings stayed intact, the home price index would be 211, not 308.

From that we can calculate home prices are ((308-211) / 211) percent too high, roughly 46 percent too high. If you prefer, home prices would need to fall ((308-211) / 308), roughly 31 percent.

Alternatively, if home prices stagnate for years, wages may eventually catch up.

Case-Shiller Home Price 1988=$150,000

The same home that cost $150,000 in 1988 now costs $678,366. But wages have gone up too. And mortgage rates have had wild swings.

Mortgage Payment and Wage Adjusted Mortgage Payment

The Least Affordable Mortgages in History

Factoring in wage growth, home prices, and mortgage rates, homes are the most expensive ever.

It’s actually much worse than the chart indicates because property taxes and insurance are not factored into.

Mortgage Rates

Mortgage Rate chart courtesy of Mortgage News Daily.

Through massive and totally unwarranted QE, foolishly hoping to create more inflation, the Fed suppressed interest rates to record lows and mortgage rates followed.

Anyone with an an existing mortgage could and did refinance at 3.00 percent or below.

This increased “affordability” and we now have two classes of people courtesy of the Fed: winners and losers (existing home owners who refinanced low and those who want to buy).

Mortgage Application at 30-Year Lows

Refinance Index courtesy of Mortgage News Daily

Please note Mortgage Application Volume Nears 30-Year Lows

“Mortgage rates continued to move higher last week as markets digested the recent upswing in Treasury yields. Rates for all mortgage products increased, with the 30-year fixed mortgage rate increasing for the fourth consecutive week, up to and above 7.53 percent – the highest rate since 2000,” said Joel Kan, MBA’s Vice President and Deputy Chief Economist. “As a result, mortgage applications ground to a halt, dropping to the lowest level since 1996. The purchase market slowed to the lowest level of activity since 1995, as the rapid rise in rates pushed an increasing number of potential homebuyers out of the market. ARM loan applications picked up over the week and the ARM share increased to 8 percent, as some borrowers searched for ways to lower their payments.” 

What About the Winners?

Good question. The winners refinanced at 3.0 percent or below. This put extra money in their pockets every month to spend.

And rising wages further stimulated ability of the winners to buy goods and services.

Thus the Fed is still paying for its asinine push to create inflation.

Meanwhile, the housing market is dead and will remain dead with mortgage rates approaching 8.00 percent.

What About Rent?

CPI data from the BLS, chart by Mish.

That’s another good question. For 24 months or so, economists have been predicting an ease in rent inflations.

On September 13, I noted Consumer Price Inflation Jumps 0.6 Percent Led by Energy and Shelter

The price of gasoline rose 10.6 percent, rent another 0.5 percent, shelter, 0.3 percent, and new cars 0.3 percent leading the way for a 0.6 percent increase in the CPI in August.

The price of rent has gone up at least 0.4 percent for 25 straight months. Not to worry, Paul Krugman says this is lagging.

When Will Record Housing Units Under Construction Ease Rent Inflation?

On October 2, I asked When Will Record Housing Units Under Construction Ease Rent Inflation?

That’s really a trick question. For a better question, remove the lead “when” from the sentence.

The answer is: I don’t know, nor does anyone else, although people claim to be clairvoyant.

Housing Units Under Construction vs CPI Rent Year-Over-Year

Housing units from Census Department, Rent CPI from BLS, chart By Mish

I saw the theory that rent would collapse as soon as housing units get completed so many times that I almost started believing it myself.

However, the data shows no discernable correlation no matter how you shift the lead or lag times.

The chart looks totally random. So perhaps rent abate. Perhaps not. The data itself provides no reason to believe anything.

Regardless, please note the floor. Year-over-year rent has a floor of about 2 percent except in the Great Recession housing crash.

And these charts are not imputed Owner’s Equivalent Rent prices for which people pay no actual rent. These charts reflect rent of primary residence.

34 Percent are Screwed

Well, don’t worry. Only 34 percent of the nation rents, and besides, rent is lagging.

Sarcasm aside, the Fed blew huge asset bubbles and did not see that as inflation. Nor did the Fed see that three massive rounds of fiscal stimulus would cause inflation.

Real Income and Spending Billions of Chained Dollars

Note the three rounds of massive fiscal stimulus in the Covid pandemic. This triggered the most inflation since the 1970s. Economists debate how much “excess savings” still remains.

For discussion of excess savings, please see Excess Pandemic Savings, How Much is Still Unspent?

The Fed never saw this coming, never saw a housing bubble in 2007, and has never once predicted a recession.

Heck, former Fed chair Ben Bernanke denied a housing bubble and denied a severe recession that had already started.

Expect More Inflation Everywhere

Unfortunately, Biden is doing everything humanly possible to stoke inflation with EV mandates, natural gas mandates, union pandering, student debt forgiveness, and regulations, some of which is blatantly unconstitutional.

As a result, Fed Rate Interest Rate Hike Expectations Are Still Higher for Even Longer

Looking to Buy a Home?

If you are looking to buy your first home and need to finance, good luck.

The longer the Fed holds rates high, the longer the housing transaction crash lasts. But cutting rates will further expand the housing bubble, asset bubbles in general. And bubbles are destabilizing.

That is the Fed’s tightrope dilemma, of its own making.

If you are one of the winners, congrats. But that extra money the Fed put in your pocket every month may stoke inflation for a long time.

Simply Unafforable! The Fed And Death Of The Starter Home Market (Fed Pause Will Not Help Much)

Starter homes are simply unaffordable.

Treasury Secretary Janet “Too Low For Too Long” Yellen, and former Federal Reserve Chair, is partly responsible for a phenomenon plaguing America: the death of starter homes.

As Mish has discussed, with main markets no longer an option for first-time buyers, Point2 looked at the country’s 100 largest secondary cities for the median price of a starter home and renter households’ median income. Defined as large non-core cities within a metro, these cities used to be fruitful house-hunting grounds for first-time buyers exploring less-expensive options away from main cities. But as it turns out, unaffordability can put a dent in homeownership plans regardless of city type or size.

  • In 41 of the 100 largest secondary cities in the U.S., renters earn half or less than half of the income they would need to buy a median-priced starter home.
  • There are no non-core cities in which renters could comfortably make a move toward homeownership: In 10 cities, the necessary income is about triple what they earn.
  • Would-be buyers in Burbank and Glendale, CA have it worst: They lack 67% of the income they would need in order to make the move from renter to homeowner.
  • Renters in 9 California cities would need to earn about $100,000 more in order to afford a starter home. Based on the latest renter income figures, starter home prices, and mortgage rates, non-core cities in the LA and San Diego metros are the toughest for first-time homebuyers.
  • In 15 of the 100 largest secondary cities, renters would need less than 4 months’ worth of extra income to afford the transition to owning a starter home.
  • Homeownership is within reach in Independence, MO, and Broken Arrow, OK. Those who dream of owning here would need less than one month’s worth of extra income to afford a starter home.

California Tops the List of Worst Places to Look

Starter Home Affordability

California has the dubious distinction of having the top least affordable starter home cities. 

A starter home, according to the Census Department is priced in the bottom third of homes in the area.

Pomona, CA, is in fourteenth place. The average renter in Pomona makes $49,000 a year and needs to get to $121,000 a year. That’s nearly 2.5 times current salary. 

In Burbank, CA, the average renter makes $63,000 year an needs to get to $193,000. That’s over 3 times current salary.

Within Grasp

15 Almost Affordable Cities

In no market can the average renter make the plunge. 

But in Independence, Missouri, or Broken Arrow, Oklahoma, the average renter is respectively just  2% and 5% short of the amount needed for a starter home

Not Shocking

None of this is shocking. It matches one one should expect looking at Case-Shiller home prices and mortgage rates.

Case-Shiller Home Price Index National and Top 10 2023-03

The Fed wanted to produce inflation and it did. But for years the Fed did not even see the inflation because the manifestation of inflation was in asset prices, not the price of consumer goods.

Case-Shiller Top City Home Prices Decline From Year Ago for the First Time Since May 2012

CS National, Top 10 Metro, CPI, OER 2023-03

Housing starts, like mortgage purchase demand, remains depressed compared to the housing bubble of the 2000s.

Now, will The anticipated Fed pause in rate hiking help? Not likely. The Fed still has over $8 trillion in monetary stimulus chasing assets. Too much Stimulypto.

Janet “Bubbles” Yellen probaby listened to too much Don Ho.

Gross Domestic Income GDI Suggests the US Is In Recession Right Now (While Uniparty Agrees In Principle To Avoid Debt Default)

Well, Biden and McCarthy have agreed in principle to a budget revision, raise the debt ceiling and avoid a US debt default. The Uniparty strikes again! No restraint of reckless Federal spending t speak of . The big donor class wins and middle class Americans lose.

Mike Shedlock (aka, Mish) makes a good point: the US is already in recession if we look at GDI (gross domestic income) rather than GDP (gross domestic product). The US has already declined two consecutive quarters in terms of negative GDI growth.

Mish’s chart:

The Uniparty heads.

Hand To Mouth! 70% Of Americans Are Financially Stressed, 55% Live Paycheck-to-Paycheck As Credit Card Debt Soars And Personal Savings Dwindle As Fed Tightens (GOLD Rises Above $2,000)

Hand to mouth should be Biden’s Presidential re-election theme song.

70% Of Americans Are Financially Stressed, 58% Live Paycheck-To-Paycheck because America is living off their credit cards living a life they can’t actually afford as credit card debt keeps hitting record highs approaching $1 TRILLION!

Of course, what is really troubling is that credit card useage is soaring as The Fed hikes interest rates to combat inflation … caused by Janet Yellen and The Fed keeping rates near zero for too long under Obama. Then we have Biden fighting fossil fuels and Congress spending like drunken sailors in port. All together? Consumers turn to credit cards to cope and their personal savings are dwindling.

How to protect yourself against out-of-control Fed money printing? Gold is up over $2,000.

Former Fed Chair Janet Yellen didn’t try too hard to avoid asset bubbles or slow Obama’s economy. But as a result of her horrible monetary policies, The Fed is keeping on pushng rates up. And America is suffering for it.

Fed Tightening Pushed Fed Funds Target Rate Above MBS Yields For First Time In History (Biden Administration Ready To Unleash A $27 Billion Green Slush Fund)

The most recent tightening by the Federal Reserve has pushed the federal funds target rate above mortgage-backed securities yields for the first time in history. Though this poses clear challenges of carry for MBS holders, selective investments in specified pool and collateralized mortgage obligations (CMOs) could provide incremental returns.

While Biden brags (redundant) about lowering inflation (that his energy policies and massive Federal spending caused), apparently he never learns. Now we learn from Mish that the Biden Administration is ready to unleash a $27 billion green slush fund on the US middle class.

Inflation started under Biden, but the massive expansion in money supply (M2) begin with Covid in 2020.

Once this latest spending splurge kicks in, we will see rising inflation again. After all, Biden and Congress have gotten the taste for massive spending bills (like vampires) and spending likely won’t slow down.

Inflation: The Little People Tax (Food UP 10.91% YoY, Home Prices Up 20% YoY, Fed’s Reverse Repos Remains Over $2 TRILLION)

Only in today’s Kafkaesque (having a nightmarishly complex, bizarre, or illogical quality) Federal government would Biden, Schumer and Pelosi cheer about passing a bill hilariously called “The Inflation Reduction Act” that not only will NOT reduce inflation, but also raises taxes on most Americans.

In terms of the inflation tax on the middle class and low-wage workers, we see that FOOD inflation was 10.91% YoY in July and the BLS’s low-ball estimate of “rent” at 5.76% YoY. Odd, since home price growth is 19.75% YoY.

The Fed’s monstrous balance sheet is still near $9 TRILLION (over stimulus) and The Fed’s Overnight Repo Facility remains near $2 TRILLION.

Industrial electricity costs (to be passed on to consumers in the form of higher prices) is up 24.4% YoY. Residential electricity cost is up “only” 7.4% YoY. (Source: Mish GEA)

I loved the Arizona Senator Kyrsten Sinema photo-op at the drought-plagued Lake Mead, where she bragged about $4 billion for drought mitigation. I really do hope that it works, but I fear that it will like Obama’s spending on green energy debacle like Solyndra. That is, billions spent and nothing improves.

Here is a painting of me standing at the Social Security office.

Alarm! Fed’s Bullard Says US Recession Fears Overblown With Consumers Healthy (My Response In One Chart: REAL Average Wage Growth At -3.34% YoY, Real GDP Growth At … 0%)

Alarm!

No problemo, says James “Bully” Bullard, President of the St Louis Federal Reserve. Bullard said that US recession fears are overblown with consumers “healthy.”

Really Jim?

Inflation is so bad they REAL average hourly earnings growth keeps falling and is now -3.34% YoY.

Apparently, real GDP growth of ZERO doesn’t bother Bullard either.

Apparently, we are still Under The Thumb of The Federal Reserve.

US Workers Made Only 8 Cents More Per Hour, Inflation-Adjusted, Than In January 1973 (While Real Home Prices Soar)

The US Bureau of Labor Statistics released their Real Earnings Report for August yesterday. And is it pretty depressing for US workers.

  • Real average hourly earnings for all employees increased 0.4 percent from July to August, seasonally adjusted. This result stems from an increase of 0.6 percent in average hourly earnings combined with an increase of 0.3 percent in the Consumer Price Index for All Urban Consumers (CPI-U). 
  • Real average weekly earnings increased 0.3 percent over the month due to the change in real average hourly earnings combined with no change in the average workweek.  

If we look at REAL US housing prices versus REAL average hourly earnings for production and nonsupervisory employees, we can see waves of imbalance between the two measures (also known as “bubbles”). Such as today.

But the real horror chart is the following (courtesy of Mish). It shows that real hourly earnings have barely changed since January 1973.

Of course, labor outsourcing to lower labor cost countries is the chief culprit. Karsten Manufacturing, maker of Ping golf clubs, no longer makes their castings in Phoenix AZ thanks, in part, to EPA regulations. Ping clubheads are now made in Asia.