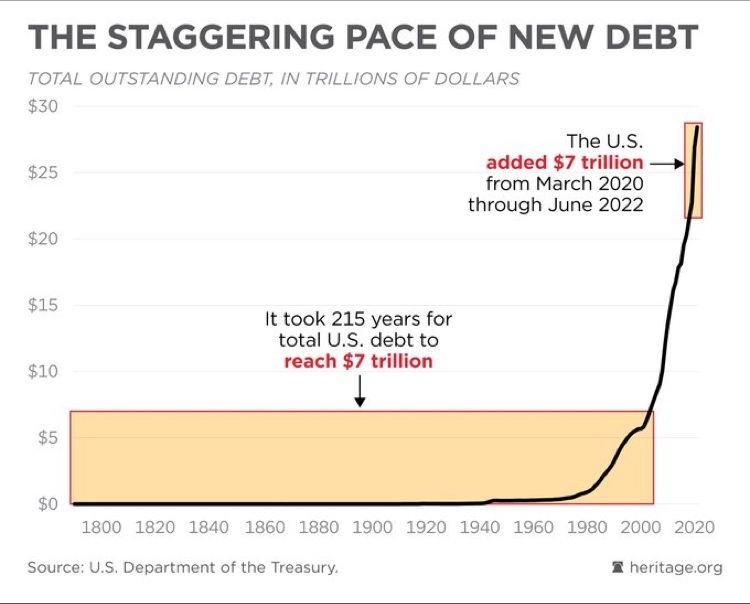
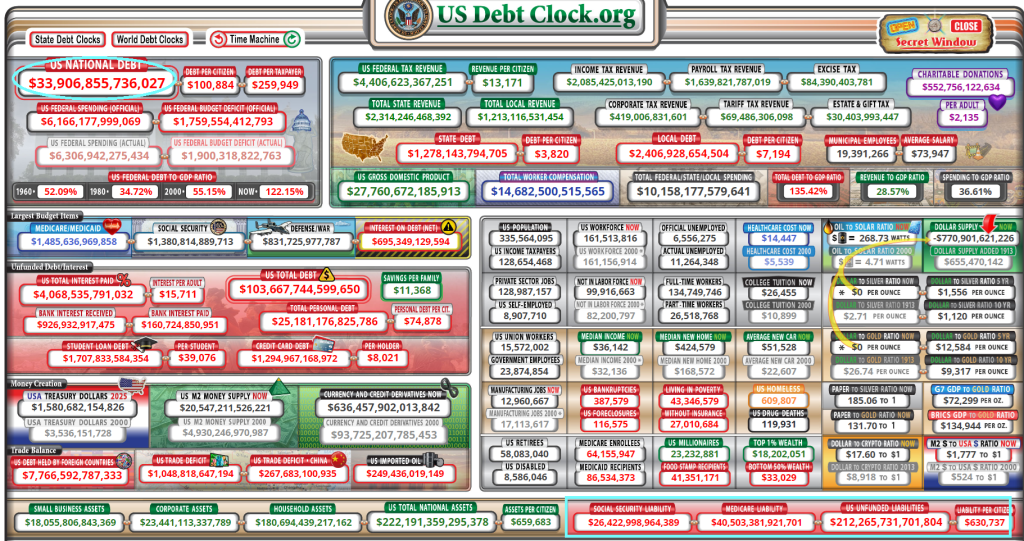
The Federal government added $7 trillion in debt since 2020 while it took 215 years to get to $7 trillion before Covid and Bidenomics.
In what can simply be called fiscal insanity, The Federal government is borrowing like there is no tomorrow (given that Biden is 81 years old, this isn’t far off) displacing businesses and households. Heaven help us if the Federal government has to borrow more money to fight a real war like World War II.
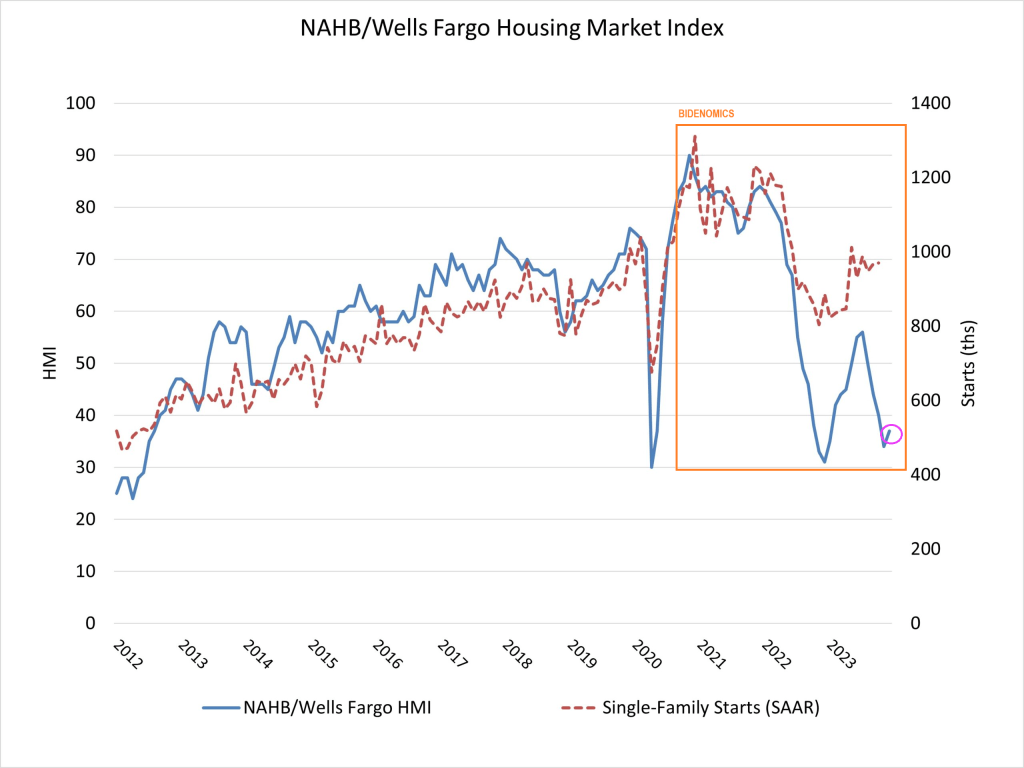
So, the massive Federal debt gorging isn’t helping the housing market.
Both the US Federal government and California’s government are facing a fiscal inferno. Thanks to a softening economy and inane fiscal policies.
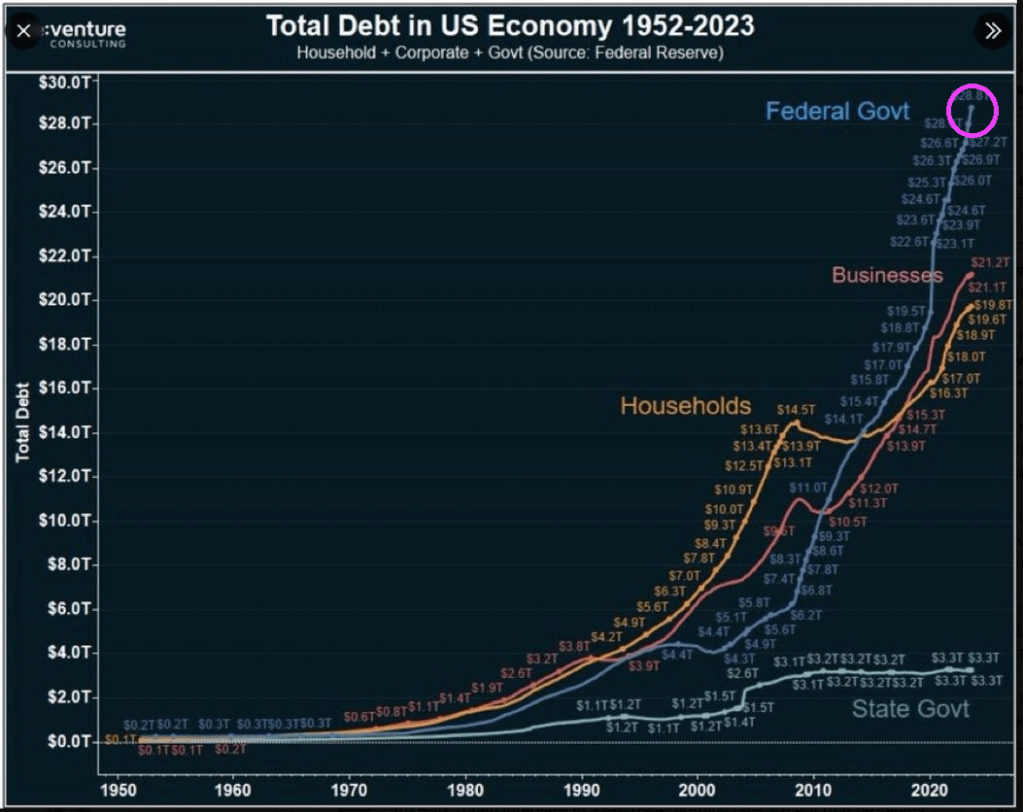
At the macro level, we see that The Federal government has gone wild spending money and borrowing it. Much more than businesses and households. Biden’s wild spending reduces the degrees of freedom that Treasury has if the US slips into another recession or depression.
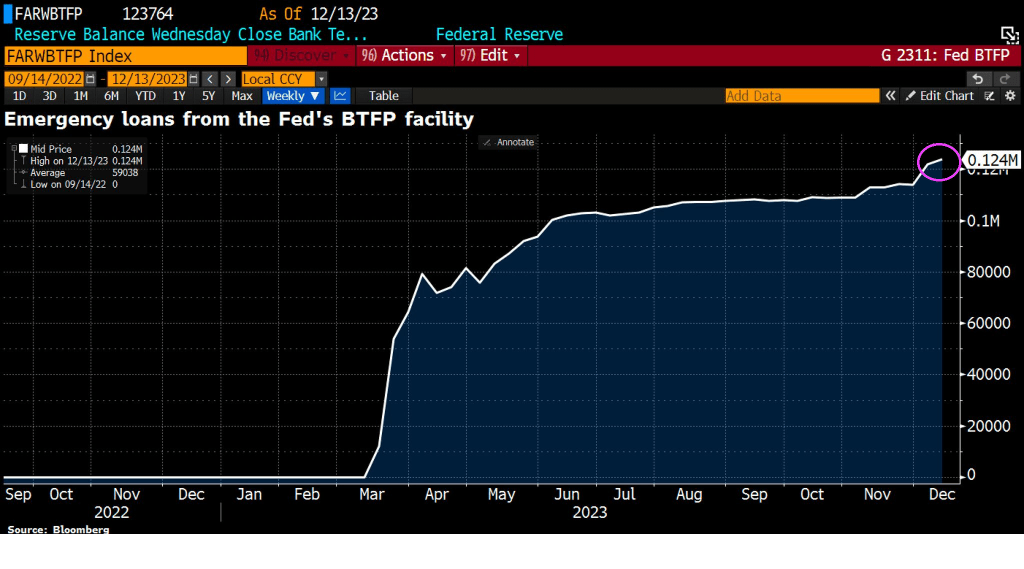
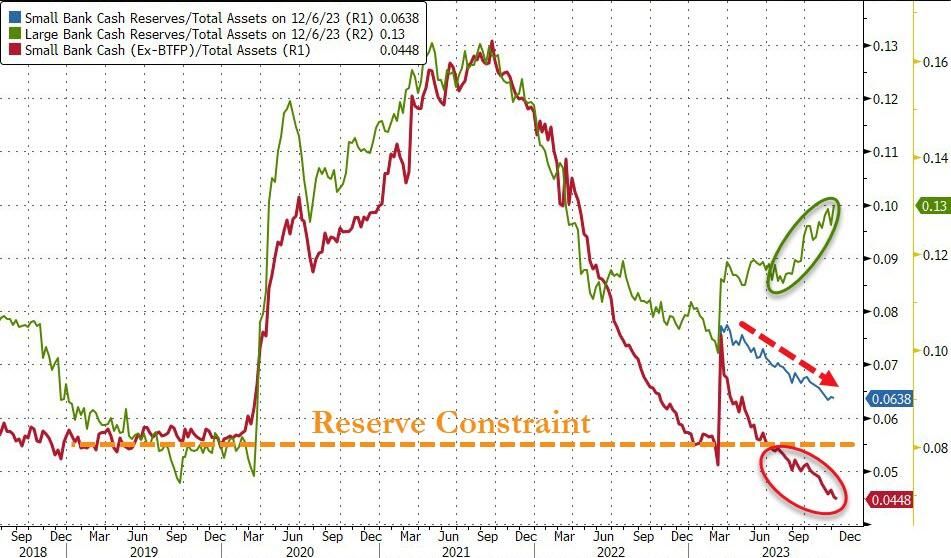
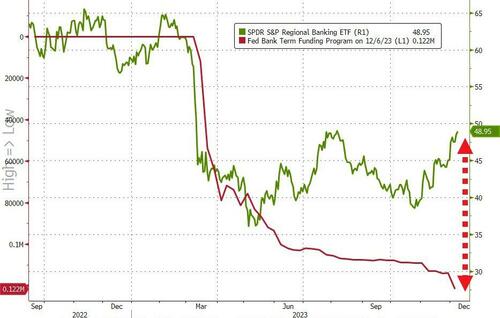
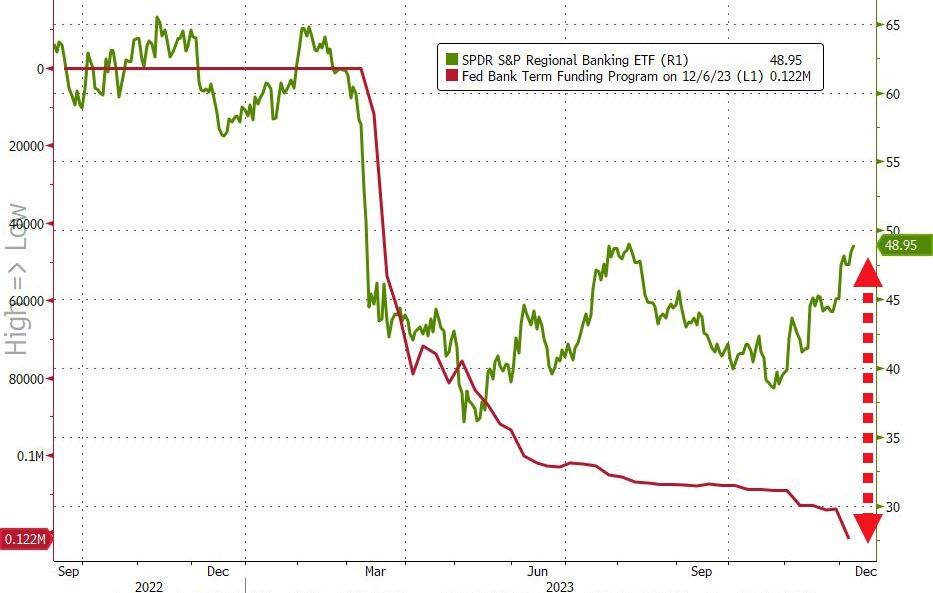
First, let’s begin with banks to illustrate the worsening condition of the economy. Emergency loans from The Fed’s Bank Term Funding Program (BTFP) is on the rise, signaling perceived trouble in the economy.
Small banks are suffering more than big banks.
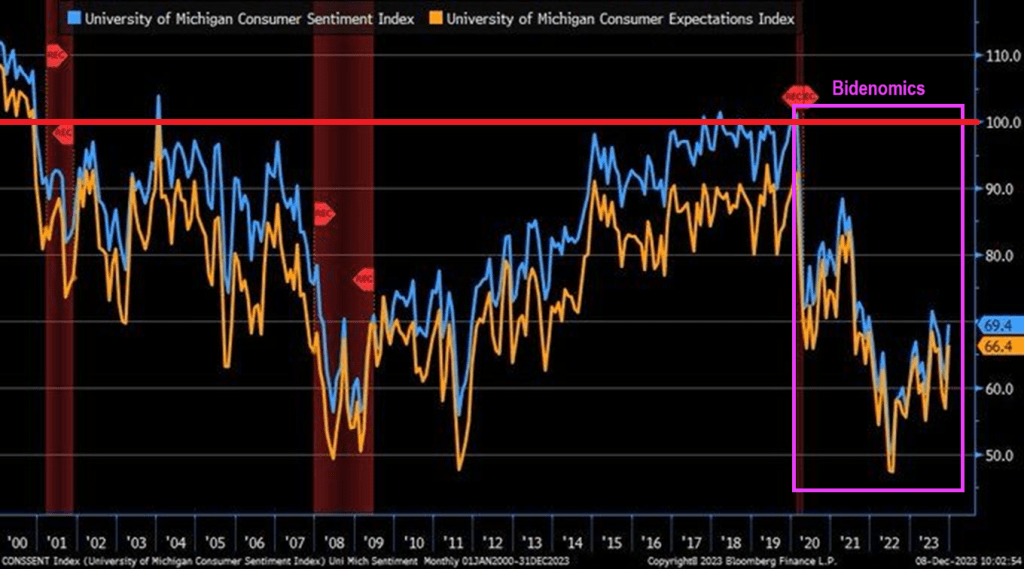
Consumer sentiment is below 70 (100 baseline) under Biden and Bidenomics.
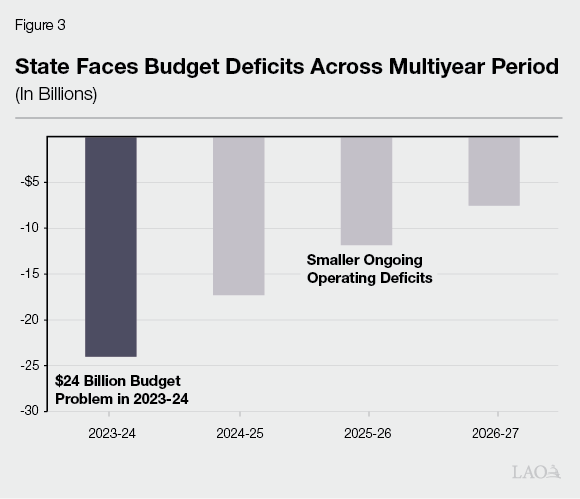
And then we have Gavin “Gruesome” Newsom and California. California is now facing a $68 billion deficit. It has also defaulted on a $20 billion loan from the federal government. The situation is so dire the state is telling agencies not to replace broken printers or re-stock office supplies. Workers are being stripped of benefits and could face furloughs. This is all happening as the state has spent billions funding High-Speed Rail and expanding Medi-Cal to all undocumented immigrants, while losing billions in tax revenue from people leaving the state.
$68 billion is over twice this forecast deficit of $24 billion.
But never fear. “Billions Biden” will make sure California is okay, ar least until the 2024 Presidential election.
Like the spaghetti western “The Good, The Bad And The Ugly,” Bidenomics has had similar effects on financing. Some good, some bad and a lot of uglies.
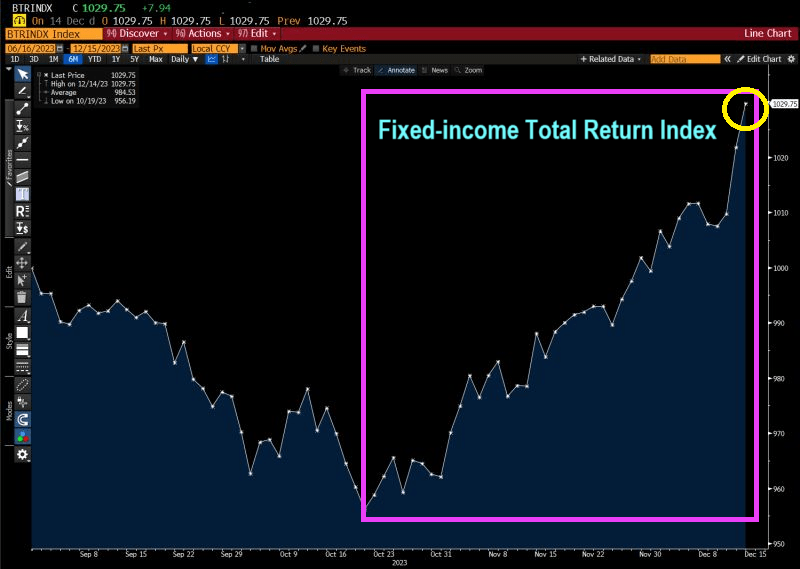
The good! For investors like pension funds the own US Treasuries, inflation has led The Federal Reserve to raise interest rates. This is good for investors holding short-term debt. The Bianco Fixed Income Total Return Index is soaring!!
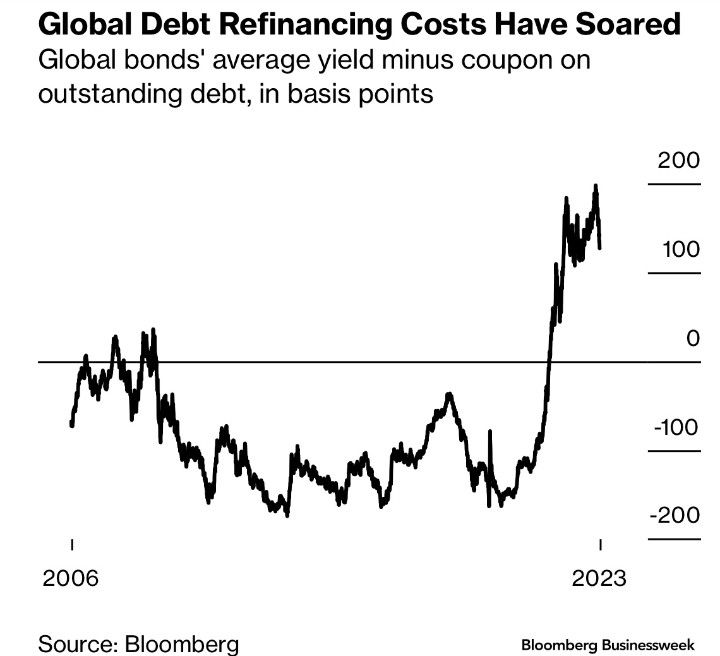
The Bad: Well, the flip-side of the same coin is that debt refinancing costs have soared.
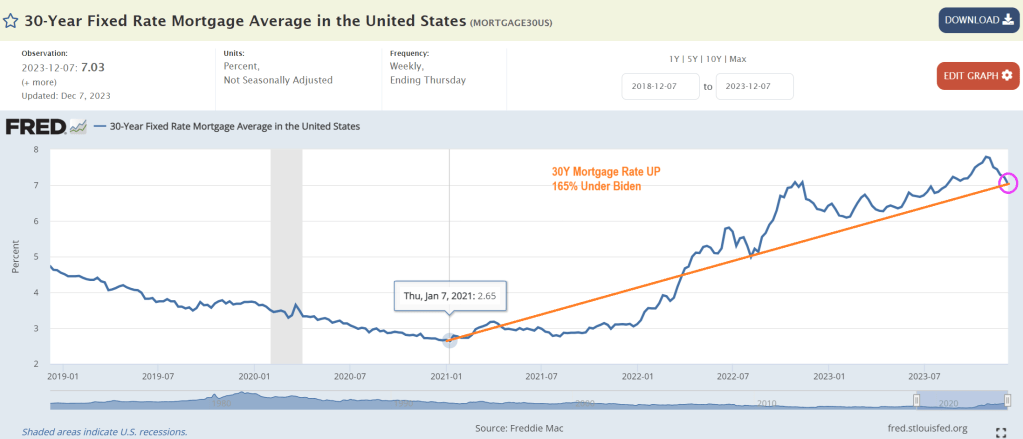
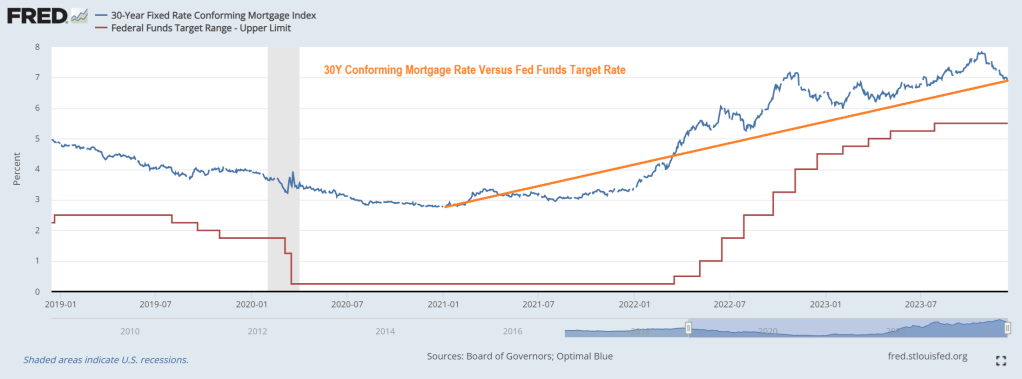
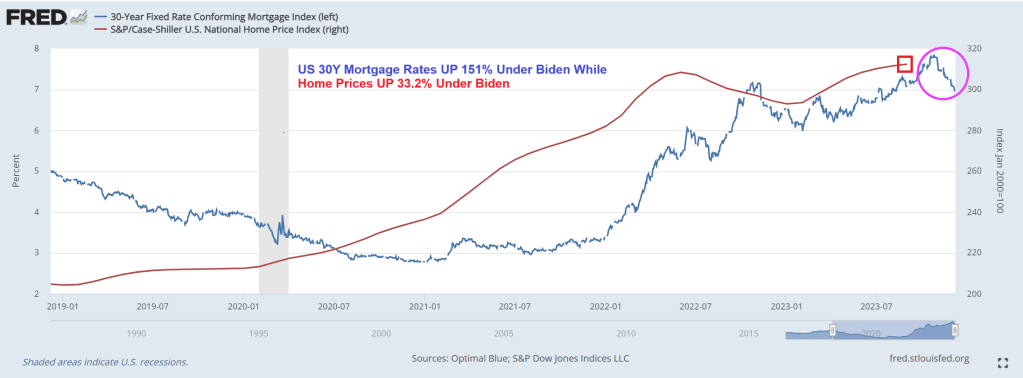
The Ugly. There are many contenders for losers under Bidenomics and current Fed (garbled) policies. But I choose … mortgage demand collapse with rising home prices and rising mortgage rates. Mortgage rates are up 165% under Biden.
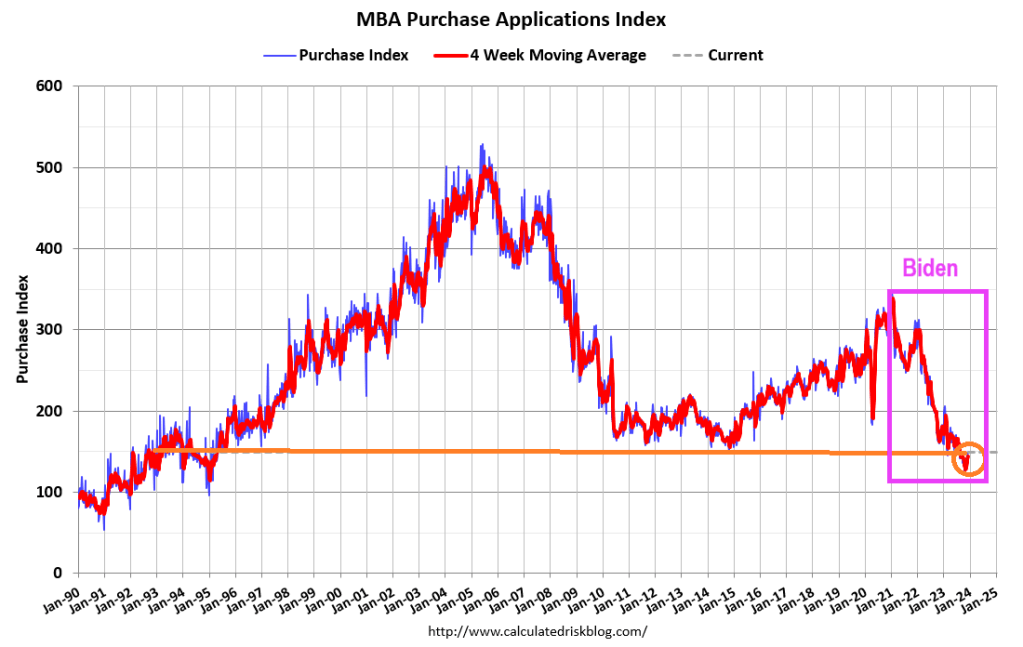
And mortgage demand (applications) have been crushed.
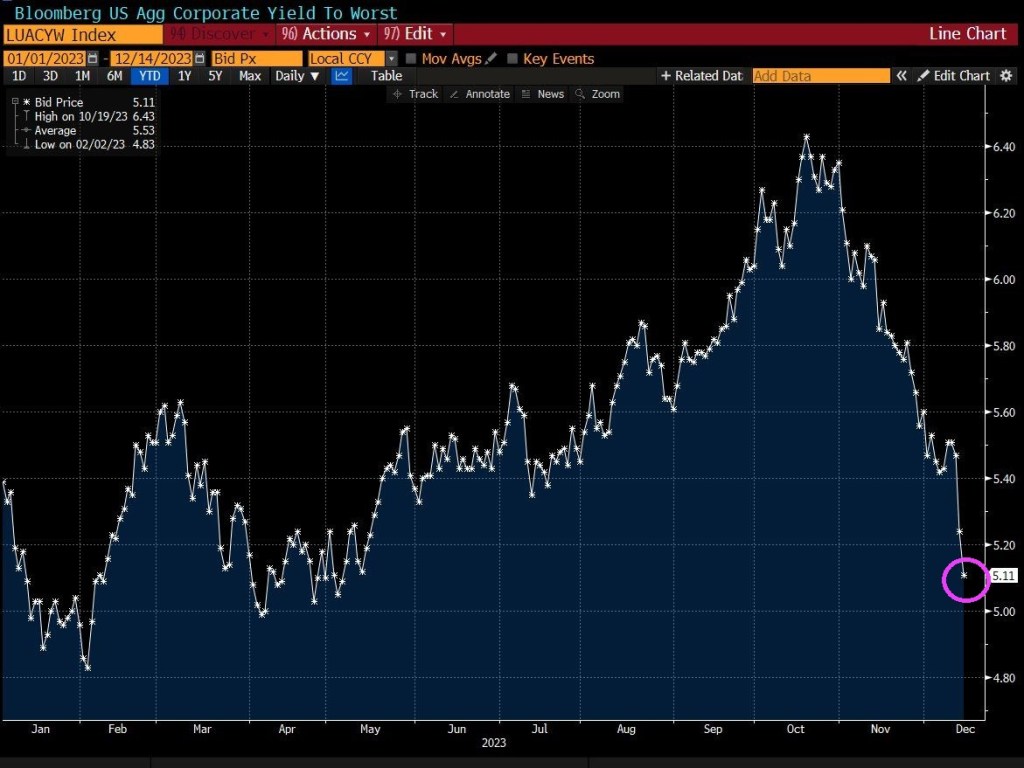
Also on the ugly side, global aggregate corporate yields have collapsed.
So, there have been winners with Bidenomics (the top 1%), and lots of losers.
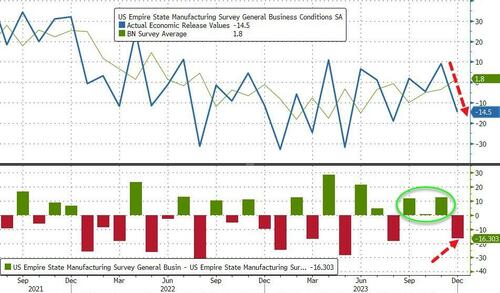
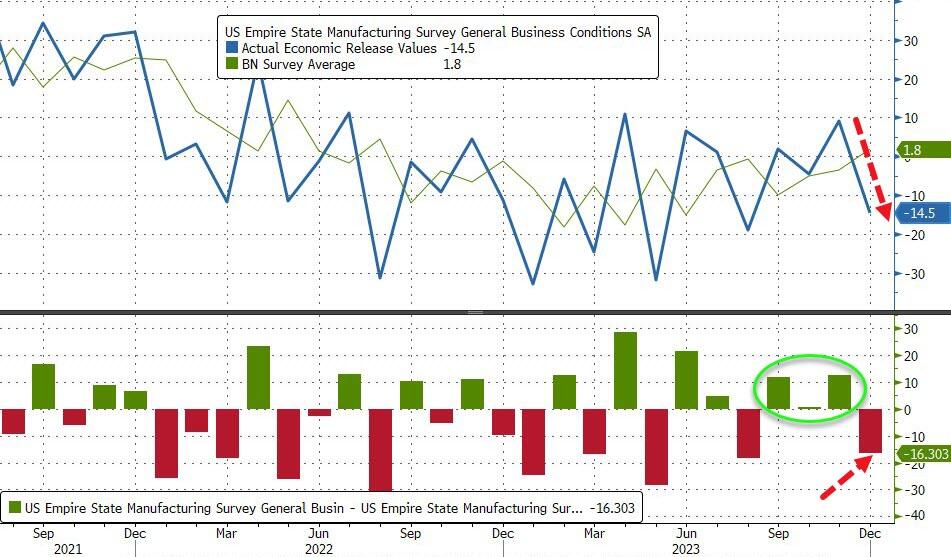
The drop takes the measure from ‘expansion’ at 7-month-highs to ‘contraction’ at 4-month-lows…
Source: Bloomberg
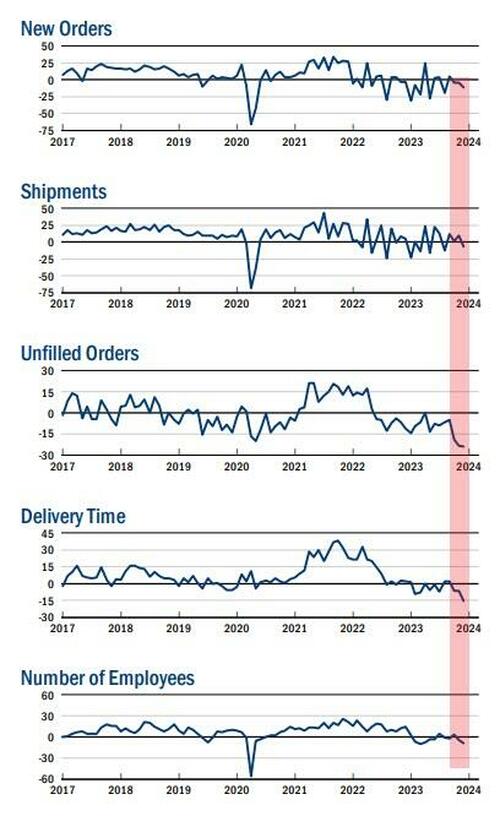
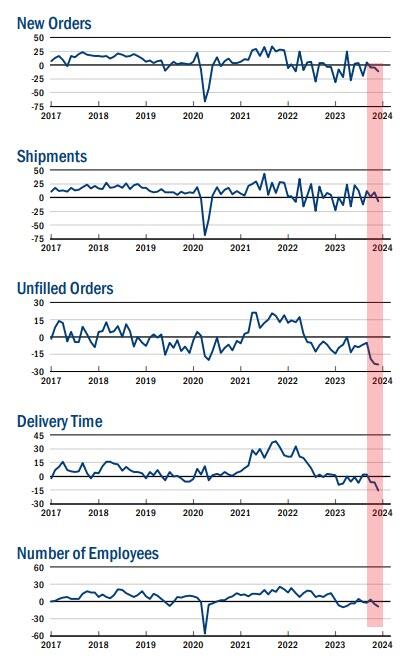
The new orders fell six points to -11.3, pointing to a decline in orders for a third consecutive month, and the shipments index fell sixteen points to -6.4, indicating that shipments fell.
The unfilled orders index held steady at -24.0, a sign that unfilled orders continued to fall significantly.
After rising into positive territory last month, the inventories index retreated fourteen points to -5.2, suggesting that inventories moved lower.
The delivery times index dropped ten points to -15.6, its lowest reading in several years, a sign that delivery times shortened.
The index for number of employees fell four points to -8.4, its lowest level in several months, pointing to a modest decline in employment levels.
On the bright side, the prices paid index moved down six points to 16.7, suggesting an ongoing moderation in input price increases, while the prices received index held steady at 11.5, a sign that selling price increases remained modest.
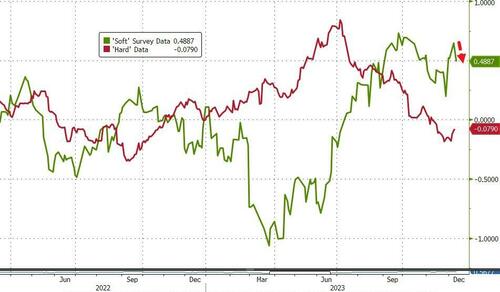
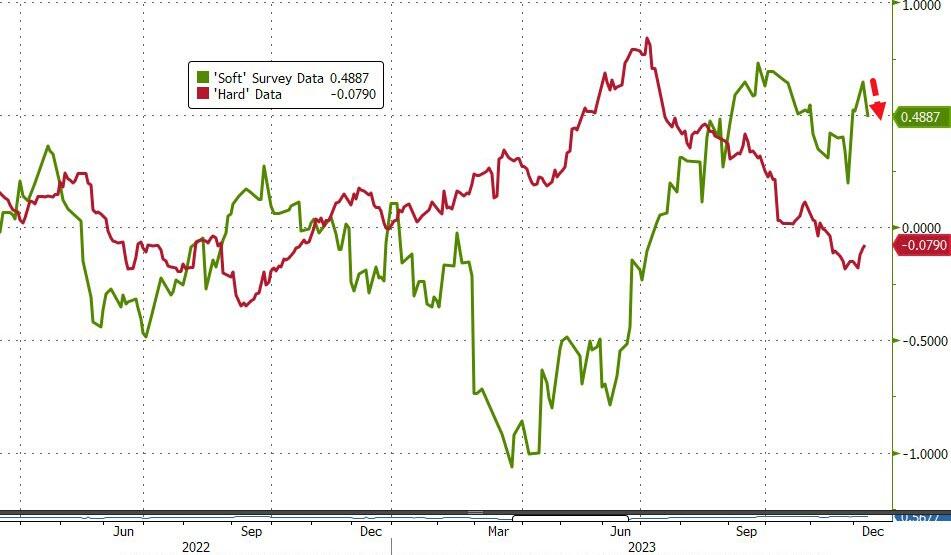
Is this the start of ‘soft’ data’s reversion to ‘hard’ reality?
The Fed – with its six rate-cuts – better hope so.
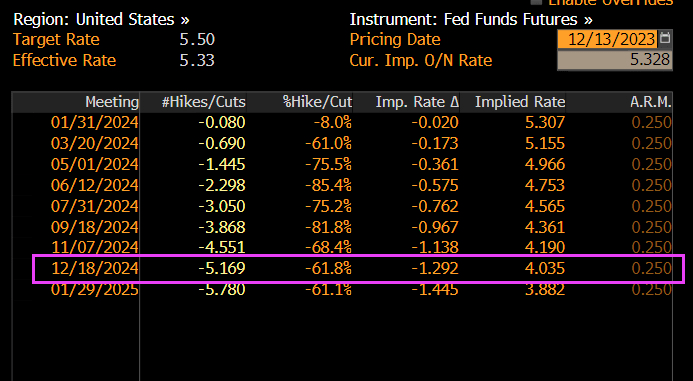
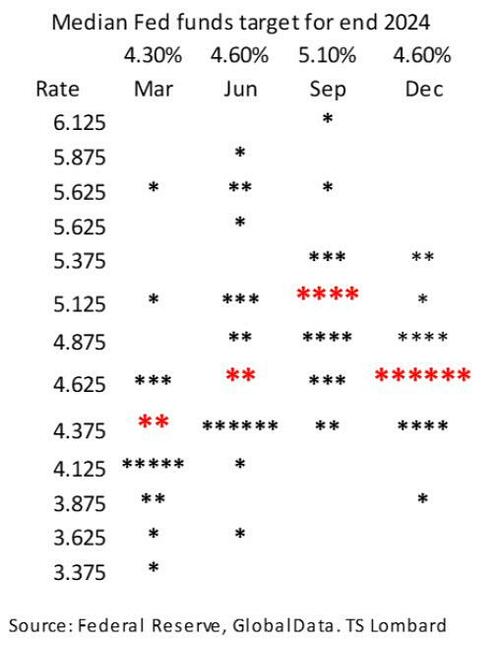
… it was the dot plot, where the median 2024 dot plot now forecasts 3 rate cuts up from 2, that shocked traders: in a very rare admission by the Fed, the central bank confirmed that the pre-meeting market pricing of multiple cuts in 2024 were correct in interpreting the Fed’s intentions. It also confirmed – yet again – that the market was right and every single FOMC member was wrong. In retrospect, none of this should have been a shock.
Commenting on the dot plot, TS Lombard’s Steven Blitz said that “for a group that prizes the pricing of its policy intentions in the forward markets as being more important to shifting market conditions than the spot rate, they h d to know that moving the median forecast for Fed funds at the end of 2024 back to June levels would be a bullish signal.“
Or maybe concerns about the market’s reaction were of secondary importance to a Fed which had gotten the tap on the shoulder by the Biden admin and its Democratic cronies on the Hill, terrified about their re-election chances now that the snake of Identity Politics is finally eating its poisonous tail. Indeed, almost as if having seen the collapse in the recent approval polls, Biden’s handlers made some very persuasive phone calls to the Fed. After all, only something as ridiculous – and serious – as steady political pressure can explain the unprecedented U-Turn by the Fed chair, one which even shocked Powell’s own mouthpiece, Nikileaks, who commented on the “Powell pivot” saying “what a difference two weeks can make.”
But markets are behaving as if The Fed will begin cutting rates. Look at the US 2-year Treasury yield on Wednesday AFTER the Fed minutes were released.
Bear in mind that mortgage rates are up 149% under Biden. And mortgage payments up 88%. Yikes!
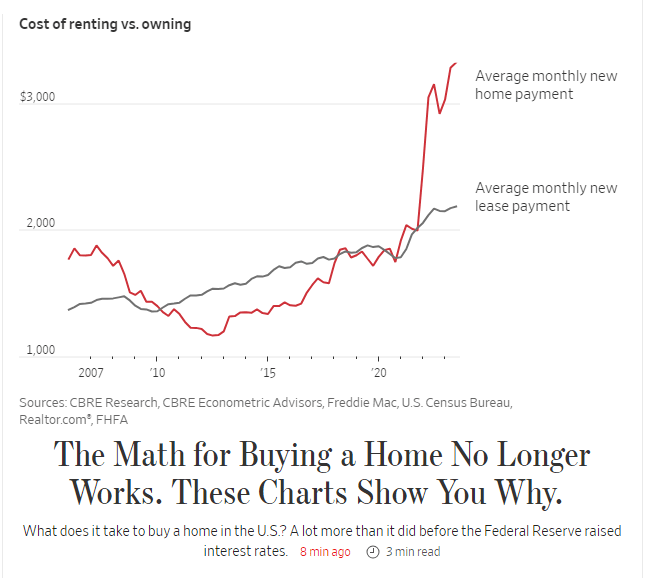
President Gerald For (R-MI) might be best known for his silly attempt at “whip inflation NOW” by having “Music Man” Meredith Wilson write a song: “Whip Inflation Now!” But the second line has been forgotten: “Eat crow instead of cow.” That second line is appropriate for Bidenomics which has left America’s middle class eating crow in the housing market.
The Wall Street Journal had an interesting piece showing the rise of 30-year fixed rate mortgage payments under Biden where the average monthly new mortgage payment is now $3,222, up from $1,787, up 86%!
The 86% rise in mortgage payments is two fold. First, home prices are up 33.2% under Biden and the 30-year mortgage rate is up 181%.
Yes, Americans are eating crow under the utter failure known as Bidenomics: top down government mandates for massive green energy and other nonsense.
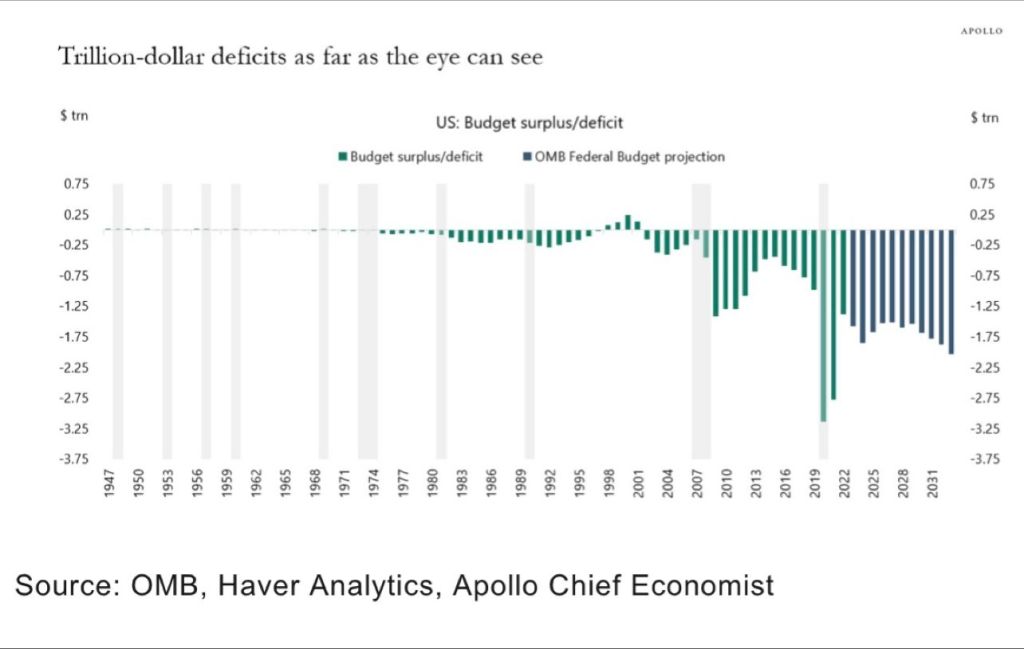
We are on a Highway To Hell! Massive Federal Budget deficits and staggering payments to Treasury from The Fed (losses on balance sheet) and $212 TRILLION in unfunded promises to the non-elites.
Under Modern Monetary Theory (or print money without consequences), we are seeing trillion dollars budget deficits with no end in sight. Nothing has been the same since the financial crisis of 2008 with The Fed’s massive intervention.
Then we have The Fed paying an ever growing amount to US Treasury for losses on their huge balance sheet.
The song “Running on Empty” by Jackson Browne comes to mind when analyzing the state of American banking, especially regional banks.
Yesterday we found out that inflows to money-market funds continue to be huge ($290BN in six weeks), and more importantly, regional banks’ usage of The Fed’s BTFP bailout facility surged to a new record high (even as regional banks surged…
Source: Bloomberg
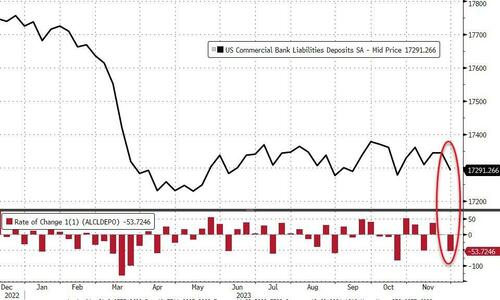
And so, with that shitshow in mind, we await the glorious manipulation of The Fed’s bank deposits data to reinforce that equity confidence.
On a seasonally-adjusted basis, banks saw a $53.7BN deposit outflow…
Source: Bloomberg
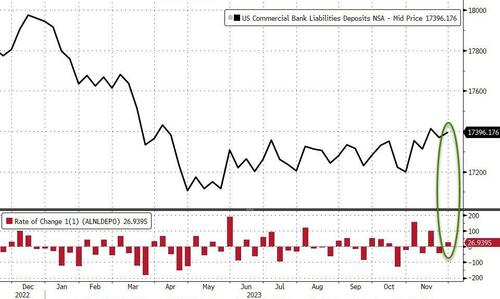
However, on a non-seasonally-adjusted basis, deposits rose by $27BN…
Source: Bloomberg
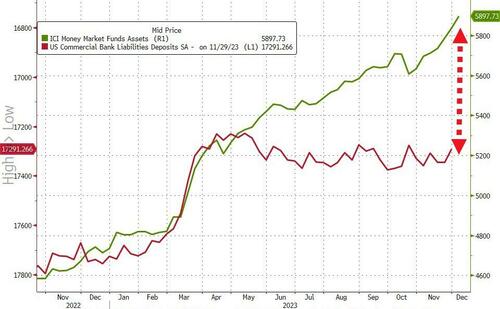
And even with the outflows (SA), the divergence between soaring money-market funds and bank deposits continues to widen…
Source: Bloomberg
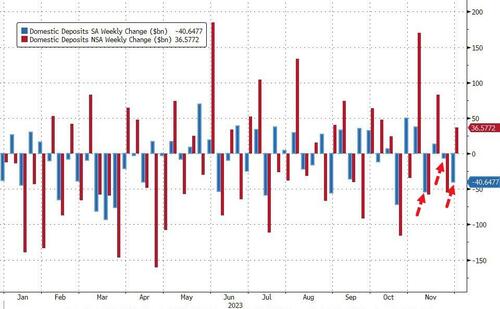
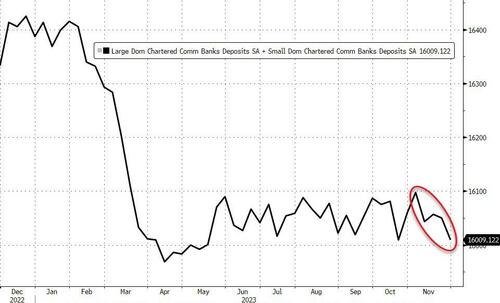
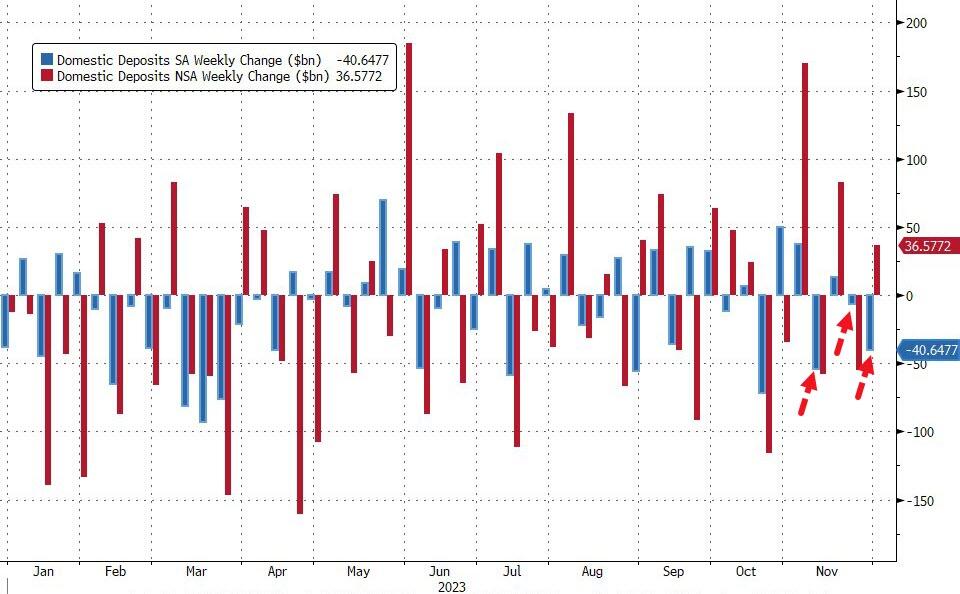
Excluding foreign bank deposits, domestic banks saw the third week of the last four of deposit outflows (-$40.6BN SA) with Large banks -$35BN (SA) and Small banks losing $5.7BN (SA). On an NSA basis, domestic banks saw inflows of $36.5BN last week with Large banks adding $32BN and Small banks adding $4BN…
Source: Bloomberg
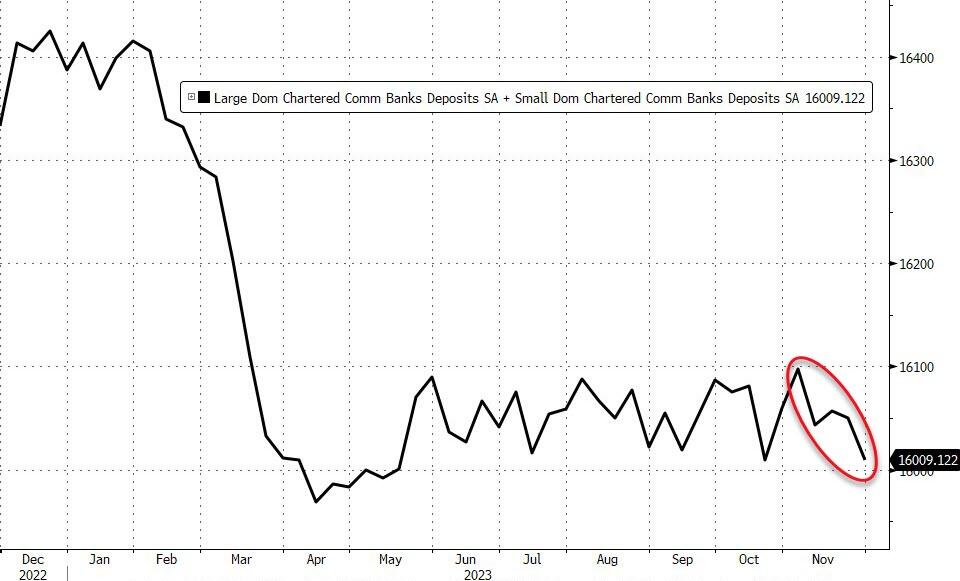
That adds up to $88BN (SA) of deposit outflows in the last four weeks (bank to its lowest total since May…
Source: Bloomberg
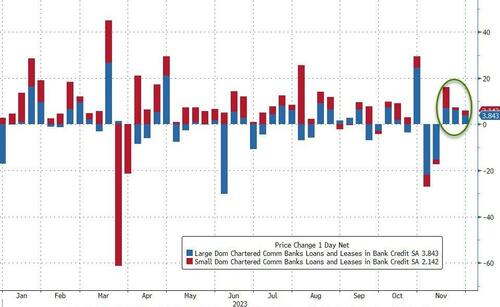
And on the other side of the ledger, despite deposits declining SA, loan volumes increased (SA) for the third week in a row with Small banks adding $2.1BN and Large banks adding $3.8BN…
Source: Bloomberg
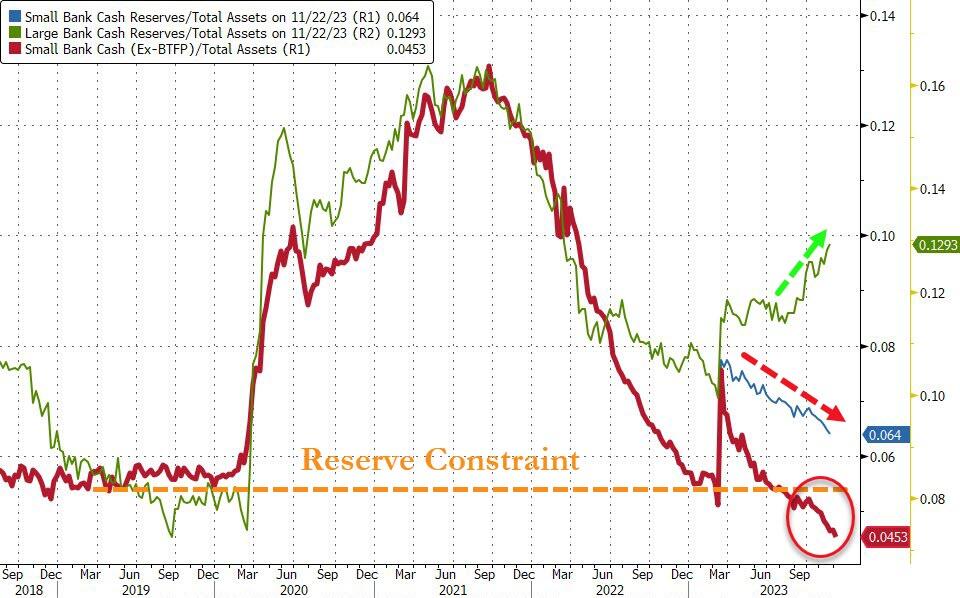
Finally, the key warning sign continues to trend ominously lower (Small Banks’ reserve constraint), supported above the critical level by The Fed’s emergency funds (for now)…
Source: Bloomberg
As the red line shows, without The Fed’s help, the crisis is back (and large bank cash needs a home – green line – like picking up a small bank from the FDIC).
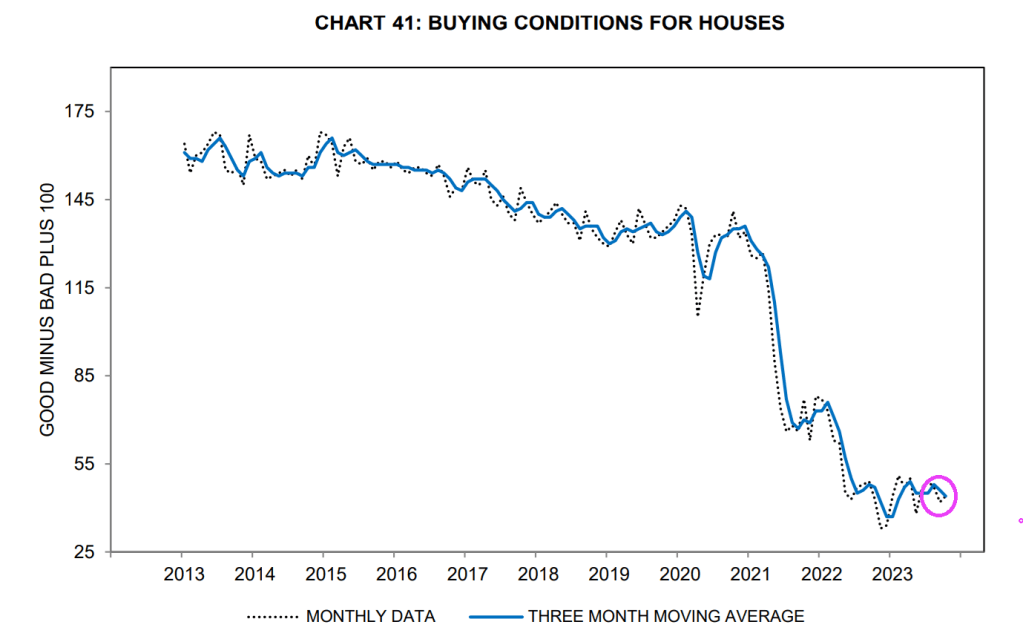
Mortgage rates, despite coming down recently, are still up 151% under Biden. And home prices are up 33.2%. So much for affordable housing for those renting.
So, “Running on Empty” applies to middle class and their ability to afford housing.
Why are buying conditions for houses so low? Well, mortgage rates, despite coming down recently, are still up 151% under Clueless Joe. And home prices are up 33.2% under Biden. So much for affordable housing for those renting.
Like the great Shoeles Joe Jackson on ChiSox and Cleveland Indian fame, Clueless Joe Biden cheated too. Except that Shoeless Joe was accused of accepting $5,000 to throw the World Series in 1919. Clueless Joe Biden and family are accused of accepting over $24 million from China, Ukraine, etc.
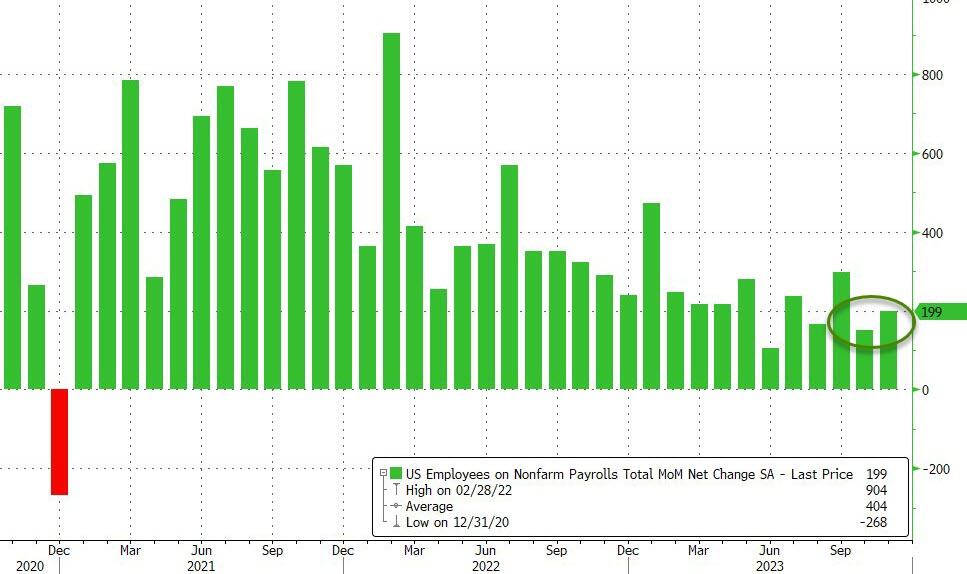
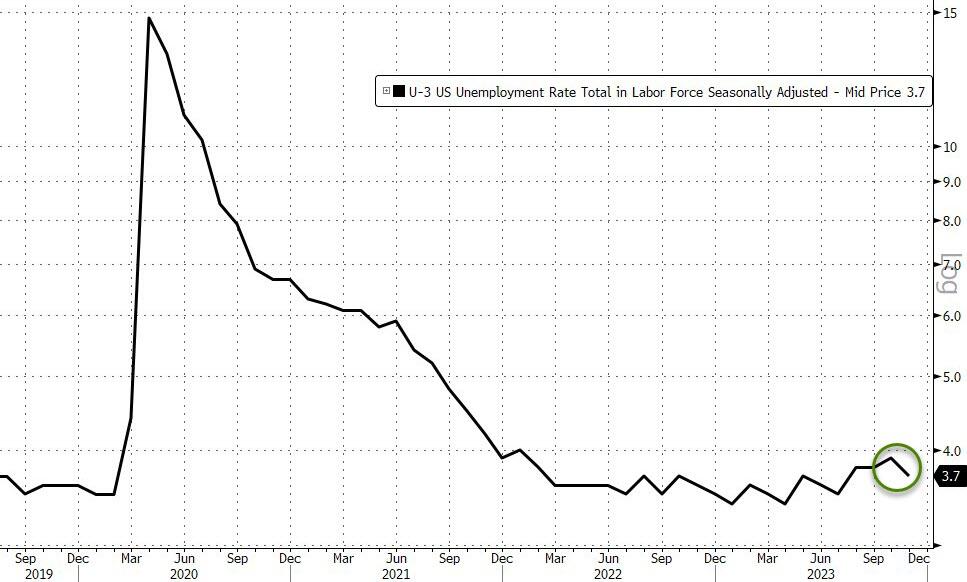
Several talking heads are salivating about the strong or solid jobs report in October. As if The Federal Reserve can’t read the jobs report. I call the report “Government gone wild!” since 51k government jobs were added in October.
Job gains occurred in health care, government, and social assistance. Employment declined in manufacturing due to strike actvity.
Total nonfarm payroll employment increased by 150,000 in October, below the average monthly gain of 258,000 over the prior 12 months. In October, job gains occurred in health care, government, and social assistance. Employment in manufacturing declined due to strike activity. (See table B-1.) Health care added 58,000 jobs in October, in line with the average monthly gain of 53,000 over the prior 12 months. Over the month, employment continued to trend up in ambulatory health care services (+32,000), hospitals (+18,000), and nursing and residential care facilities (+8,000). Employment in government increased by 51,000 in October and has returned to its pre-pandemic February 2020 level. Monthly job growth in government had averaged 50,000 in the prior 12 months. In October, employment continued to trend up in local government (+38,000). Social assistance added 19,000 jobs in October, compared with the average monthly gain of 23,000 over the prior 12 months. Over the month, employment continued to trend up in individual and family services (+14,000). In October, construction employment continued to trend up (+23,000), about in line with the average monthly gain of 18,000 over the prior 12 months. Employment continued to trend up over the month in specialty trade contractors (+14,000) and construction of buildings (+6,000). Employment in manufacturing decreased by 35,000 in October, reflecting a decline of 33,000 in motor vehicles and parts that was largely due to strike activity. In October, employment in leisure and hospitality changed little (+19,000). The industry had added an average of 52,000 jobs per month over the prior 12 months. Employment in professional and business services was little changed in October (+15,000) and has shown little net change since May.
Speaking of Govzilla, my favorite quote showing the stupidity of BIG government is … Biden’s climate envoy John Kerry. “We’ve got to cut down on farming due to ‘Climate Change’…or people are going to starve…”


You must be logged in to post a comment.