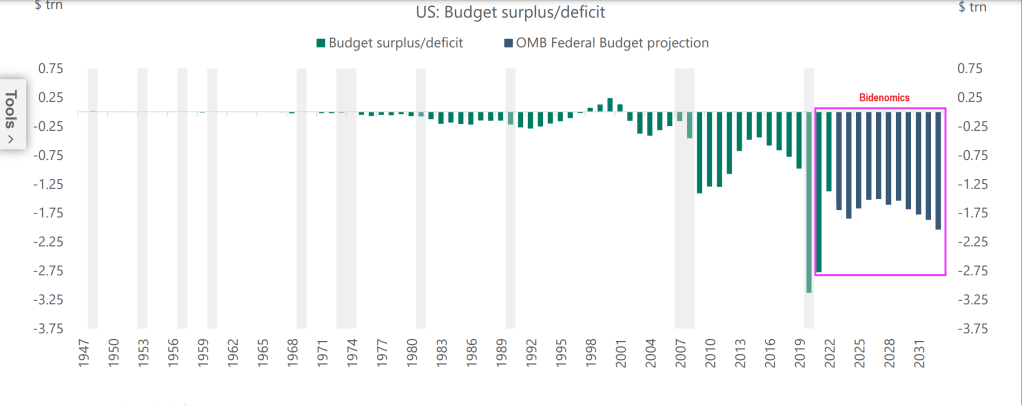
The great Will Rogers once said he never met a man he didn’t like. US President Joe Biden and Democrats have never met a spending opportunity they didn’t like (except for US border security, of course).
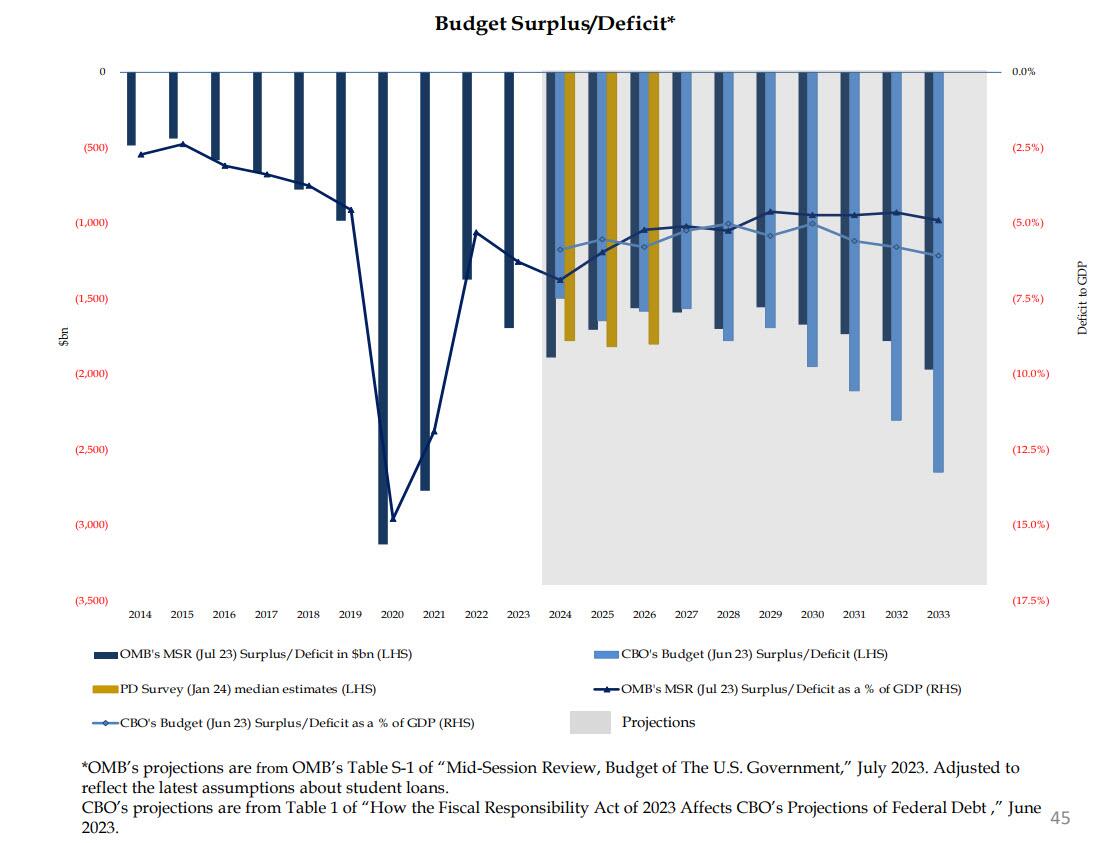
Under “Deficit Joe” Biden, Federal budget deficits have soared! And deficits are projected to grow!
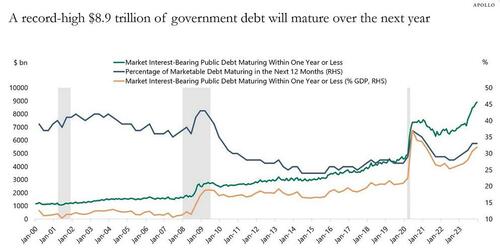
The problem, as Apollo’s gloomy chief strategist Torsten Slok points out, is that this feverish pace will only accelerate further, as a record $8.9 trillion of government debt will mature over the next year.
Meanwhile, the government budget deficit in 2024 will be $1.4 trillion according to the CBO (realistically expect this number to hit $2.0 trillion), and the Fed has been running down its balance sheet by $60 billion per month.
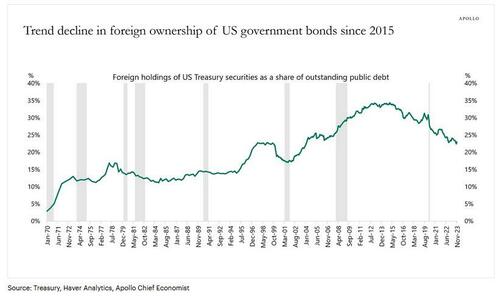
The bottom line is that someone will need to buy more than $10 trillion in US government bonds in 2024. That is more than one-third of US government debt outstanding. And more than one-third of US GDP.
This may be a particular challenge when the biggest holders of US Treasuries, namely foreigners, continue to shrink their share.
More fundamentally, Slok muses, “interest rate-sensitive balance sheets such as households, pension, and insurance have been the biggest buyers of Treasuries in 2023, and the question is whether they will continue to buy once the Fed starts cutting rates.”
(Spoiler alert: no… but that’s what QE is for, and sooner or later, it’s coming back).
Apollo’s latest updated outlook on Treasury demand is below (pdf link).
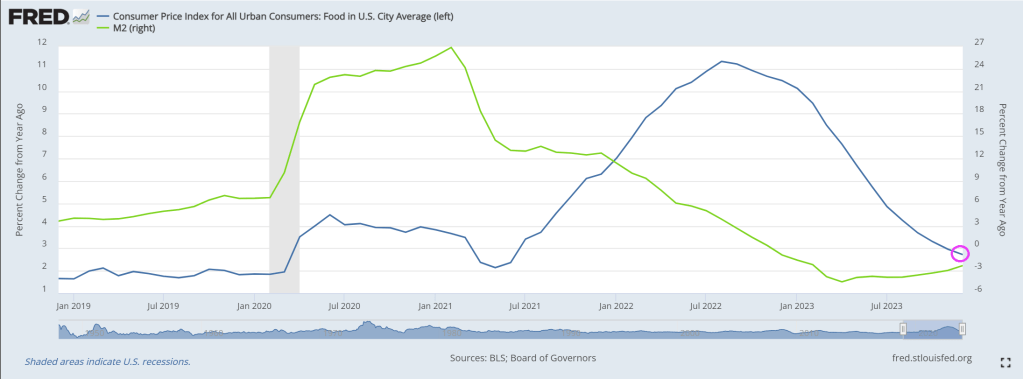
The Biden Administration which motto should be “Make Crime Great Again!” with awful crime in big cities, and millions pouring over the border, not to mention providing jobs for foreign workers and not native born Americans, is likely breathing a sigh of relief as food inflation falling to 2.7% year-over-year, still higher than pre-Covid levels under Trump. But at least food price inflation is slowing as The Fed’s money stimulus recedes.
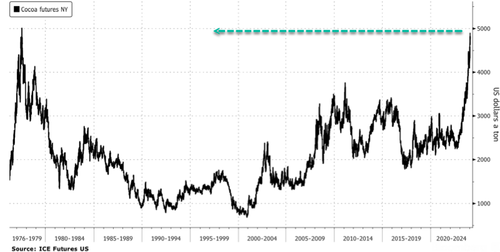
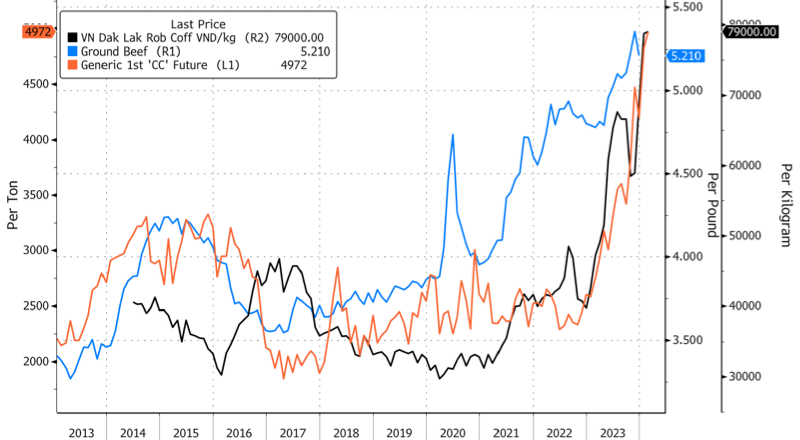
Cocoa prices climbed to a 46-year high this week in New York as concerns about dry conditions across West Africa could reduce yields for the Ivory Coast, the world’s largest producer of cocoa beans, ahead of the mid-crop in April.
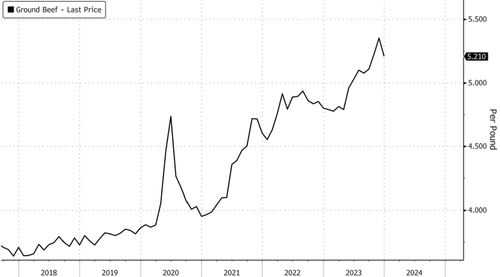
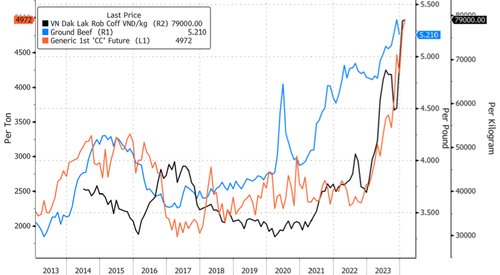
In the US, a rapidly shrinking cattle herd, now at the lowest levels in seven decades, has pushed the supermarket price of beef to a record of $5.21 per pound. Rising food prices are the central bank’s worst enemy.
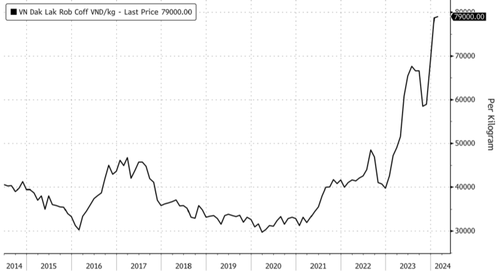
To end the week, breakfast lovers will be disappointed to learn robusta bean prices in Vietnam, the world’s largest producer of the bean, are absolutely out of control.
Local robusta prices in Vietnam hit a record on Thursday, topping nearly 80,000 per kilogram.
“That’s threatening to push prices in London up further, even after the benchmark capped its own all-time high this week at $3,336 a ton,” Bloomberg said, adding the surge in prices was primarily due to farmers “hoarding” the bean.
To recap this week, cocoa bean, beef, and robusta bean prices have been marching higher.
More bad news for Biden. Even though overall food inflation has receded, voters have long memories.
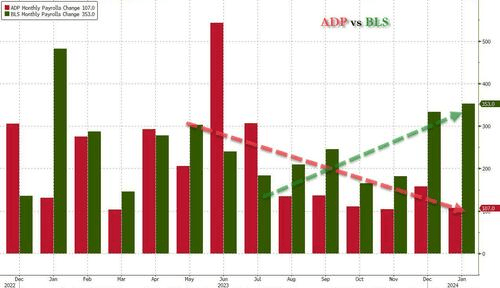
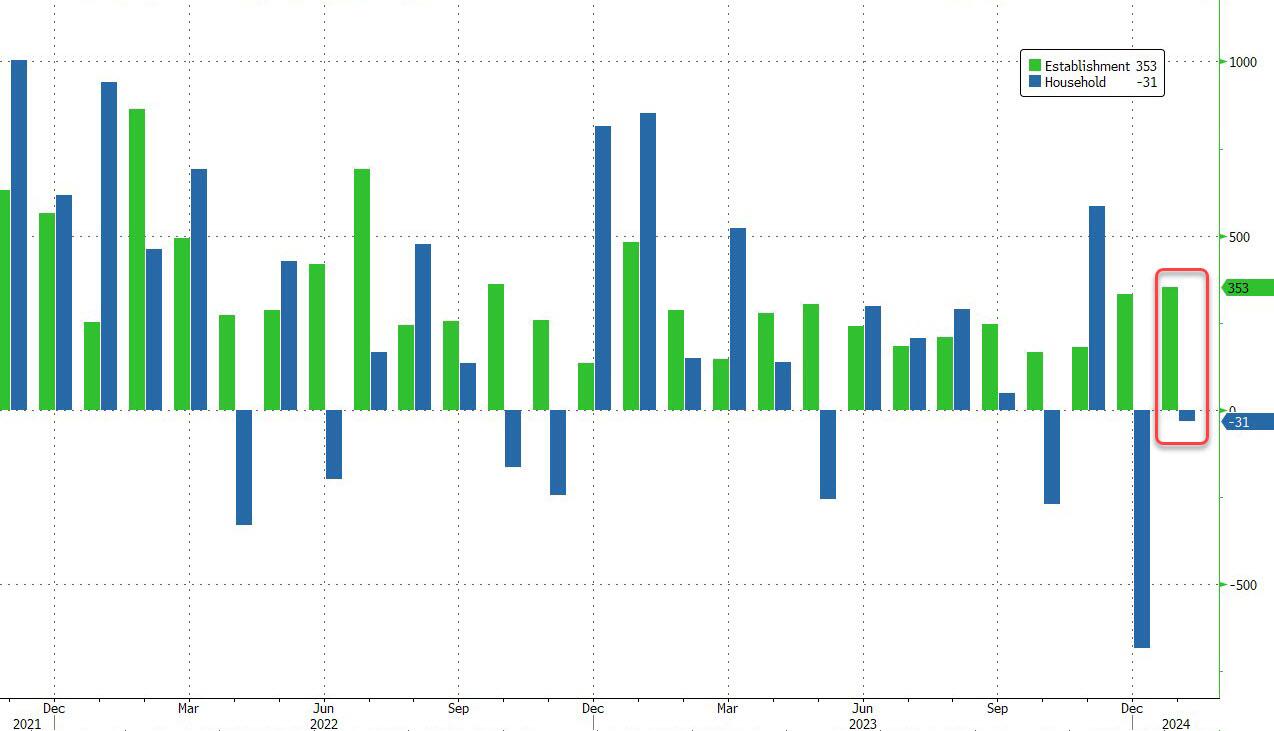
Today’s jobs report was UGLY! How when the US unexpectedly added 353K “jobs” – the most since January 2023. Remember, Biden is President. And apparenty El Presidente of Latin America, Africa and Asia.
Let me start with the official Biden jobs report versus the ADP jobs report from yesterday. BLS showed an amazing surge while ADP was sigalling a slowdown. Obviously, BLS is measuring employment differently (this is an election year after all). Like seasonal adjustments (always econometric voodoo).
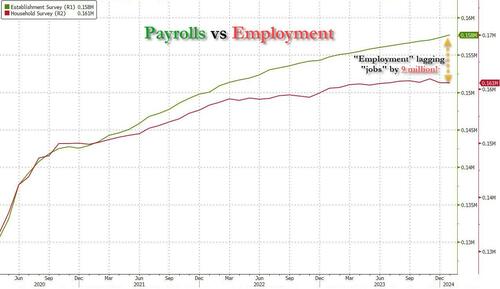
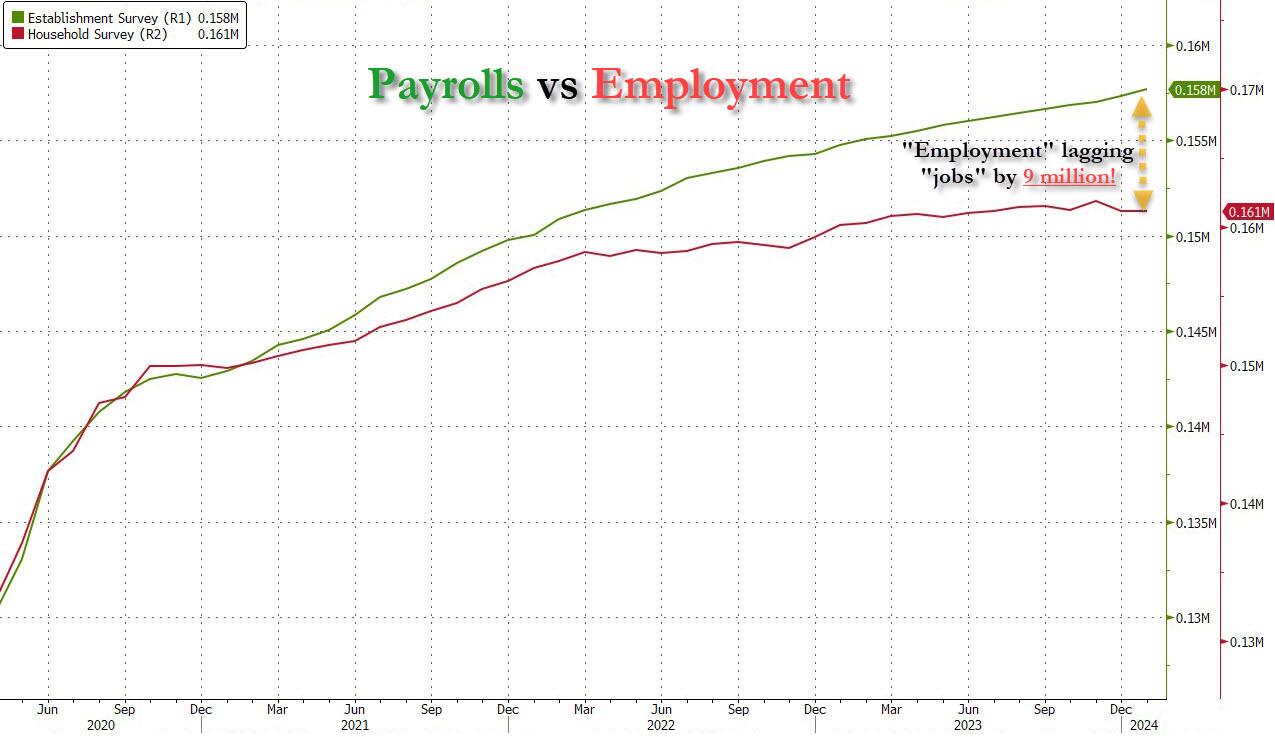
But it’s more than just the Biden admin hanging its “success” on seasonal adjustments: when one digs deeper inside the jobs report, all sorts of ugly things emerge… such as the latest divergence between the Establishment (payrolls) and much more accurate Household (actual employment) survey. To wit, while in January the BLS claims 353K payrolls were added, the Household survey found that the number of actually employed workers dropped again, this time by 31K (from 161.183K to 161.152K).
This means that while the Payrolls series hits new all time highs every month since December 2020 (when according to the BLS the US had its last month of payrolls losses), the level of Employment has barely budged in the past year. Worse, as shown in the chart below, such a gaping divergence has opened between the two series in the past 4 years, that the number of Employed workers would need to soar by 9 million (!) to catch up to what Payrolls claims is the employment situation.
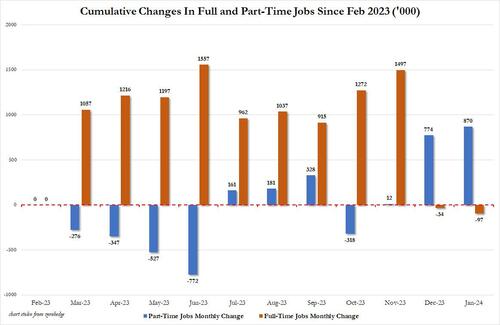
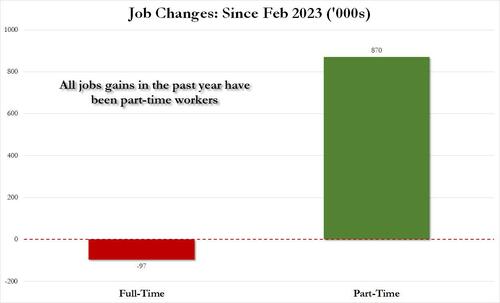
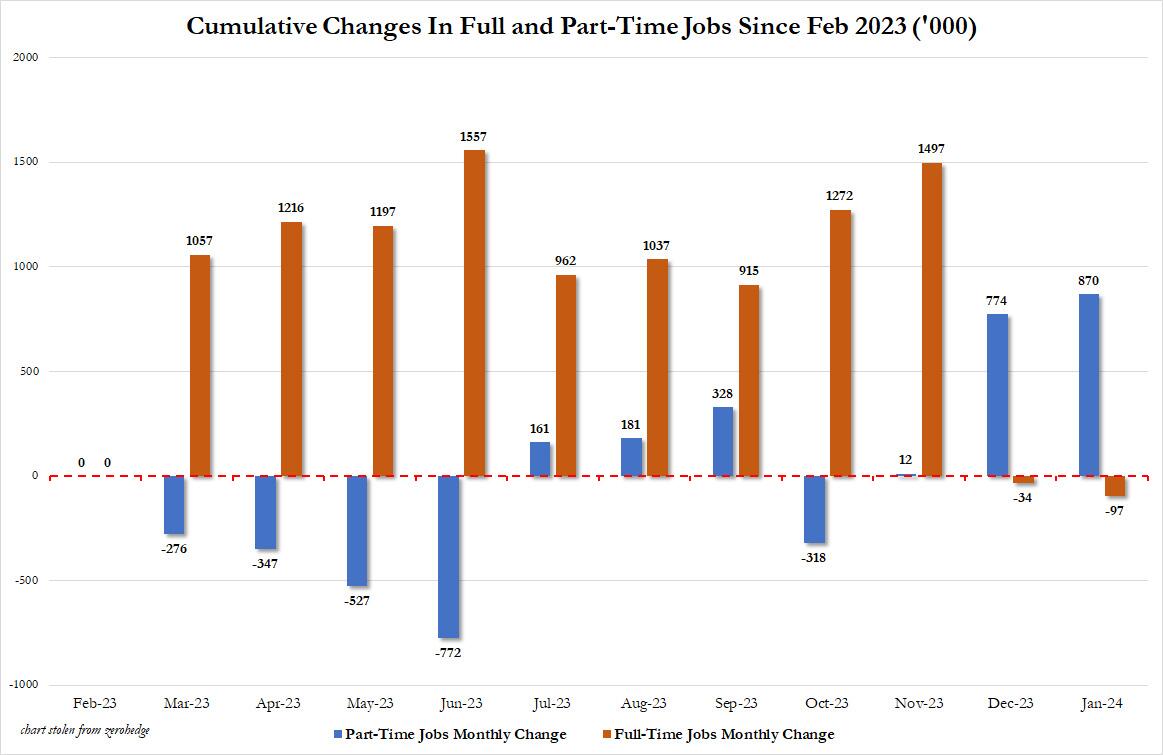
There’s more: shifting from a quantitative to a qualitative assessment, reveals just how ugly the composition of “new jobs” has been. Consider this: the BLS reports that in January 2024, the US had 133.1 million full-time jobs and 27.9 million part-time jobs. Well, that’s great… until you look back one year and find that in February 2023 the US had 133.2 million full-time jobs, or more than it does one year later! And yes, all the job growth since then has been in part-time jobs, which have increased by 870K since February 2023 (from 27.020 million to 27.890 million).
Here is a summary of the labor composition in the past year: all the jobs have been part-time jobs!
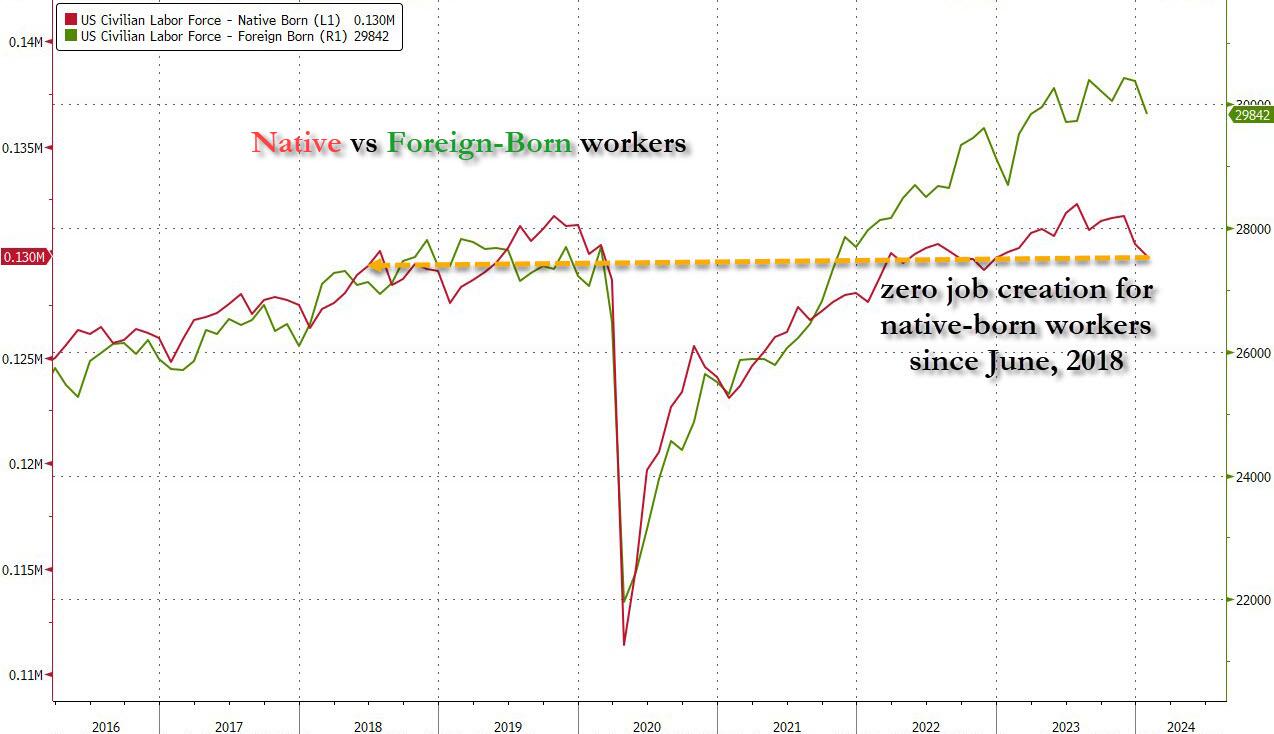
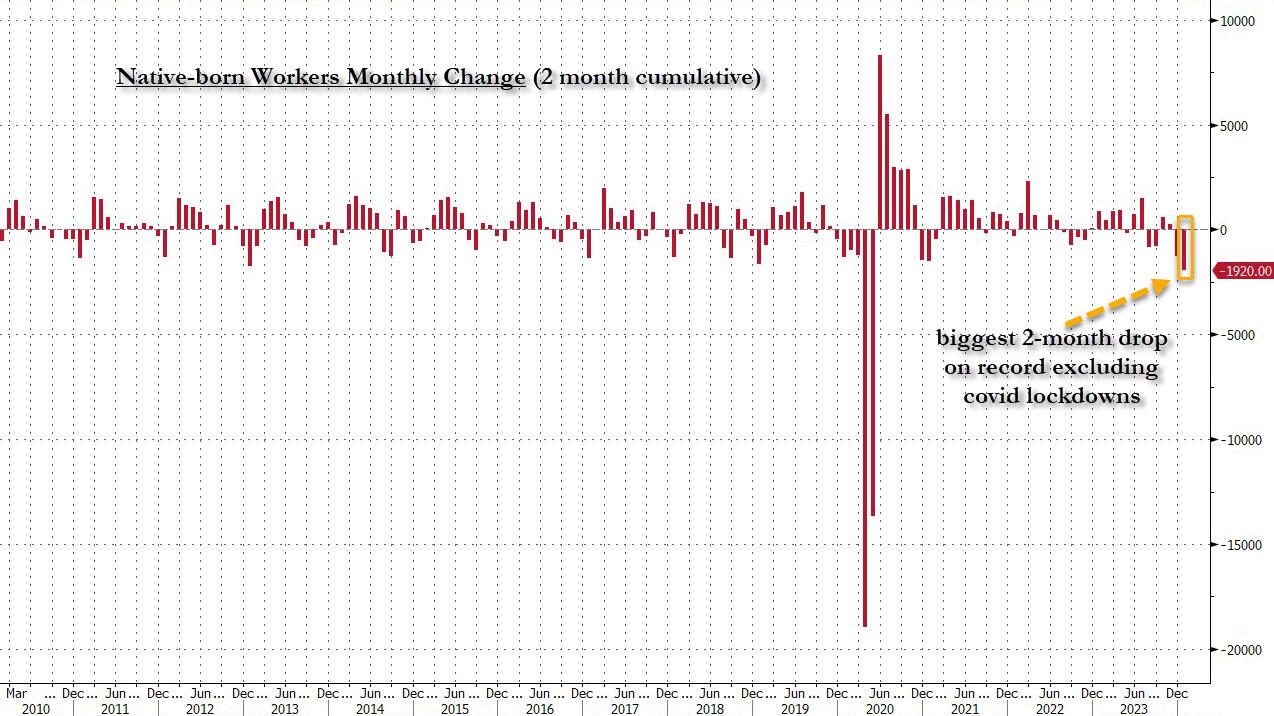
But wait there’s even more, because just as we enter the peak of election season and political talking points will be thrown around left and right, especially in the context of the immigration crisis created intentionally by the Biden administration which is hoping to import millions of new Democratic voters (maybe the US can hold the presidential election in Honduras or Guatemala, after all it is their citizens that will be illegally casting the key votes in November), what we find is that in January, the number of native-born worker tumbled again, sliding by a massive 560K to just 129.807 million. Add to this the December data, and we get a near-record 1.9 million plunge in native-born workers in just the past 2 months!
Said otherwise, not only has all job creation in the past 4 years has been exclusively for foreign-born workers, but there has been zero job-creation for native born workers since July 2018!
This is a huge issue – especially at a time of an illegal alien flood at the border – and is about to become a huge political scandal, because once the inevitable recession finally hits, there will be millions of furious unemployed Americans demanding a more accurate explanation for what happened – i.e., the illegal immigration floodgates that were opened by the Biden admin.
Which is also why the Biden admin will do everything in his power to insure there is no official recession before November… and is why after the election is over, all economic hell will finally break loose. Until then, however, expect the jobs numbers to get more and more ridiculous.
I wonder if “Union Joe” is telling US labor union about no growth for native (American born) workers.
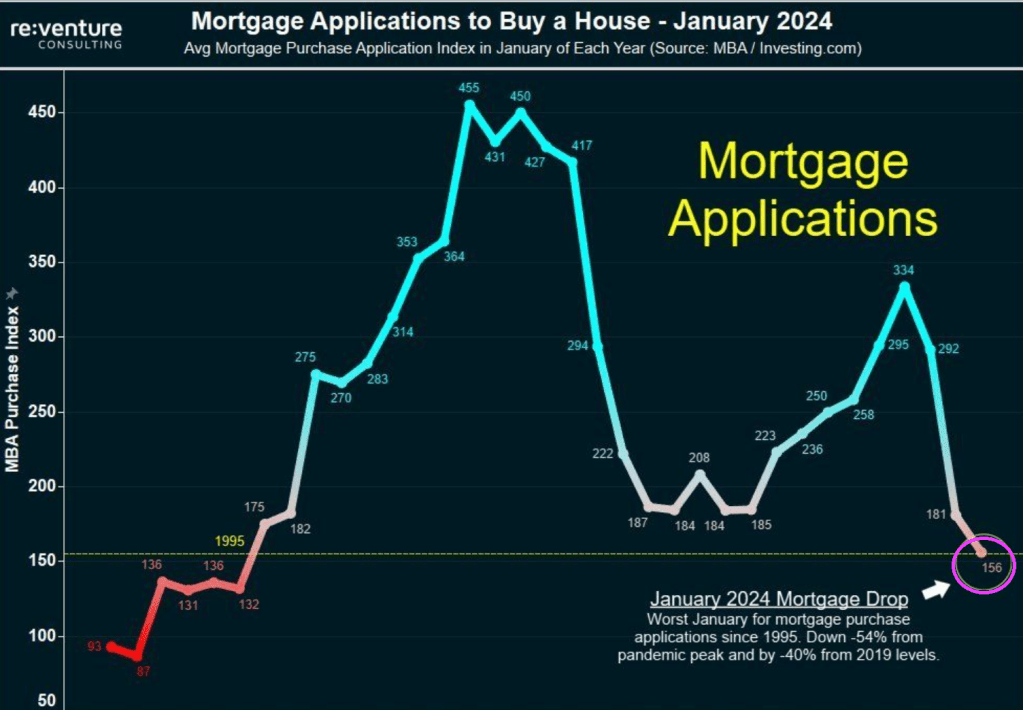
Yikes! Bidenomics is a disaster! MBA mortgage purchase applications are down 54% from Pandemic Peak. I was going to play “The Wreck of the Edmund Fitzgerald” by Gordon Lightfoot and rename it “The Wreck of The US Economy.”
Mortgage demand fell to a new 30-year low in January 2024, down 54% from the pandemic peak. Mortgage demand is down 14% over the last year and 40% from pre-pandemic levels.
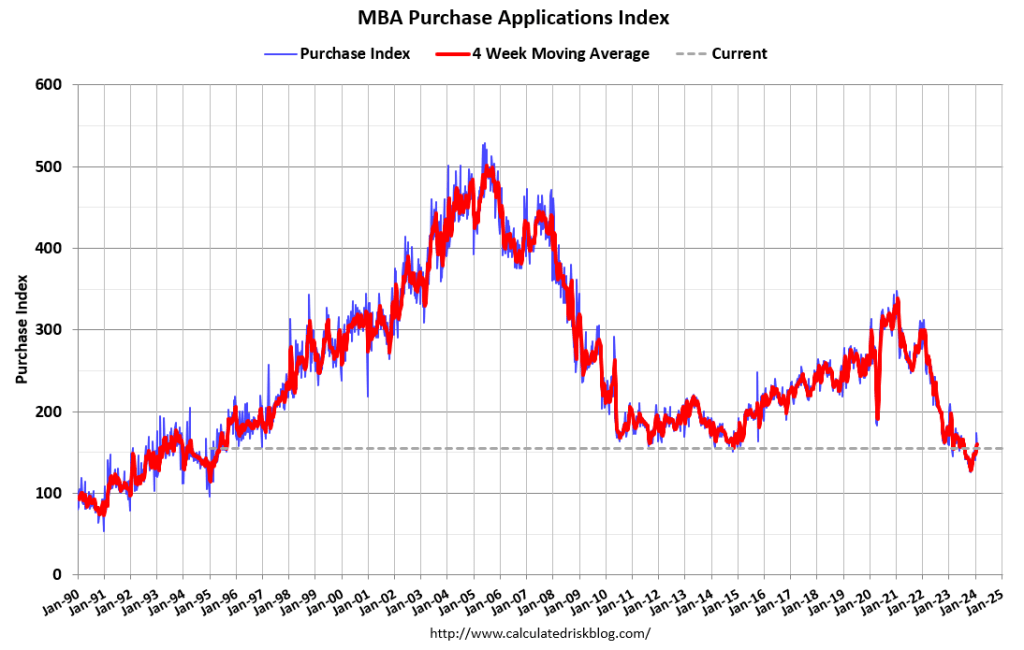
Mortgage applications decreased 7.2 percent from one week earlier, according to data from the Mortgage Bankers Association’s (MBA) Weekly Mortgage Applications Survey for the week ending January 26, 2024. Last week’s results included an adjustment to account for the MLK holiday.
The Market Composite Index, a measure of mortgage loan application volume, decreased 7.2 percent on a seasonally adjusted basis from one week earlier. On an unadjusted basis, the Index increased 8 percent compared with the previous week. The Refinance Index increased 2 percent from the previous week and was 3 percent higher than the same week one year ago. The seasonally adjusted Purchase Index decreased 11 percent from one week earlier. The unadjusted Purchase Index increased 6 percent compared with the previous week and was 20 percent lower than the same week one year ago.
Constitution Avenue in Washington DC is actually becoming Tobacco Road. No, not the dysfunctional family of Georgia sharecroppers during the Great Depression, but the Treasury Borrowing Advisory Committee (TBAC).
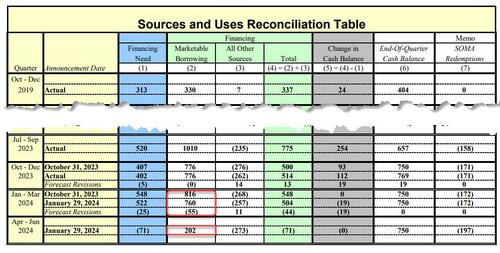
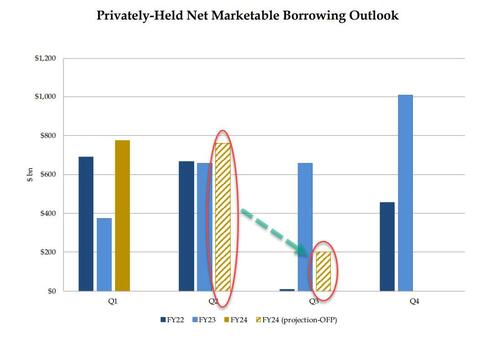
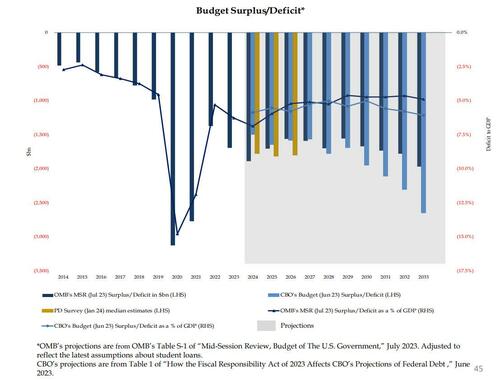
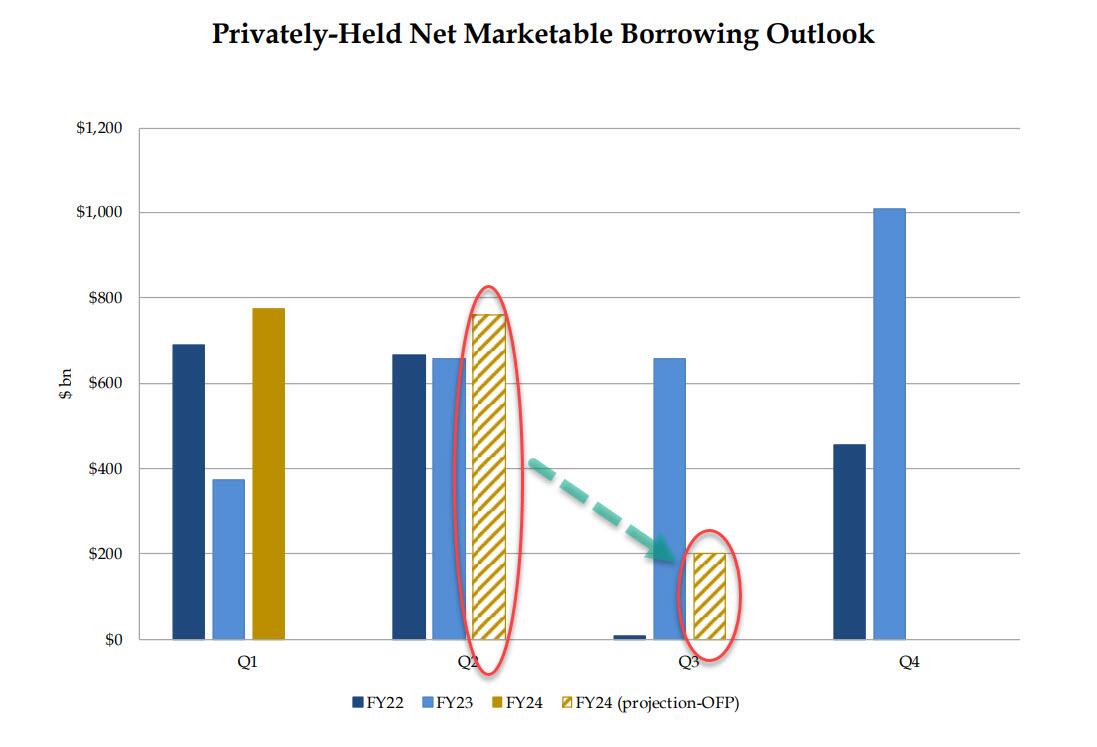
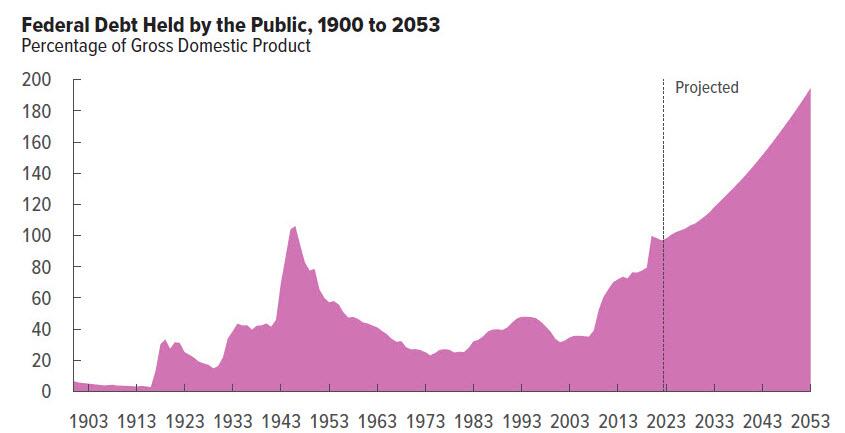
… yields tumbled as this was viewed as an aggressively dovish outlook on the future of i) the US fiscal deficit and ii) the debt needed to fund said deficit. Here is another way of visualizing the US historical and projected marketable debt funding needs:
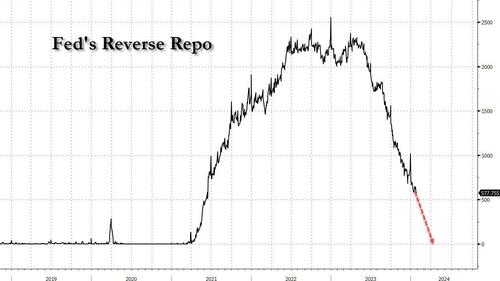
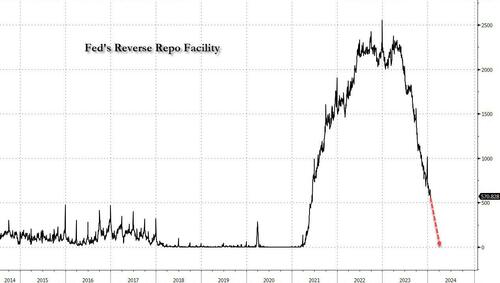
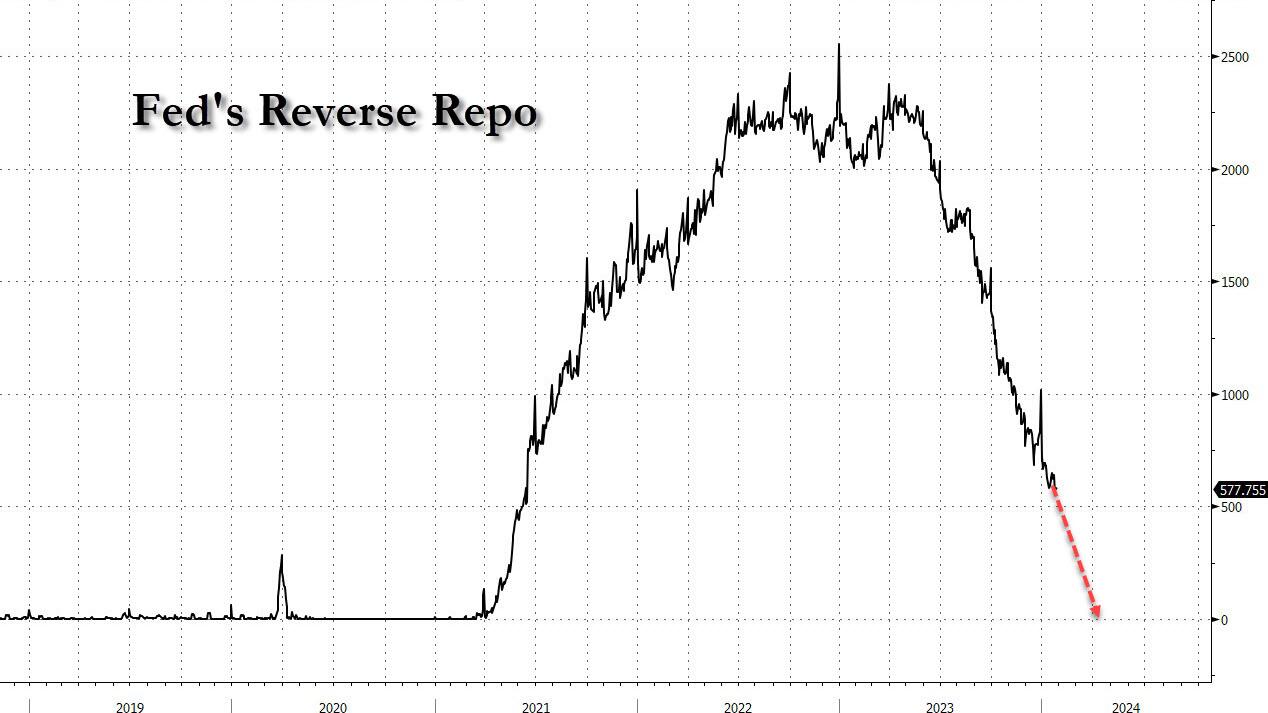
Commenting on this surprise drop in expected borrowing, on Monday we said that “the numbers also mean that the Reverse Repo facility will be fully drained by Q2, and we expect that on Wednesday we will learn that the bulk of the reduction in Q1 and Q2 estimates will be due to sharply lower Bill issuance for one simple reason: there is just no more Reverse Repo cash to buy it all.“
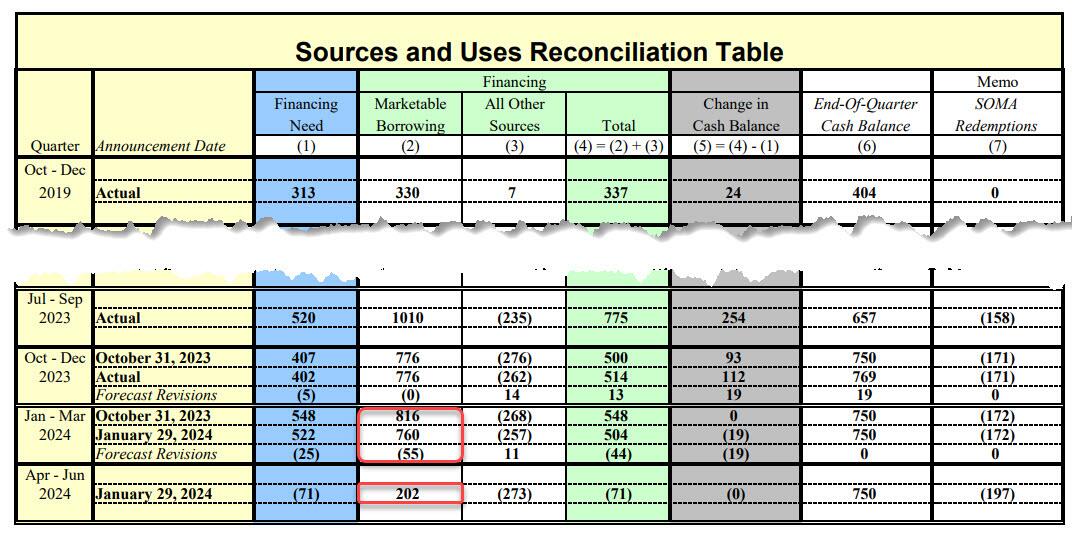
Boy, were we right: earlier today, in the Treasury’s presentation to the Treasury Borrowing Advisory Committee (TBAC) as part of the Quarterly Refunding, Janet Yellen revealed what the composition of this sharp drop in Q2 funding needs would be. As we expected, it was all bills!
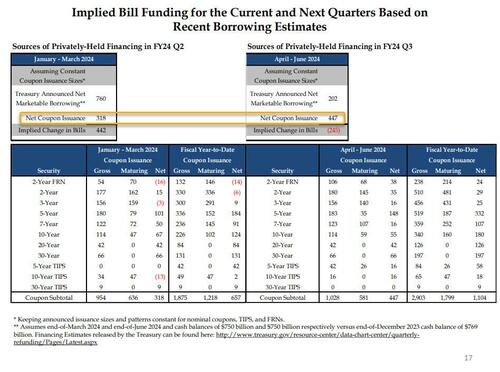
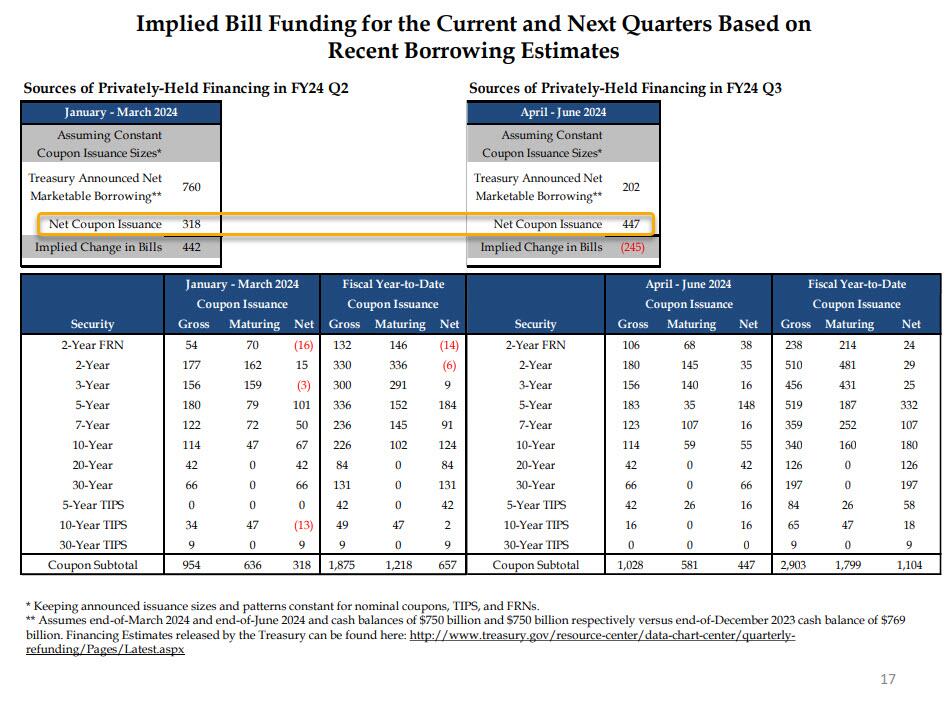
In fact, as the chart below – which we have dubbed the scariest chart in the Treasury’s presentation to TBAC today (link here) – shows, with Bills expected to fund some $442 Billion of the $760BN funding deficit in the Jan-March quarter (the balance of $318BN funded by coupons), in Q2 the Treasury now anticipates a $245BN DECLINE in net Bills outstanding (i.e., not only no incremental Bill funding but a quarter trillion maturity in Bills outstanding). In other words, while we expected a “sharply lower” Bill issuance in Q2, the Treasury is actually expecting a $245BN drawdown in Bills.
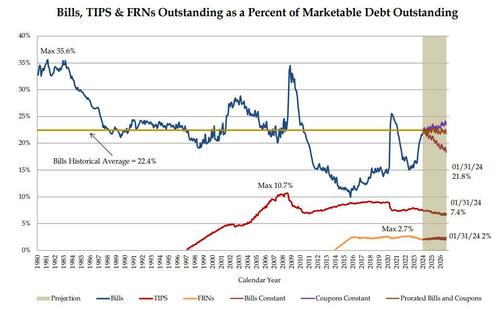
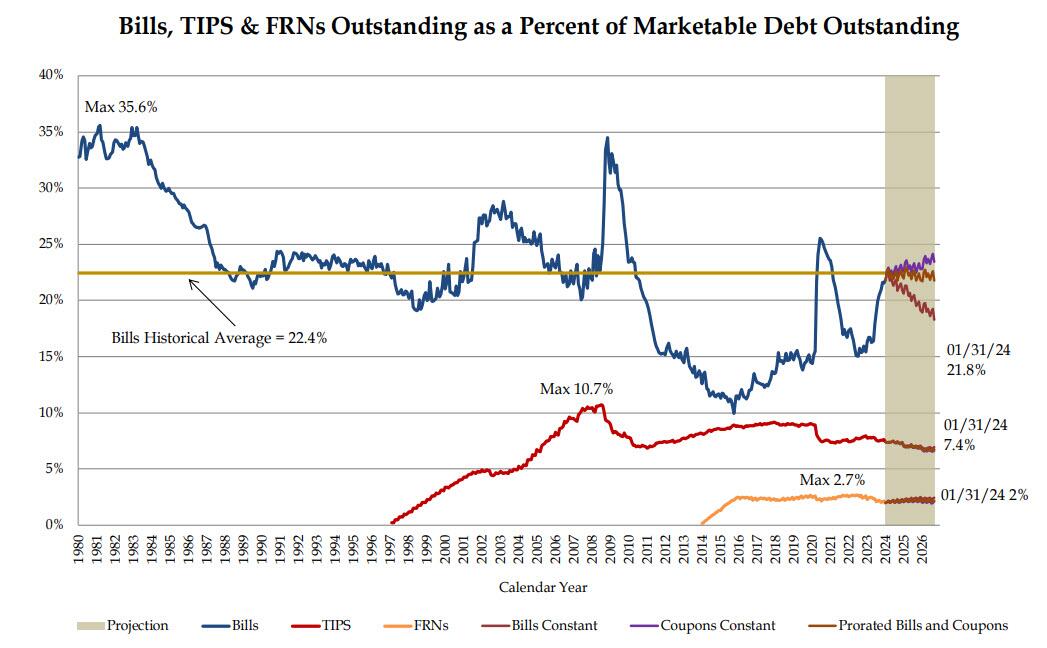
But wait, there’s more: because while the market was expecting some pro rata decline in coupon issuance to go with the slide in net Bills (we were not) in Q2 to justify the sharp drop in long-end yields, it was not meant to be. In fact, just the opposite, because as highlighted in the chart above, net Coupon issuance in Q2 is actually expected to increase by $130BN to $447BN from $318BN in Q1. This is a huge shift in higher duration supply, and is hardly what all those who were buying 10Y bonds on Monday were expecting, and yes, that too was to be expected: with Bills now well above the “comfortable” ceiling of 20% as a percentage of total debt outstanding, the Treasury had no choice but to roll it back, especially since the Reverse Repo is already mostly drained. And sure enough, in its presentation, the Treasury no longer anticipates a flood of Bill issuance in the future.
That’s not all: while the Treasury said it does “not anticipate needing to make any further increases in nominal coupon or FRN auction sizes, beyond those being announced today, for at least the next several quarters”, the TBAC politely disagreed, stating that “it may be appropriate over time to consider incremental increases in coupon issuance depending on how the current uncertainty regarding borrowing needs evolves” (translation: as the need to bribe the population with more fiscal stimmies ahead of November rises, so will borrowing needs).
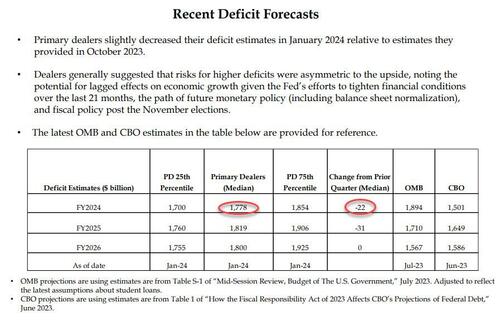
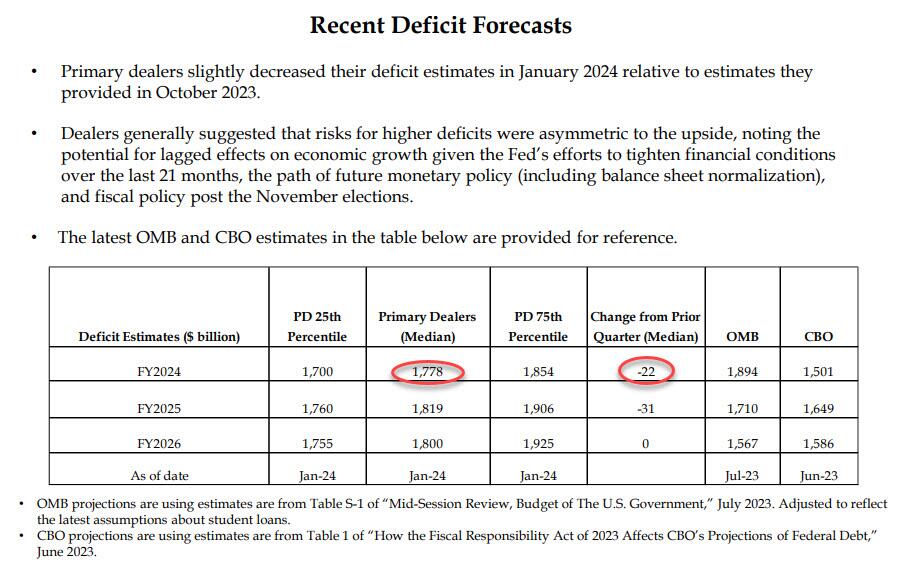
As for any naive expectations that any decline in issuance in structural instead of merely shifting away from Bills to Coupons, we have some more bad news: as the table below confirms, the Primary Dealer estimate of the US 2024 budget deficit dropped just $22BN in the past quarter, from $1.8 trillion to $1.778 trillion, a meaningless change (expect this number to rise sharply as the full brunt of fiscal stimulus in an election year become visible).
As for the bigger picture, well you can listen to either the Primary Dealers…
… or the CBO:
Both reach the same sad conclusion, the same one voiced by Nassim Taleb on Monday when he said that “we need something to come in from the outside, or maybe some kind of miracle…. This makes me kind of gloomy about the entire political system in the Western world.”
Sorry, Nassim, no miracles… just lots and lots of money printing coming.
And speaking of money printing, the fact that Bill issuance is about to grind to a halt in Q2 means that, just as we expected, reverse repo balances will tumble in the remaining two months of Q1…
… bringing it effectively to zero (which means the Treasury’s stock market liquidity pump is now almost drained), at which point the Fed will have to take over and taper QT as the alternative would be draining some $100BN in reserves every month at a time when total Fed reserves are already at the level which Waller hinted may be the infamous LoLCR floor which is a hard constraint at “10-11% of GDP.” The alternative is simple: a stock market crash just months before the November election, hardly the stuff Biden’s handlers or the anti-Trump Deep State would approve of.
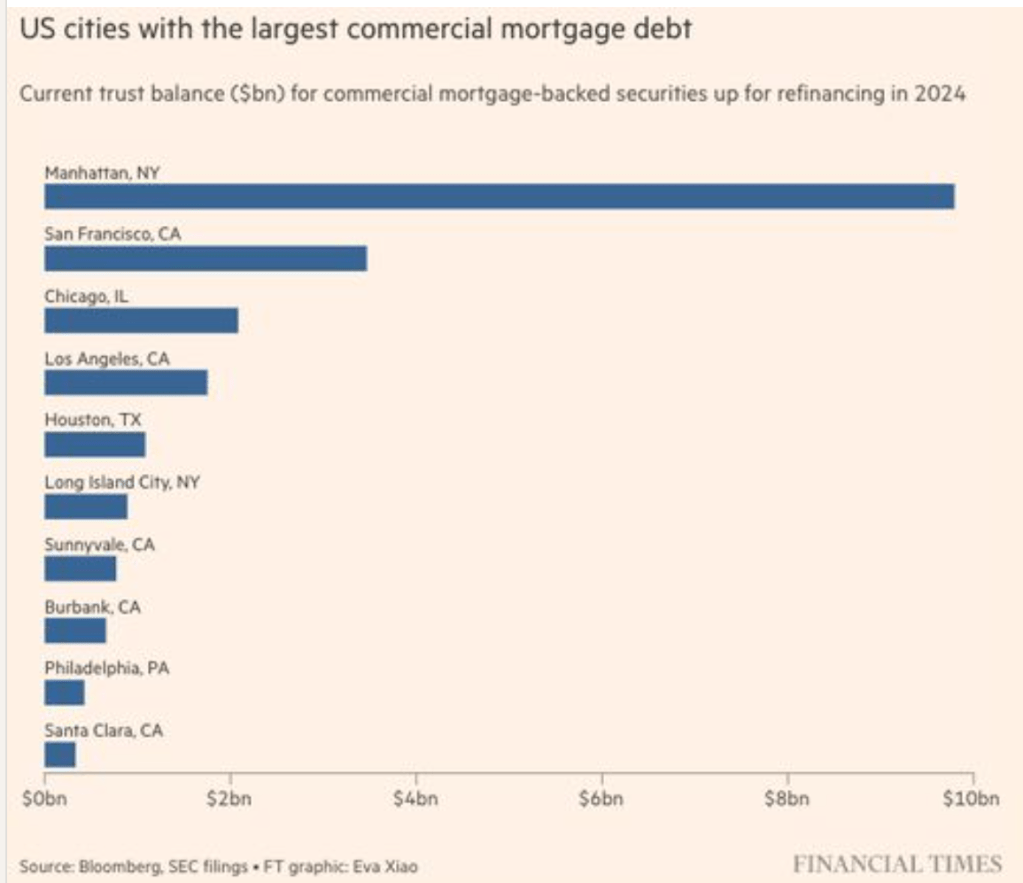
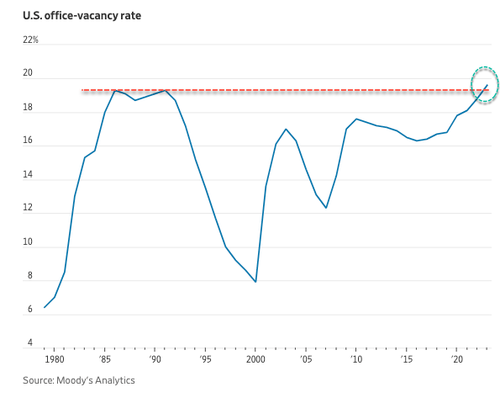
A Blackstone-owned Manhattan office tower with a $308 million mortgage is being marketed at a discounted rate of $150 million, representing a 50% reduction. The special servicer, Midland Loan Services, has enlisted Jones Lang LaSalle Inc. to facilitate the sale of the tower at 1740 Broadway. The bundled debt, included in a commercial mortgage-backed security, is marked with a 50% discount. In April, the tower was appraised at $175 million, a substantial 71% decline from its $605 million valuation in 2014 when the mortgage originated.
To put this into perspective, a new report by the Mortgage Bankers Association data, shows $117 billion in CRE office debt needs to be repaid or refinanced this year. Much of this debt is concentrated in major cities such as Manhattan, San Francisco, Chicago, and Los Angeles.
Compounding (or CONFOUNDING) the problem is the near 20% office vacancy rate.
Here is Fed Chair Jerome Powell who replaced now Treasury Secretary Janet Yellen.
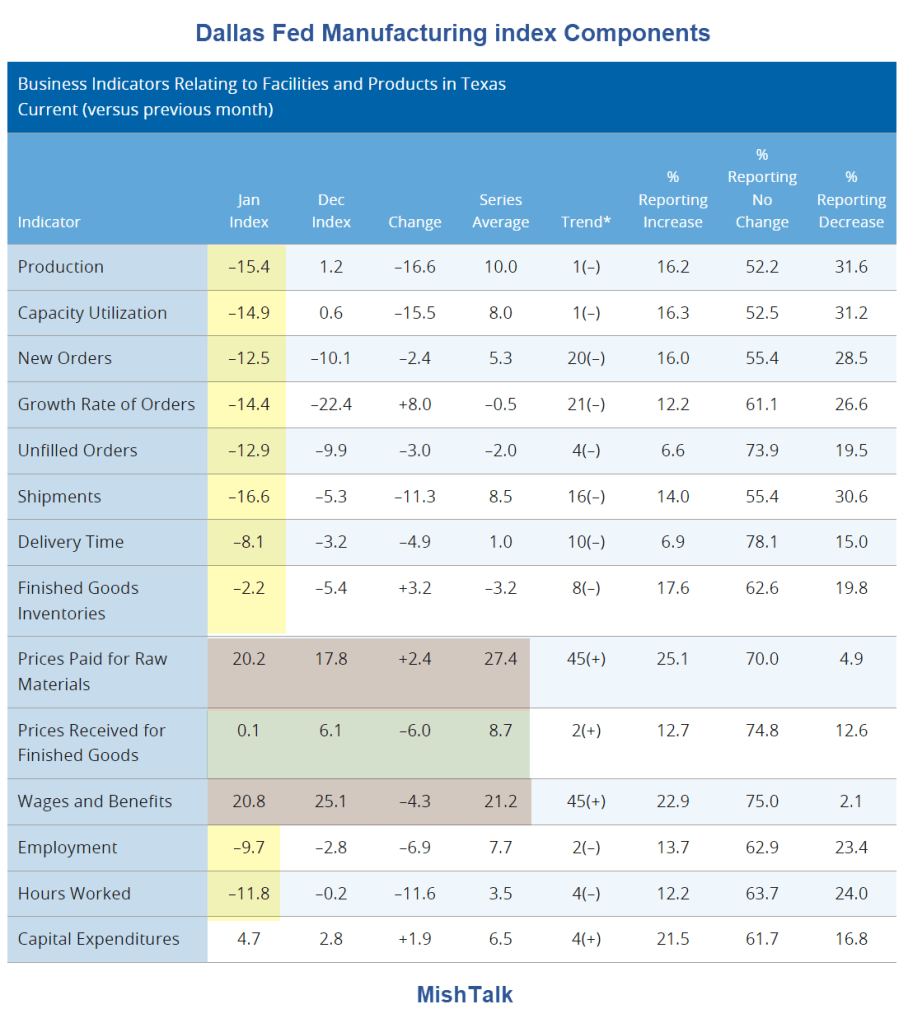
Other measures of manufacturing activity also indicated contraction this month. The new orders index ticked down from -10.1 to -12.5 in January, while the growth rate of orders index remained negative but pushed up eight points to -14.4. The capacity utilization index dropped to a multiyear low of -14.9, and the shipments index slipped 11 points to -16.6.
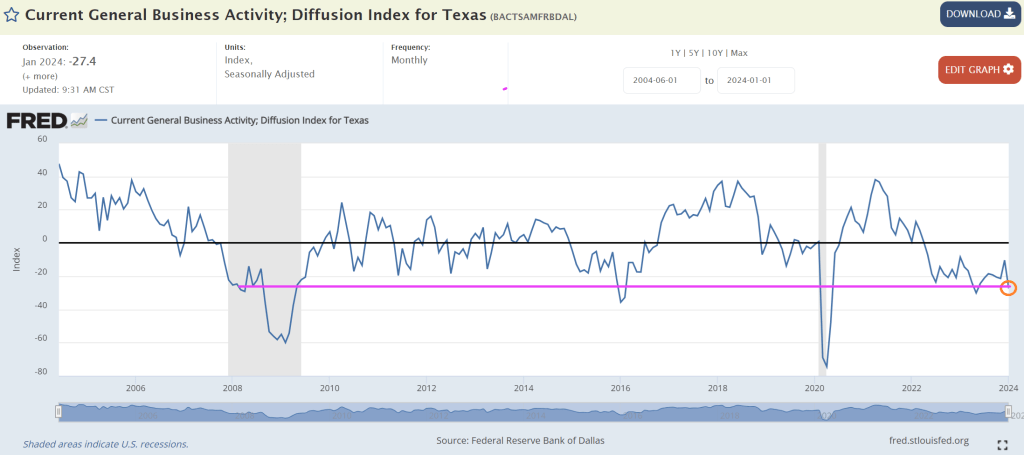
Perceptions of broader business conditions continued to worsen in January. The general business activity index fell from -10.4 to -27.4, and the company outlook index fell from -9.4 to -18.2. The outlook uncertainty index held fairly steady at 20.9.
Note that prices paid for raw materials soared by 20.2%.
Meanwhile, The Fed is impressed by the growth in the economy (primarily government jobs) so will likely keep rates constant this week. I wish they would look at Texas slumping!
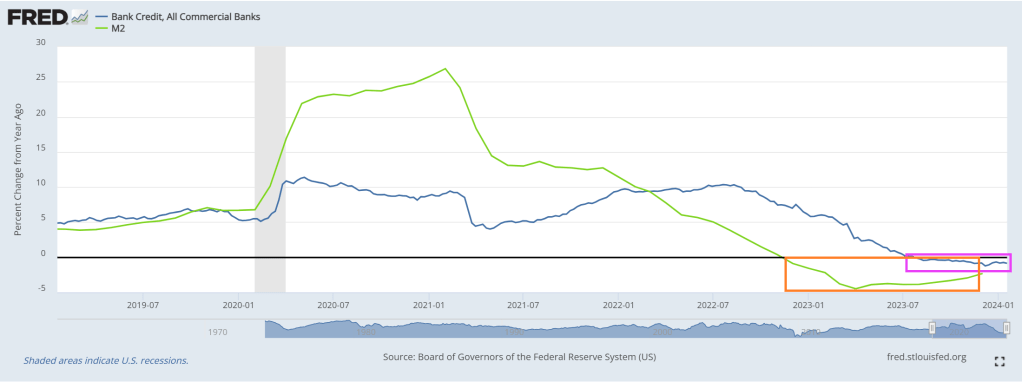
Where do we sit today? Bank credit growth has been negative for the last 26 weeks. As M2 Money growth has stalled.
What will The Fed do?
While the FOMC may start the discussions around tapering QT as soon as at this meeting, tapering itself is still a ways off, and the actual end of QT will come early next year.
In January and May 2022, the FOMC published the principles and then the plan for QT. The fact of a taper this year is not news. More recent communication from Fed officials (for example from President Logan and Governor Waller) reinforced a preference for the reverse repo (RRP) facility to be drawn down to zero, and we infer that getting the RRP near zero will be the starting point for the taper.
Historically, the FOMC has taken at least two meetings to finalize these types of plan, and the December minutes stressed a desire to give the market lots of advance notice. As a baseline, we think the FOMC announces the parameters for the QT taper at its May meeting and enacts that taper in June, by cutting the runoff of Treasury securities in half. Because the Fed’s RRP facility has been declining rapidly, that timing could shift earlier by a month or so.
The change to shedding $30 billion per month in Treasuries would slow the pace of runoff materially, but there is clearly a chance that the subsequent pace is even slower. President Logan pointed out that running off the balance sheet slowly could ultimately allow the Fed to shrink the balance sheet even more while mitigating the risk of money market disruptions. A June taper would be consistent with our house view on the path of the RRP facility, which we expect to stand at approximately $225 billion at the end of May and be depleted by August.
We anticipate that reserves will remain broadly around current levels until RRP is depleted. But from there, we think reserves will ultimately fall to roughly $3.2 trillion, around $300 billion below current levels, and the FOMC will call off QT in early 2025. That view on the ending level of reserves reflects our outlook on the SOFR – IORB (Secured Overnight Funding Rate – Interest on Reserve Balances) spread turning positive, indicating the end of abundant reserves.
For broader markets, however, our strategy team does not expect the tapering and end of QT to be a significant event. Our rates strategists think the phenomenon is mostly in the price and, if anything, front-end swap spreads may have already overreacted to the news of an early taper. With a limited effect on rates, and the tapering and end of QT largely anticipated, our MBS and credit strategists similarly see few if any implications. Of course, some market narrative is focused on QT’s effects on the banking sector. While the intuitive notion that QT must destroy deposits is widespread, we have highlighted the data which show in fact that deposits have edged up, not down, in recent months as QT has progressed. Banks can always choose to bid for wholesale deposits, so instead of focusing on the quantity of “money” and how that changes, a better question is how bank funding costs are evolving.
So, the next step is for the Fed to shift from “talking about talking about tapering QT” to actually talking about tapering QT. Only after that step will we start to look for the end of QT, which the Fed will determine with an eye on money market conditions. In particular, the Fed is looking at whether SOFR is trading below the rate the Fed pays on reserves, in which case it will likely judge conditions to be accommodative, or above the rate the Fed pays on reserves, in which case the Fed’s calculus will change and the discussions about the end of QT will pick up steam.
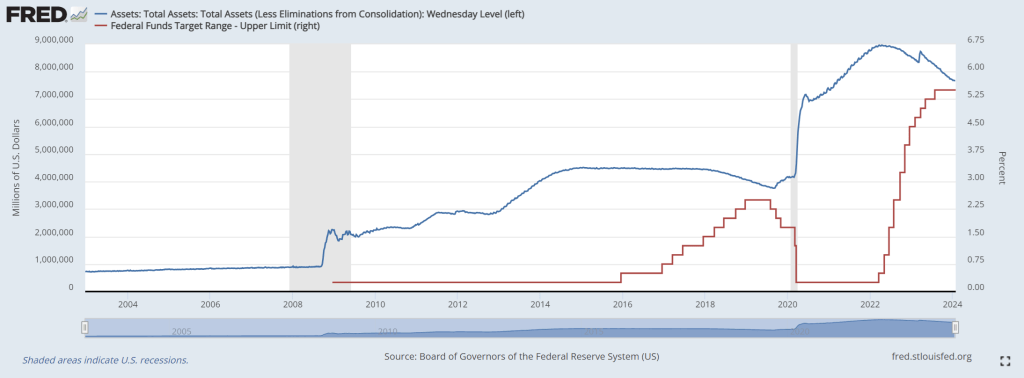
The Fed’s balance sheet remains greatly expanded despite the increase in The Fed’s target rate. Nothing has been the same since the banking crisis of 2008-2009. And Covid in 2020.
Joe, are you kidding about the sizzling economy? Karine Jean Pierre is also guilty of comedy or gross propaganda.
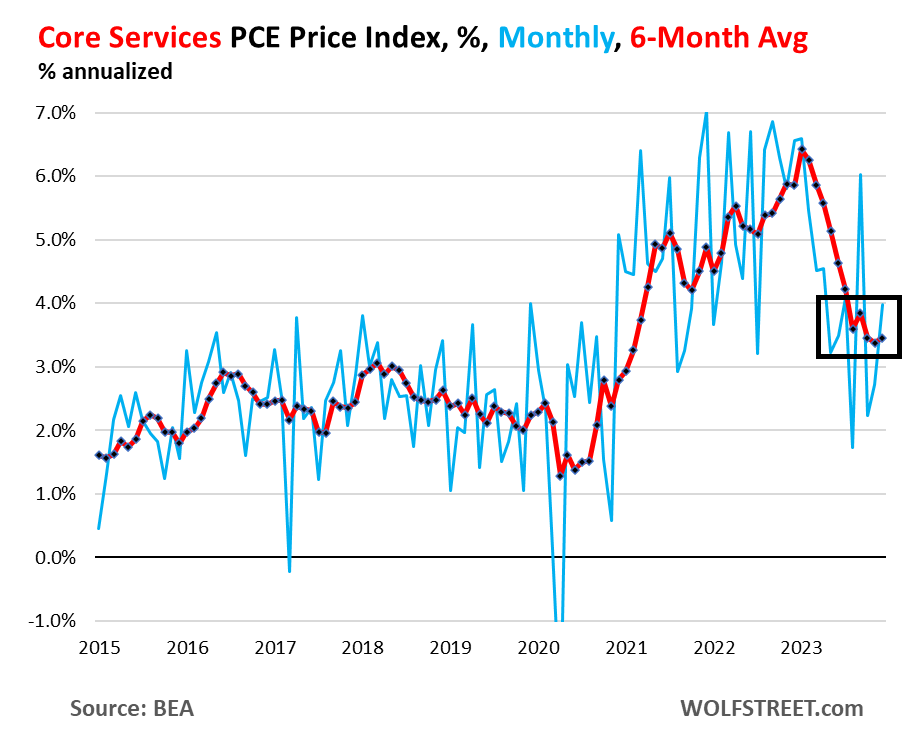
So right up front – and the Fed has been talking about this, though no one listens: The “core services” PCE price index has gotten stuck at 3.5% over the past six months annualized, and accelerated to 4.0% month-to-month annualized in December, with housing inflation stuck at about 6.7% over the past six months annualized, and with other core services components still red-hot.
The core services PCE price index rose by 0.33% in December from November, the second acceleration in a row, according to data from the Bureau of Economic Analysis today. This amounts to an increase of 4.0% annualized (blue).
The six-month moving average, which irons out the huge ups and downs of the month-to-month data, accelerated to 3.5%, and has been in this range since August, after the sharp deceleration in early 2023 (red).
Core services is where consumers spend the majority of their money, and they matter. Which is why Fed governors have said in near unison that they’re in no hurry to cut rates, but have taken a wait-and-see approach, with an eye on core services. And if it goes away, fine.
But on the surface, the PCE price index looks encouraging, and this has been the trend for months, with the overall PCE price index at +2.6% year-over-year in December, the lowest since March 2021; and with the core PCE price index at +2.9% year-over-year, also the lowest since March 2021, and aiming for the Fed’s 2% target.
The factors for the year-over-year cooling in these inflation measures have been the same for months: plunging energy prices, sharply dropping prices of durable goods after the huge spike in 2020 and 2021, cooling food inflation (with prices still rising from very high levels, but slowly), and favorable “base effects” when compared to a year ago.
But energy prices don’t plunge forever, so that will go away; durable goods prices don’t drop sharply forever either, though they can drop for a while longer to unwind some more of the price spike they’d been through in 2020 and 2021; and the base effects are going to get timed out this year, when the base of the year-over-year comparisons become the lower inflation figures of 2023.
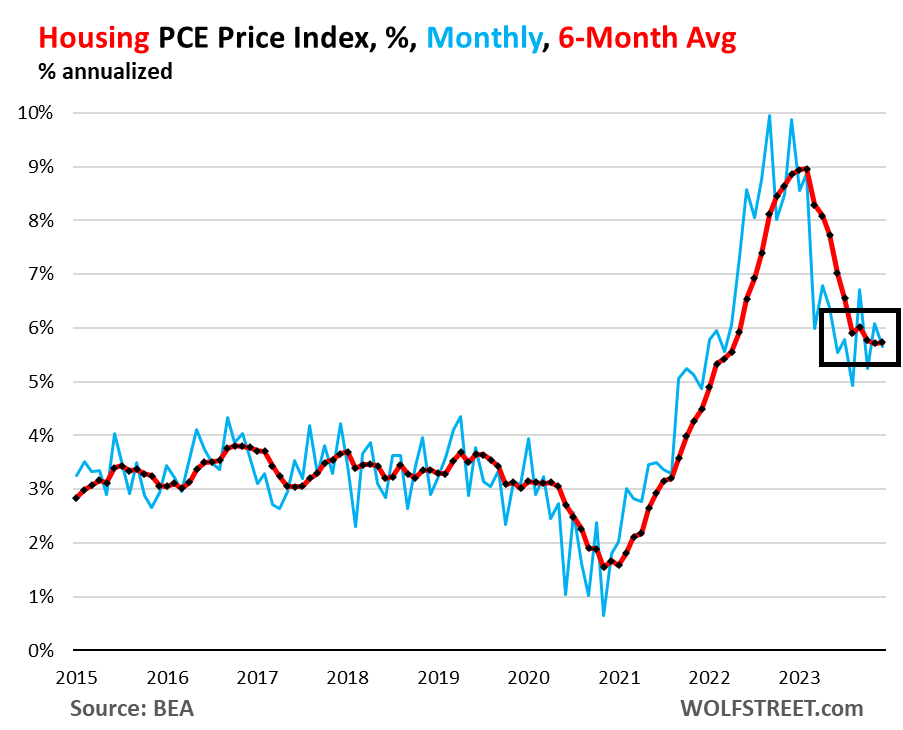
Housing inflation, still red hot and not cooling anymore. The PCE price index for housing rose by 0.46% in December from November and has been in this range since March, after the sharp slowdown early in 2023. This amounts to 5.7% annualized (blue in the chart below).
The housing index is broad-based and includes factors for rent in tenant-occupied dwellings; imputed rent for owner-occupied housing, group housing, and rental value of farm dwellings. It’s the largest component of core services.
The six-month moving average annualized, which shows the more recent trends, also rose by 5.7% in December, and has been in the same range since August (red).
So it looks like the PCE price index for housing has gotten stuck at 5.7%. This stubborn inflation in housing is a blow to theories trotted out for 18 months that housing was lagging, and that we know it will go away as an issue, etc., etc. The increases are less hot than they had been, but remain hot and have become persistent.
The major categories of core services in the PCE price index, as a six-month average of month-to-month changes, annualized:
Core services, major categories, 6-month average, annualized
Housing
5.7%
Description and chart above
Non-energy utilities
2.5%
Water, sewer, trash
Health care
2.5%
Physicians, outpatient, hospital, nursing care, dental, etc.
Transportation services
6.1%
Auto repair & maintenance, auto leasing & rentals, public transportation, airfares, etc.
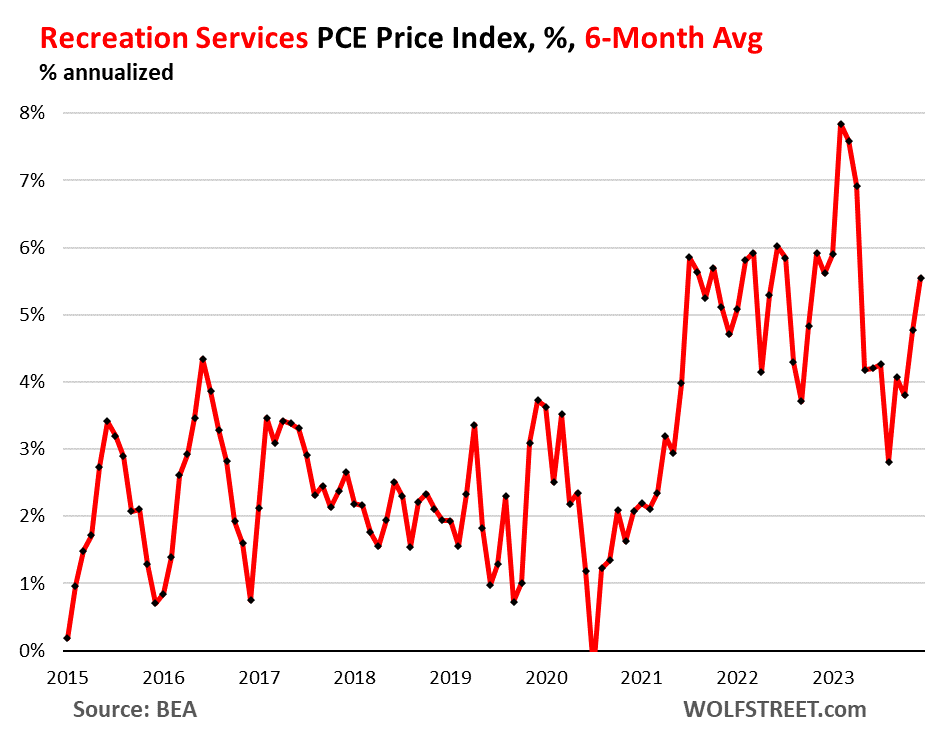
Recreation services
5.6%
Concerts, sports, movies, gambling, streaming, vet services, package tours, etc.
Food services, accommodation
2.8%
Meals & drinks at restaurants, bars, schools, cafeterias, etc.; accommodation at hotels, motels, schools, etc.
Financial services
3.5%
Fees & commissions at banks, brokers, funds, portfolio management, etc.
Insurance
2.8%
Insurance of all kinds, including health insurance
Other services
0.1%
Collection of other services
Inflation in Transportation services and Recreation services is accelerating on the basis of the 6-month moving average, with the PCE price index for Transportation services rising by 6.1%, and the index for Recreation services rising by 5.6%:
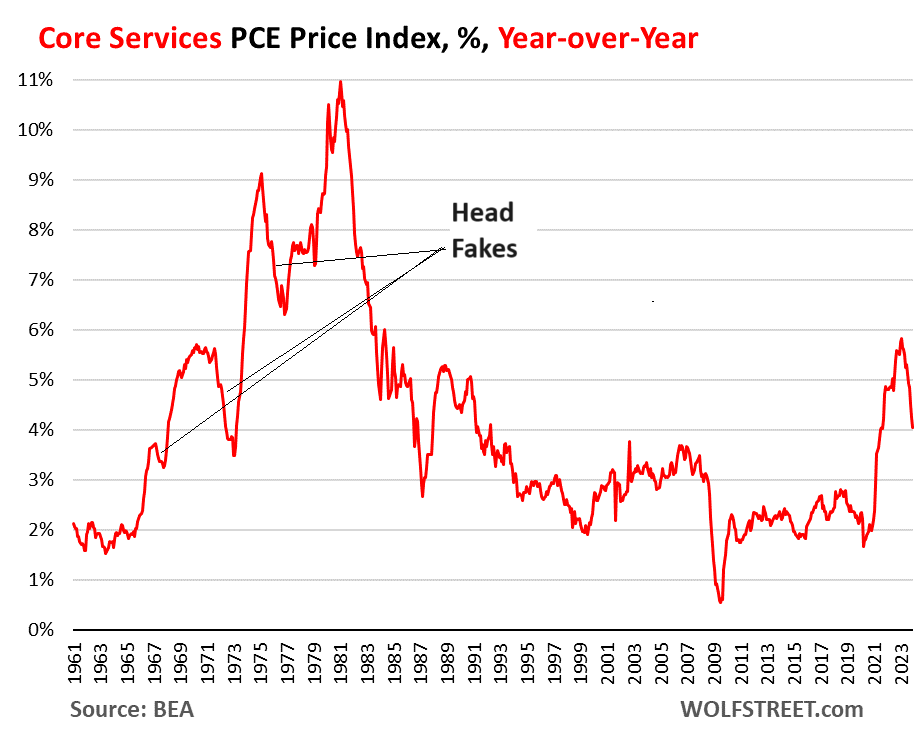
The head-fakes last time.
Inflation in services turns out to be tough to beat, and it can dish up big head-fakes. Last time we had this type of surge of inflation, so that was in the 1970s and 1980s, we thought repeatedly that we had inflation licked, only to find out that we’d fallen for an inflation head-fake. There were three head-fakes in core services on the way to the peak of 11% in 1981:
But Democrats are desperate to stay in power and rake in billons of dollars. Their strategy? Nobody But Joe. Well, except maybe Mike Obama.


You must be logged in to post a comment.