Pension Fund Inferno? Calstrs Seeks $30 Billion In Leverage Amid CRE Turmoil (RE Makes Up 17% Of Calstrs Portfolio)

California is experiencing a pension inferno!

One of the biggest public pension plans in the US plans to borrow tens of billions of dollars to maintain liquidity instead of triggering a fire-sale of its assets. 

Bloomberg reports the roughly $318 billion California State Teachers’ Retirement System (CalSTRS) plans to borrow $30 billion, or about 10% of its portfolio, instead of raising funds through an asset sale that might trigger fire sales

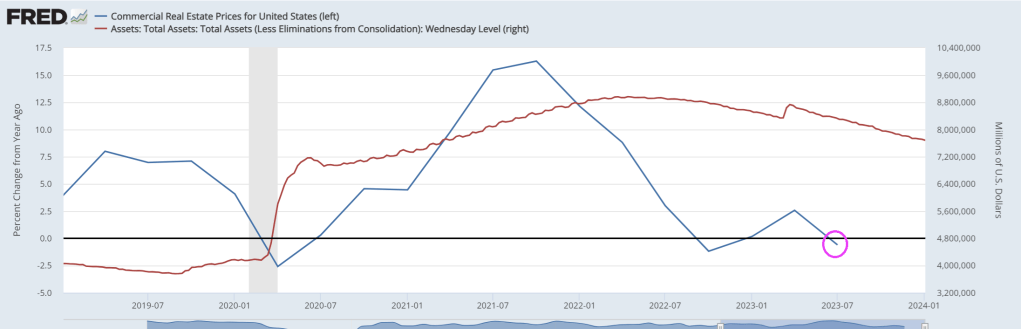
Borrowing to lever up its real estate-laden portfolio when CRE returns are negative??

Calstrs board members will review the first draft of the policy next Thursday. If approved, the leverage would be used “on a temporary basis to fulfill cash flow needs in circumstances when it is disadvantageous to sell assets,” a CalSTRS policy document stated. 

According to Calstrs consultant Meketa Investment Group, the public pension fund already deploys leverage upwards of 4% of its portfolio, adding the proposed increased leverage won’t be used for a new asset allocation policy but rather used to smooth cash flow and as an “intermittent tool” to manage the portfolio. 

The need to increase leverage comes after a report from the Financial Times last April explained that CalSTRS was planning to write down the value of its $52 billion commercial real estate portfolio after high interest rates crushed the values of office towers. 

At the time of the FT report, CalSTRS Chief Investment Officer Christopher Ailman told the media outlet that:

“Office real estate is probably down about 20 percent in value, just based on the rise of interest rates,” adding, “Our real estate consultants spoke to the board last month and said that they felt that real estate was going to have a negative year or two.”

For Calstrs, CRE was one of the best-performing asset classes until Covid and the Fed embarked on the most aggressive interest rate hiking cycle in a generation. Real estate had delivered double-digit returns over a 10-year period for its million-member plan, according to an update last March.

FT noted real estate makes up about 17% of Calstrs’ overall assets. 

We’re sure Calstrs is one of many pension plans under pressure from the CRE downturn. Also, regional banks have high exposure to CRE and are still not out of the woods.

Remember these “best minds in real estate.”

The Incredible Shrinking Econony! Initial US Employment Overstated By 439,000 Jobs In 2023, Civilian Labor Force Shrinks By 636,000 In December (Most Jobs Created In Government)

The closer we look at the December jobs report, the worse it gets. Its like the lights are on, but nobody is home.

A closer look at the numbers from the Bureau of Labor Statistics shows that the government quietly erased 439,000 jobs through November 2023.

That means its initial jobs results were inflated by 439,000 positions, and the job market is not as healthy as the government suggests. 

Since the government wiped out 439,000 jobs after the fact, the total percentage of jobs created by the government last year is even higher. 

But just in December, the civilian labor force shrunk by 636,000 jobs.

Increased government hiring has been driving the jobs numbers higher. This is NOT good since government doesn’t produce anything other than regulations and red tape.

Again, the government sector in December ranked high in job creation.

The health care and social assistance sector, which relies heavily on money from government spending, created about 59,000 jobs.

The economy lost 1.5 million full-time workers since June of last year, while adding 796,000 part-time workers.

That means more workers are holding down multiple jobs to pay for a higher cost of living due to a cumulative 17.4% inflation rate under this White House.

That’s not a good sign.

The Thrill Is Gone? Large Bank Loan Volumes Continue To Shrink Despite Deposit Growth (M2 Money Growth NEGATIVE For All Last Year!)

Yes, BB King was right … about banking. “The Thrill Is Gone” from bank lending,

I observed yesterday that bank credit growth has been negative for the past year. The entire year!

On the bank deposit front, after losing more than a trillion dollars in deposits in 2023 – and seeing usage of The Fed’s emergency funding facility soar to a record high yesterday – total bank deposits rose by $24.2BN in the week-ending 12/27/23 (on a seasonally-adjusted basis) – that is the 4th straight week of deposit inflows…

Source: Bloomberg

On a non-seasonally-adjusted basis, deposits rose almost in line, up $20.3BN (the fifth week of inflows in a row)…

Source: Bloomberg

Interestingly the sizable deposit inflows are occurring alongside sizable money-market fund inflows…

Source: Bloomberg

…now we know where all that reverse repo liquidation cash is going…

Source: Bloomberg

Excluding foreign bank flows, the picture is even rosier with domestic bank deposit inflows of $33.8BN (SA) and $38.7BN (NSA) – the 5th week in a row of NSA inflows…

Source: Bloomberg

While it may surprise some, on an NSA basis, domestic bank deposits are now back above pre-SVB levels…

Source: Bloomberg

Large banks saw $24BN inflows last week and Small Banks $9.4BN (on an SA basis) and for the 5th week in a row both large and small banks saw NSA inflows (+$30BN and +$8.7BN respectively)…

Source: Bloomberg

On the other side of the ledger, loan volumes continued to shrink (despite the deposit growth). Large bank loan volumes fell $8.2BN (the 4th week of falling loan volumes in a row)…

Source: Bloomberg

Which leave us continuing to highlight the fact that there is potential trouble brewing still as the key warning sign continues to flash red (Small Banks’ reserve constraint – blue line), supported above the critical level by The Fed’s emergency funds (for now)…

Source: Bloomberg

As the red line shows, without The Fed’s help, the crisis is back (and large bank cash needs a home – green line – like picking up a small bank from the FDIC).

All of which keep us wondering, are we setting up for another banking crisis in March as:

1) BTFP runs out…

It was only a 12 month temporary program, and it is going to be hard for The Fed to keep it alive.
The BTFP-Fed Arb continues to offer ‘free-money’ 
(and usage of the BTFP has risen by $32BN since the arb existed), but the spread has narrowed a smidge from a peak near 60bps to 50bps today…

Source: Bloomberg

Which will make it hard for The Fed to defend leaving the facility open after March when its “temporary” nature is supposed to expire.

“In justifying the generous terms of the original program, the Fed cited the ‘unusual and exigent’ market conditions facing the banking industry following last spring’s deposit runs,” Wrightson ICAP economist Lou Crandall wrote in a note to clients.

“It would be difficult to defend a renewal in today’s more normal environment.”

2) RRP drains to zero…

…at which point reserves get yanked which means huge deposits flight.

Source: Bloomberg

Is this the real reason why The Fed ‘pivoted’? It knows what’s coming??

Perhaps we should look at The Fed’s little beige book.

The problem is that The Fed doesn’t know what 7 plus 7 equals. Other than asset bubbles.

Running On Empty? The Free Money Has Run Out (M2 Money Growth Has Been Negative For The Past Year!)

Jackson Browne said it best. The US economy is “running on empty.”

M2 Money growth is negative. And M2 Money growth has been negative for the last year.

The third and largest round of fiscal stimulus was in March of 2021. That’s when Biden’s popularity peaked at 55.1 percent.

Base image from 588 Biden Approval Ratings.

Why Biden’s Approval Rating Is Miserable

Income is rising and so are wages. Even real income is up. But real wages are another matter.

Personal income data from the BEA, hourly wages from the BLS, real hourly earnings and chart by Mish.

Personal Income vs Hourly Wages Notes

  • DPI means Disposable Personal Income. Disposable means after taxes.
  • Real DPI means inflation adjusted using the Personal Consumption Expenditures (PCE) deflator. Real DPI is a BEA calculation.
  • Average hourly earning are for production and nonsupervisory workers.
  • Real wages are deflated by the Consumer Price Index (CPI) not the PCE.
  • The BLS does not report a real hourly wage. I used the CPI-W index for production and nonsupervisory workers, produced by the BLS, as the deflator.

Personal Income Definition

The BEA defines personal income as “Income that people get from wages and salaries, Social Security and other government benefits, dividends and interest, business ownership, and other sources.” 

Rental income is a part of other sources.

Three Rounds of Fiscal Stimulus

  • Round 1, March 2020: $1,200 per income tax filer, $500 per child(CARES Act) – Trump
  • Round 2, December 2020: $600 per income tax filer, $600 per child (Consolidated Appropriations Act, 2021) – Trump
  • Round 3, March 2021: $1,400 per income tax filer, $1,400 per child (American Rescue Plan Act) – Biden

The three rounds of free money fiscal stimulus (literally a helicopter drop), plus eviction moratoriums put an unprecedented amount of money in people’s hands. In addition, unemployment insurance paid people more to not work than they received working.

The third round of stimulus under Biden was totally unwarranted. However, it is also worth noting that Trump wanted a much bigger second stimulus package than the Republican Congress gave him. Trump is no fiscal hero.

For more discussion, please see Why Biden’s Approval Rating Is Miserable in One Economic Chart

The three stimulus packages, on top of supply chain disruptions, energy disruptions due to the war in Ukraine, and Bidenomics in general, set in motion the biggest wave of inflation in over 30 years.

Biden went from an approval rating of 17.2 percent to a disapproval rating of 17.2 percent.

Peak Free Money

In addition to declining real wages, perhaps Biden’s big problem is the free money has run out.

Biden’s popularity peaked in March of 2021 along with stimulus. Was that a honeymoon impact or peak free money?

[ZH: While not a perfect indicator, the lagged US credit impulse perhaps provides a proxy for US fiscal excess and when overlaid with Biden’s approval rating, it is clear that 2022’s re-acceleration did nothing for people’s faith in him… and it’s only got worse…]

I suspect a bit of each coupled with hope of more free money, especially student loan forgiveness.

Sending free money to Israel and Ukraine does not help perceptions of how Biden is doing. And neither does the border or ridiculous energy regulations that cost people money.

Biden keeps telling people what a great job he has done.

I don’t believe it and most don’t either. And that shows up in the polls no matter what reason you assign.

Can Biden scrounge up some more stimulus? Because the private sector is not doing well under “Open Borders Biden.”

Bidenomics Housing Market: Average US Household Can Afford Only Cheapest 16% Of Listed Homes (WORST Housing Affordability In History!)

Some content on this page was disabled on May 23, 2024 as a result of a DMCA takedown notice from Adtech lt, UAB. You can learn more about the DMCA here:

https://wordpress.com/support/copyright-and-the-dmca/

Alarm! US Debt Breaks $34 Trillion As Bitcoin Hiccups

Alarm!

In another episode of “Government Gone Wild” we see that total Federal debt just broke through the $34 trillion mark.

Some context: US debt increased by…

  • $1 trillion in the past 3 months
  • $2 trillion in the past 6 months
  • $4 trillion in the past 2 years
  • $11 trillion in the past 4 years

The Congressional Budget Office (CBO) is flashing the alarm.

Reckless spending in Washington DC by the administration and Congress is projected to drive US Debt to GDP to rise like the nuclear reactor in the film K-19: The Widowmaker.

Today the crypto market flash-crashed this morning with Bitcoin instantaneously puking from $45,500 to $41,000…

And Ethereum followed suite…

Over $550 million in crypto long positions were liquidated in the past 24 hours, per data from CoinGlass, including $104 million in Bitcoin longs in the past hour alone.

The extremely volatile cryptos are rallying. But still down on the day.

How Do You Spell Contraction? M-O-N-E-Y (Velocity Of Bank Credit Crashes As Manufacturing PMI Sinks To Contraction)

How do you spell contraction? M-O-N-E-Y!

Take a look at this chart of real GDP YoY / Bank Credit YoY on the left axis and M2 Money growth on the right axis. I call this the velocity of bank credit. And it is sucking wind! Crashing to -13 in Q3.

Then we have US manufacturing PMI saw only two months in 2023 that were not in contraction and ended on a decidedly poor note with the final December print dropping to 47.9 (from 48.2 flash and 49.4 prior).

Source: Bloomberg

Across the board it was ugly with:

  • Renewed contraction in output as orders fall at sharper pace
  • Rates of inflation pick up
  • Joint-fastest drop in employment since June 2020

How bad is Biden’s fiscal policy? US interest payments on our bloated Federal debt is now higher than defense spending. Biden isn’t tuff enough to moderate spending or the border invasion.

US Fiscal Inferno! US Government Debt Now Bigger Than US Economy, But Unfunded Liabilities (Promises) Are $632k Per Citizen (As California’s Governor Newsom Gives Away Free Healthcare To Illegal Immigrants)

Yes, the US is engulfed in a fiscal inferno!

US government debt is now bigger than the US economy. This was unseen until 2012 when debt surpassed GDP for the first time.

In addition to almost $34 trillion in debt from our crazy spending, out-of-control government, we are on the hook for almost $213 TRILLION in unfunded liabilites (promises made to Americans that will likely not be honored).

The sad thing about the US Debt Clock summary is the $632,195 share per citizen of unfunded liabilties. That raises two questions. First, how can California’s Ken doll Governor Gavin “Greasy” Newsom give away free healthcare to ALL illegal immigrants? Second, since the invasion of illegal immigrants began under Biden/Mayorkas, will they be on the hook for the unfunded liabilities which they disordinately consume? Not likely. Maybe we should charge each illegal immigrant $632k admission fee.

California’s Ken doll Governor and fiscal imbecile Gavin Newsom.

Bidenomics In One Chart! Top 1% (Donor Class) Have More Wealth Than Middle Class

Bidenomics is the pride of the donor class.

After all, much of the Federal spending splurge in green energy has gone to big donors, including the Chinese.

The top 1% of US earners now have more wealth than the middle class.

Biden’s song. All he wanted to do was destroy the US middle class. And The Fed’s snakejuice flows to the 1%.

Hey Joe! SOFR Suddenly Soars To Record High As Key Funding Spread Hints At Imminent Liquidity Crunch

Hey Joe (BIDEN)! Please stop destroying the economy!! (Here is my favorite version by Jim Pons and The Leaves!). The most lame version? The Byrds and David Crosby.

Over a month ago (and well before the Fed’s “shocking” dovish pivot) as the Fed’s Overnight Reverse Repo tumbled below $900 billion for the first time since June 2021 amid a growing debate of where and when the Fed’s reserve scarcity constraint will be hit, we warned that liquidity is rapidly approaching the reverse repo constraint level which could emerge as soon as the RRP facility dropped to $700 billion, at which point the market’s all-important credit plumbing will start to crack.

We didn’t have long to wait because just a few days later, on December 1 (just after the customary month-end window dressing period) when reverse repo tumbled to a fresh multi-year low of $765 billion…

… things indeed broke as we explained in “Sudden Spike In SOFR Hints At Mounting Reserve Shortage, Early Restart Of QE” (in which we correctly previewed the coming Fed pivot at a time when most were still dead certain that Powell would only care about inflation for months to come): that’s when the the all-important SOFR rate (i.e., the new Libor) unexpectedly jumped 6bps to 5.39%, the highest on record…

… also resulting in the largest SOFR spike vs ON RRP since Jan ’21, which hit 6bps.

The spike caught almost everyone by surprise, even such Fed-watching luminaries as BofA’s Marc Cabana because it was with “no new UST settlements, lower repo volumes, and lower sponsored bi-lateral volumes.”  More ominously, and confirming our take from three weeks ago, Cabana warned at the time (full note here) that “the move is consistent with the slow theme of less cash & more collateral in the system” – i.e., growing reserve scarcity –  and “may have been exacerbated by elevated dealer inventories, bi-lateral borrowing need, and limited excess cash to backstop repo. If funding pressure persists, it risks Fed re-assessment of ample banking system reserves & potential early end to QT.”

Then, the mini liquidity crisis disappeared almost as fast as it emerged, as SOFR rates eased off and the SOFR-Fed Funds spread normalized once GSE cash entered the market as it does every month….

… until today when not only did SOFR hit a new record high, ironically at a time when the market is pricing in more than 6 rate cuts in 2024…

… but the spread between the SOFR and the effective Fed Funds rate just spiked to the highest level since the March 2020 repo crisis…

.. with a similar move also observed in the spread between SOFR rate and the O/N Reverse Repo which similarly blew out to the widest since the start of 2021.

While there was no specific catalyst behind the sudden spike, two factors are the likely culprits: the year-end liquidity crunch, and the recent sharp increase in the Fed’s reverse repo facility, which has increased from a multi-year low of $683 billion on Dec 15 to yesterday’s $830 billion, and which STIR strategists expect will shoot up above $1 trillion in today’s final for 2023 reverse repo operation as a whopping $300+ billion in short-term liquidity in pulled from markets in just days.

That’s the bad news.

The good news is that come 2024 in a few hours, and specifically the first day of trading on Jan 2, we expect the reverse repo facility to plummet back to $700 billion once the year-end window dressing is over (especially with total US debt rising above $34 trillion to start the year), and floods the system with fresh liquidity which will stabilize the monetary plumbing at least until reverse repo dips below that key level of $700 billion at which point we expect the SOFR spikes to become a daily occurrence, and one which the Fed will no longer be able to ignore.

Indeed, one can already see traces of this in the repo market, where the rate on overnight GC repo first surged to 5.625% at the open on the final trading day of December before dropping to 5.45%, according to ICAP. It has since climbed back to 5.50%. But that’s still lower than where repo rates for Dec. 29 were trading during the prior session, as markets now start frontrunning the coming reverse repo liquidity flood.

Of course, once reverse repo eventually tumbles to $0 some time in March, all bets are off and the narrative shift to the next QE will begin.

“Say, can I sniff you if you take Trump off of Maine’s Presidential ballot??”