Biden’s Fiscal Inferno! Biggest Peactime, Non-crisis Budget Deficit In US History! (December Deficit Equals $129.4 Billion, UP 50% From December 2022)

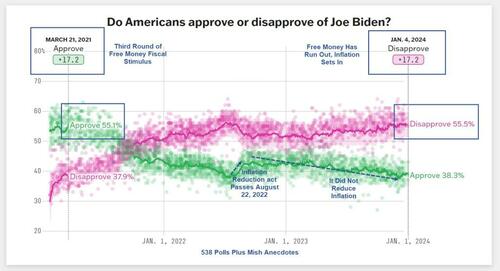
Yes, it’s Biden’s fiscal inferno! And getting worse as the Presidential election approaches!

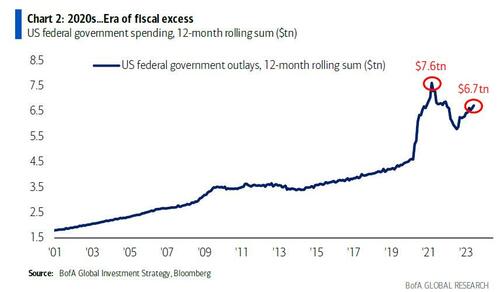
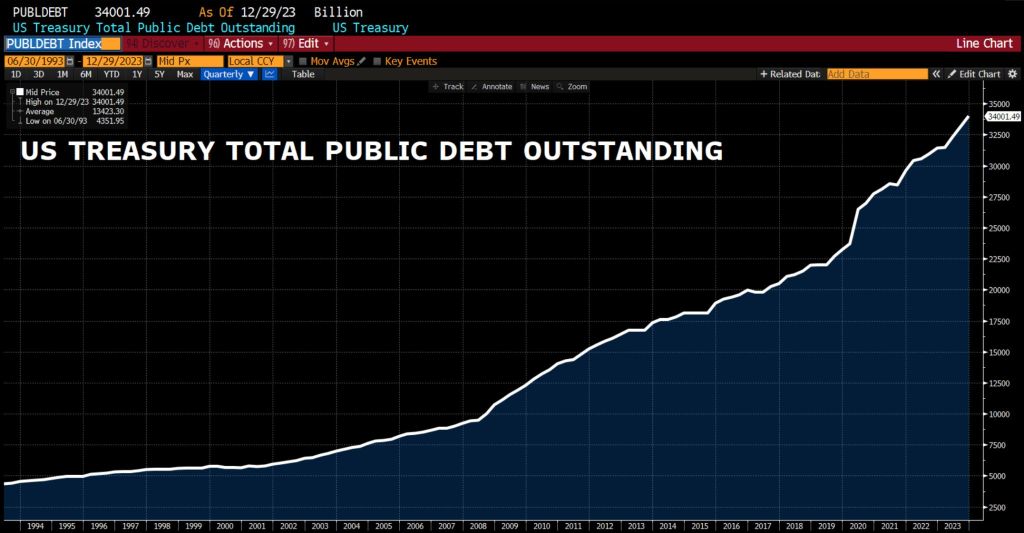
Remember when I showed that the “stealth” secret sauce behind Bidenomics was nothing more than a massive, multi-trillion debt-fueled spending spree, which led to the biggest peactime, non-crisis budget deficit in US historywith the total deficit for fiscal 2023 ending just over $2 trillion, or double the prior year, something which BofA’s Michael Hartnett called the “era of fiscal excess”?

Well, we have news for you: if 2023 was bad, 2024 – an election year of course – is shaping up to be far worse.

Moments ago the US Treasury reported the budget deficit picture for December and it will come as no surprise to anyone that the US has continued to spend like a drunken sailor, or rather, even more. As shown in the chart below, in the month of December, the US collected $429 billion through various taxes, while total outlays hit $559 billion…

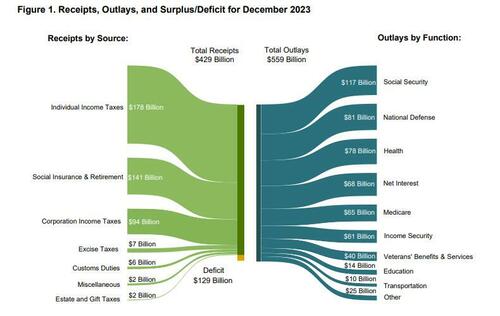
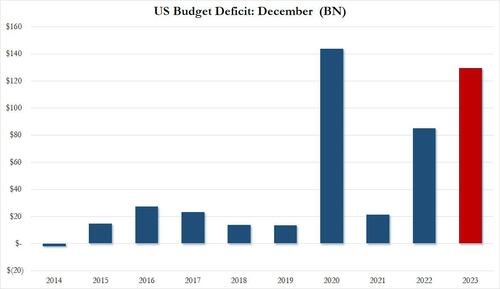
… resulting in a December deficit of $129.4 billion.This may not sound like a lot, but December is actually one of those months when the US deficit is relatively tame, or used to be.

As shown in the next chart, traditionally the December deficit was barely in the $10-20BN range… until 2020 when it exploded to an all time high of $140BN. And while it dropped sharply in 2021, it rebounded dramatically in 2022, and rose to just shy of the December crisis high last month!

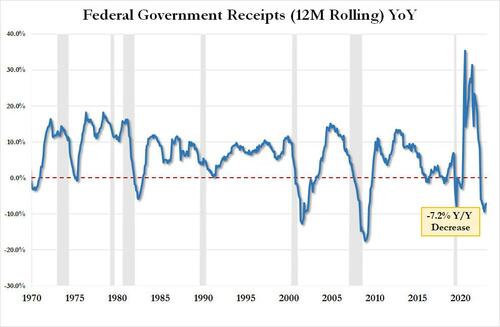
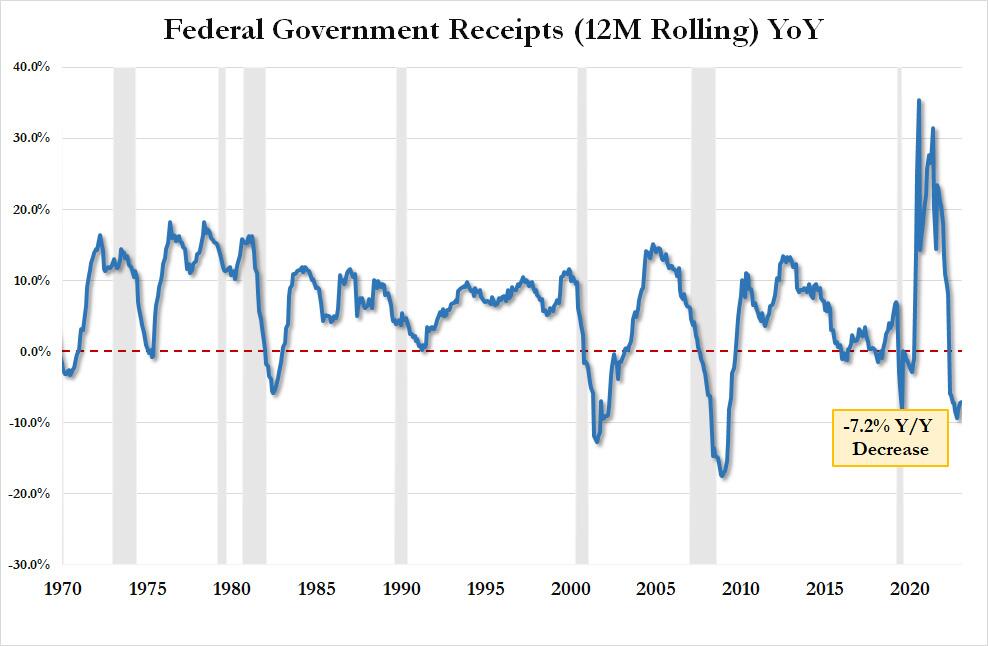
Here is some more context: tax receipts of $429.3BN in December were down 5.6% from the $454.9BN in December 2022 and down a whopping 11.8% from December 2021. On an LTM basis, US total tax receipts were $4.521TN, or down 7.2% YoY. This is now the 9th consecutive YoY decline in LTM tax receipts, something that historically has only taken place when the US was in a recession. As an aside, the “smart economists” were certain that the collapse in tax receipts would reverse after November when the postponed California taxes would be collected. Well, November has come and gone and the big picture is just as ugly.

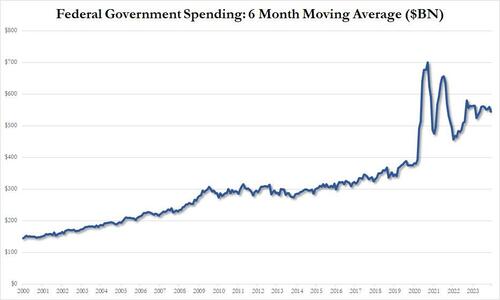
Looking at outlays, unlike tax receipts, there is danger of a decline… ever; and indeed in December the US spent a total of $559 billion, up 3.5% from the $540BN spent a year ago, and up even more from the $508BN in 2021. On a 6 month moving average basis, we are rapidly approaching the exponential phase even when accounting for the spending burst in 2020 and 2021.

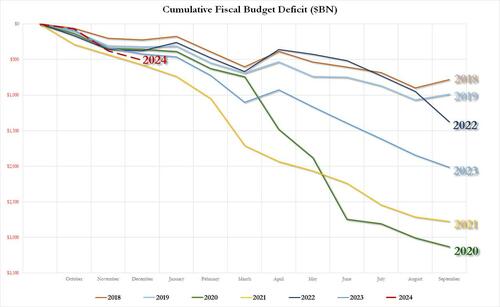
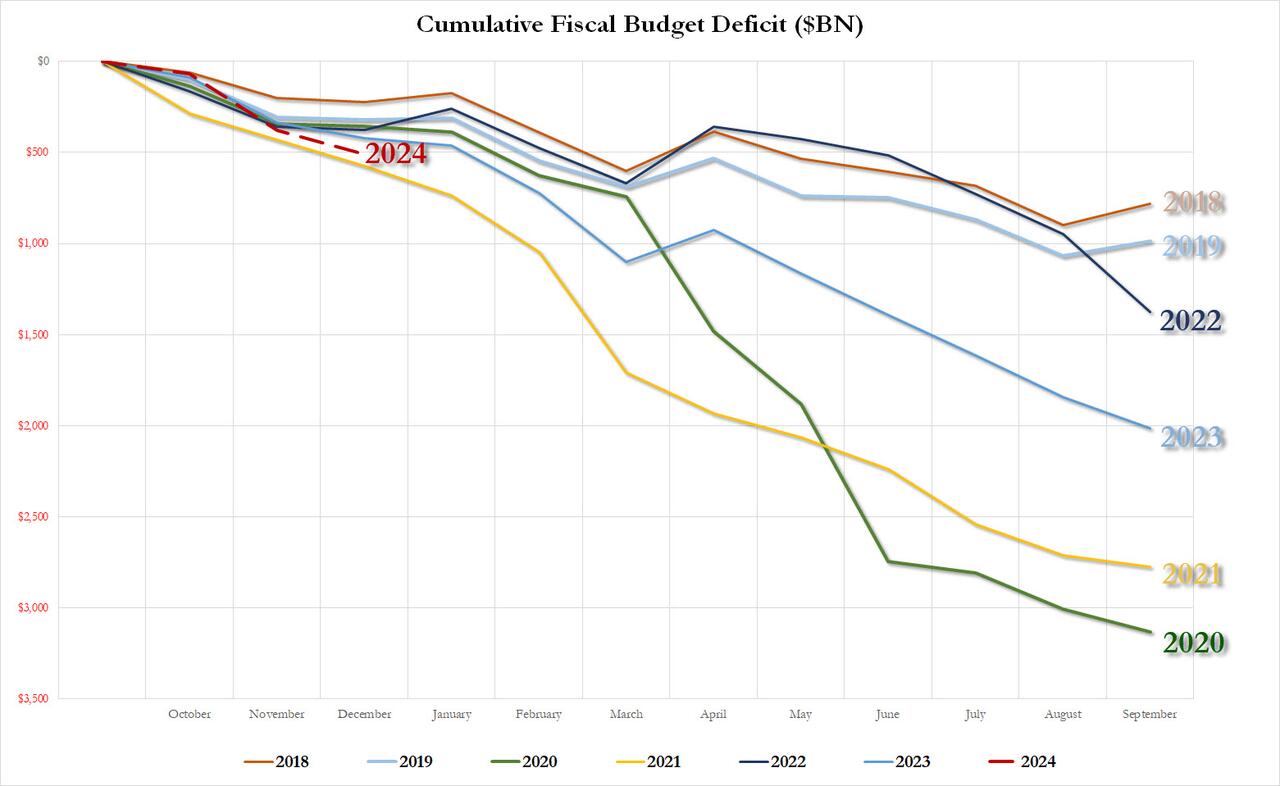
Putting it all together, we get the scariest chart of all: the YTD budget deficit three months into fiscal 2024 is already $509 billion, which would be the biggest deficit in US history after one quarter with the exception of the covid outlier year of 2021 when the US injected multiple trillions in stimmies.

As for the final, and most shocking, data point, the December budget deficit of $129.4 billion was more than $40BN higher than the $87.5BN median estimate, and was more than 50% higher compared to the $85BN December deficit in fiscal 2022.

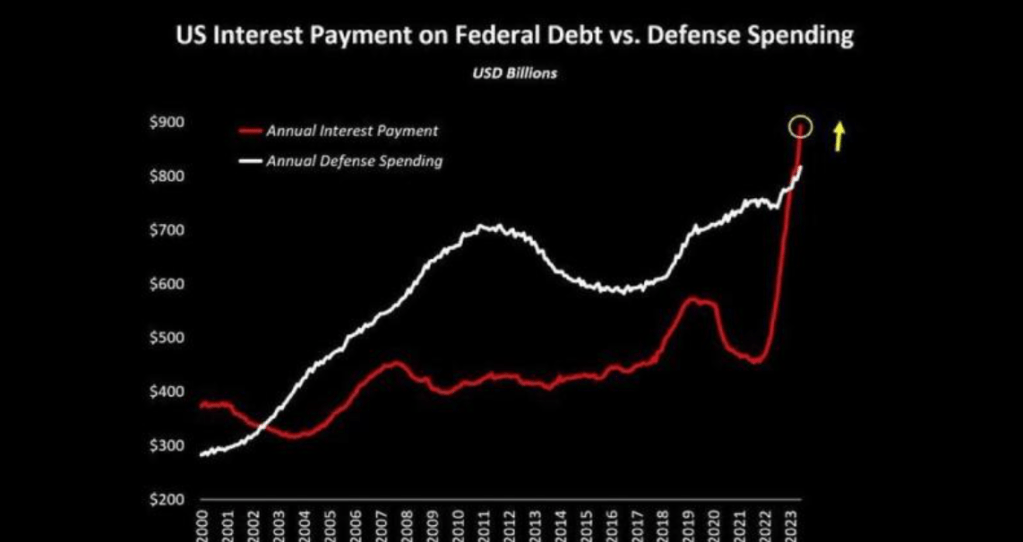
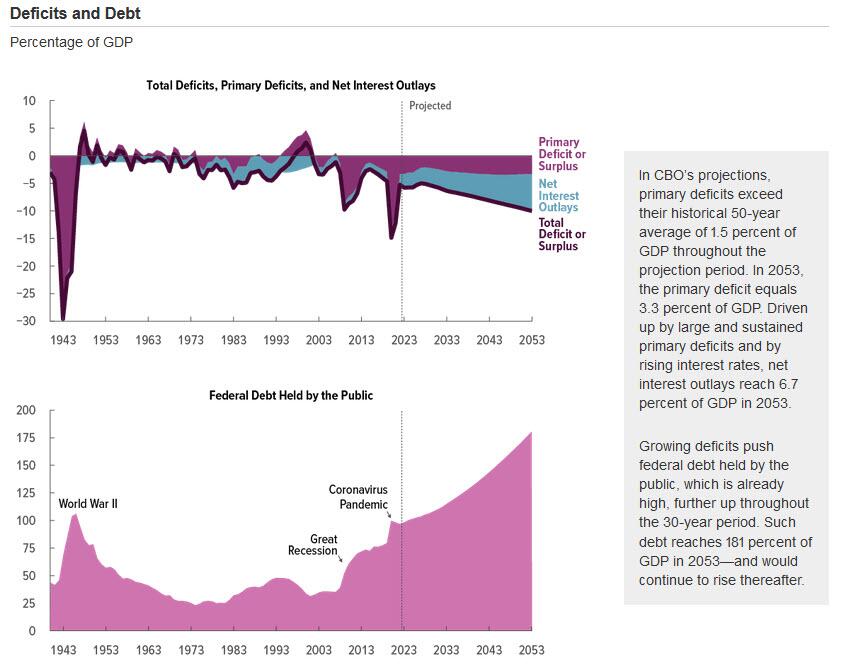
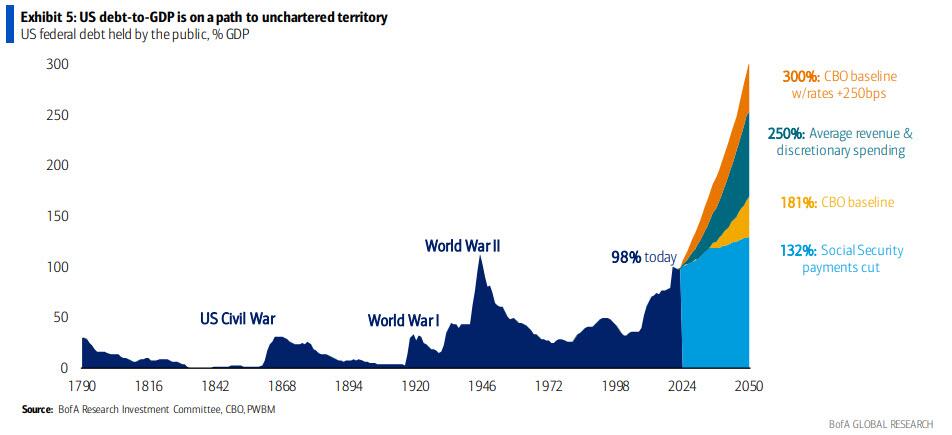
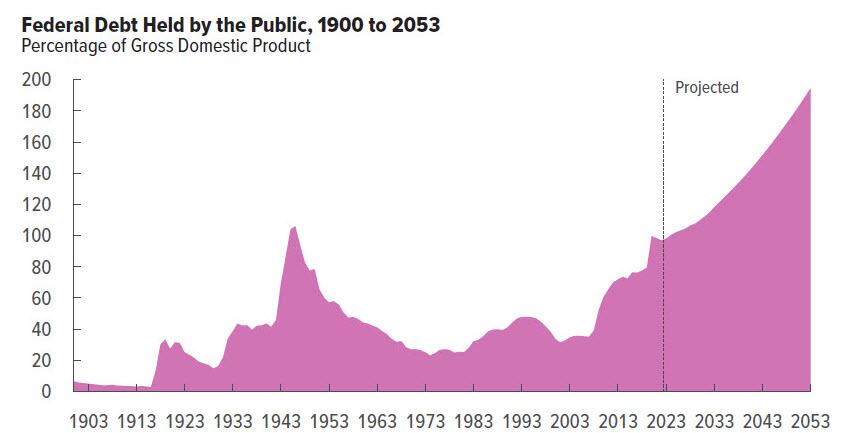
Needless to say, this is completely unsustainable and assures fiscal collapse for the US, not if, but when. Then again, we already knew this thanks to the CBO which was kind enough to chart the endgame:

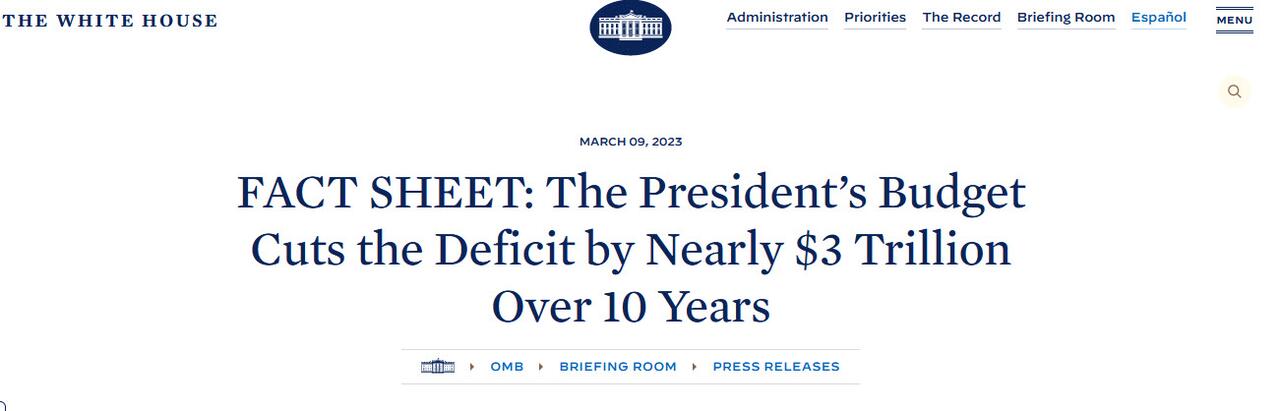
What is funniest about all this is that the US is on an accelerating path to ruin less than one year after the imposter in the White House published this laughable propaganda.

We can’t wait to see what really happens to the budget deficit over the next 10 years. Spoiler alert: there won’t be a happy ending.

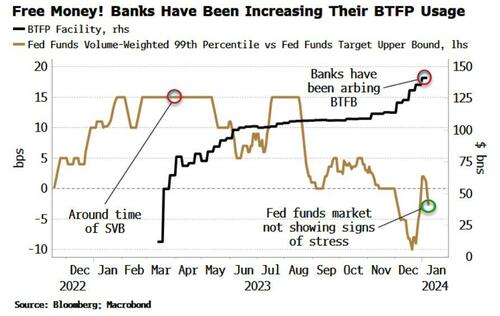
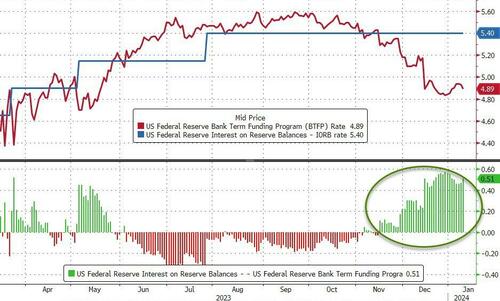
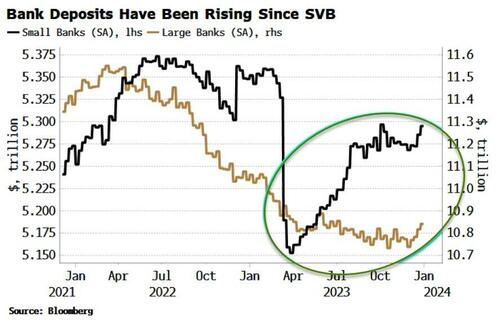
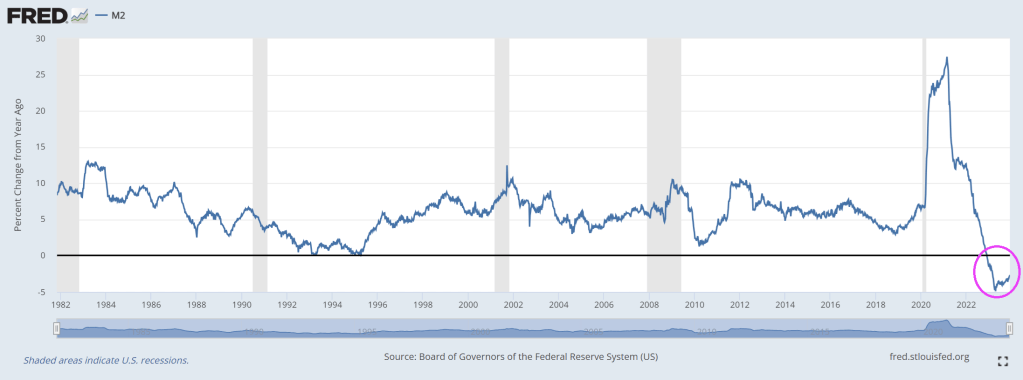
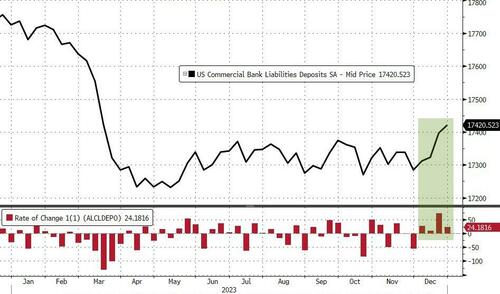
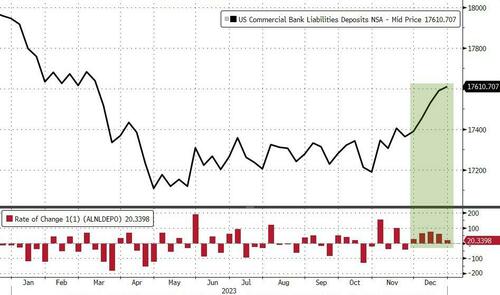
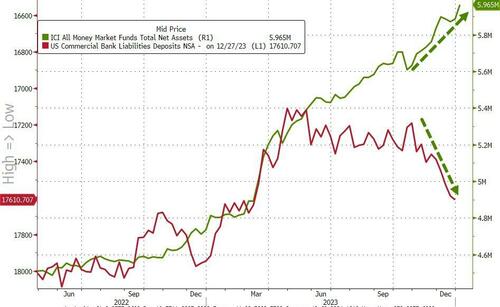
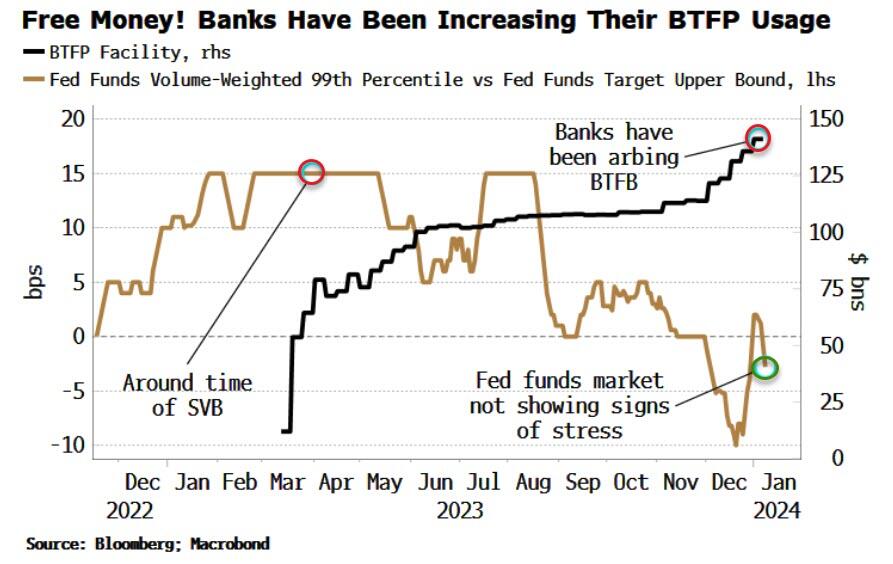
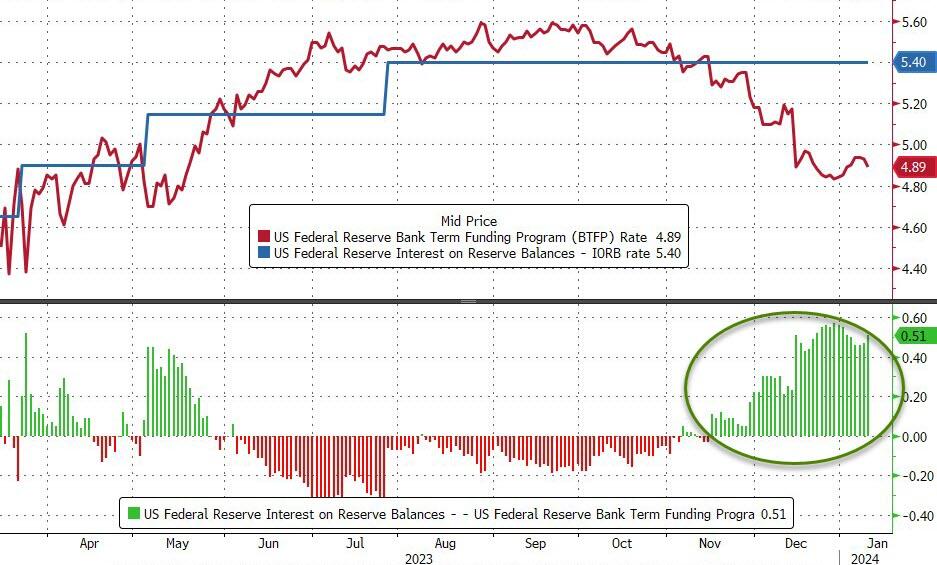
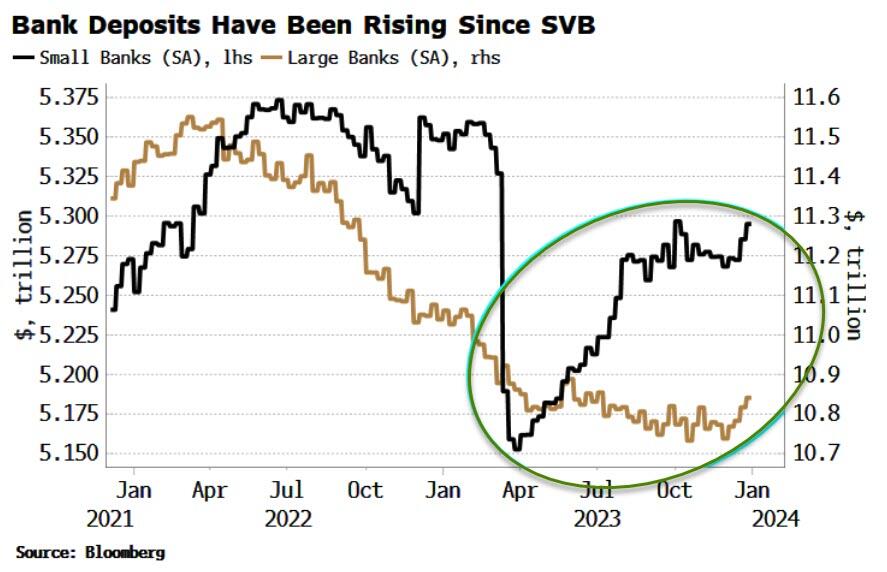
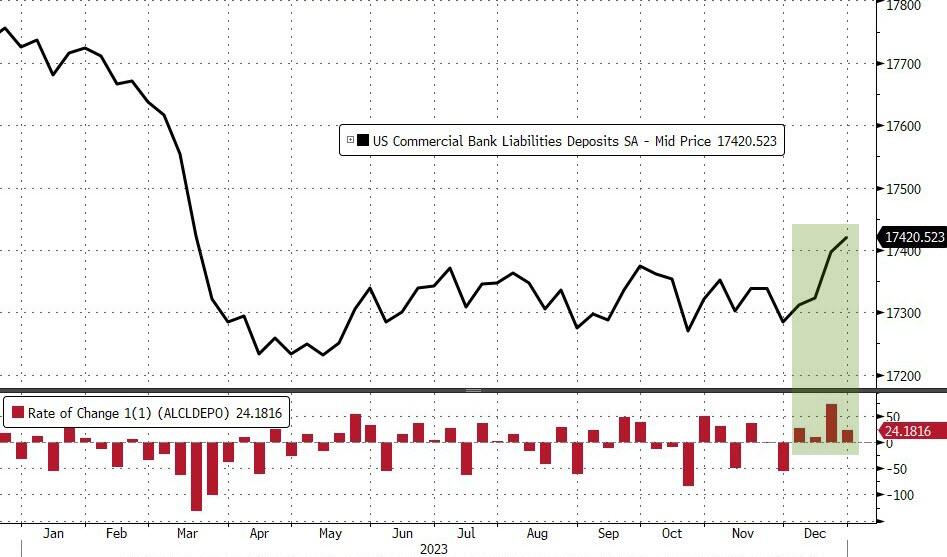
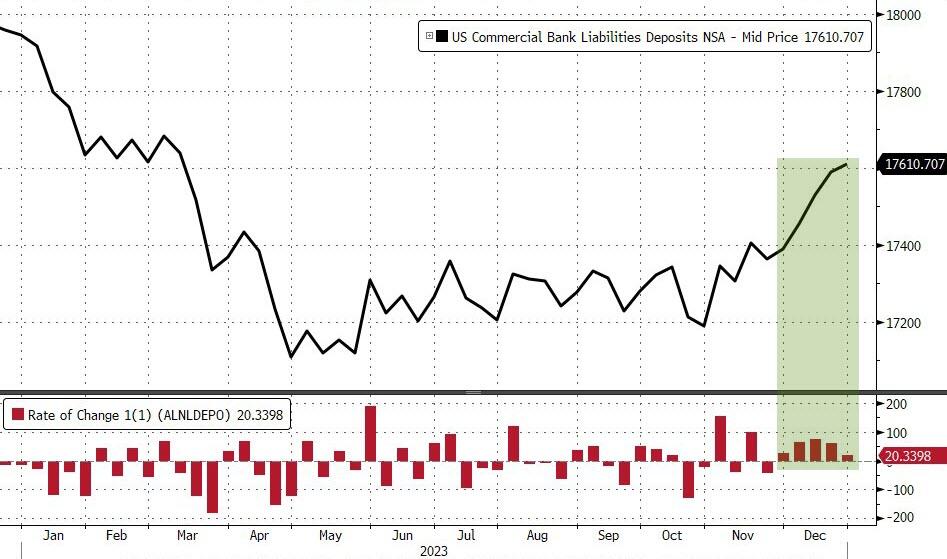
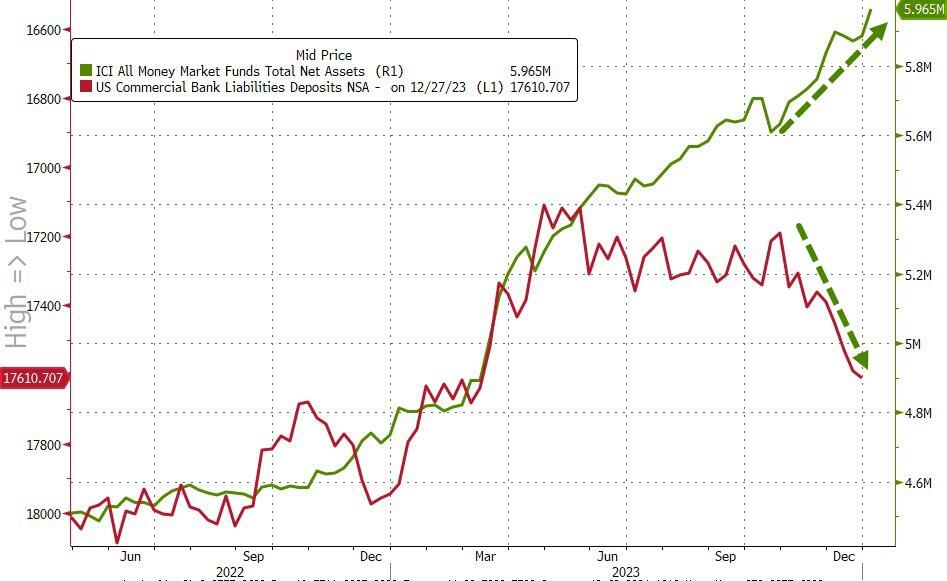
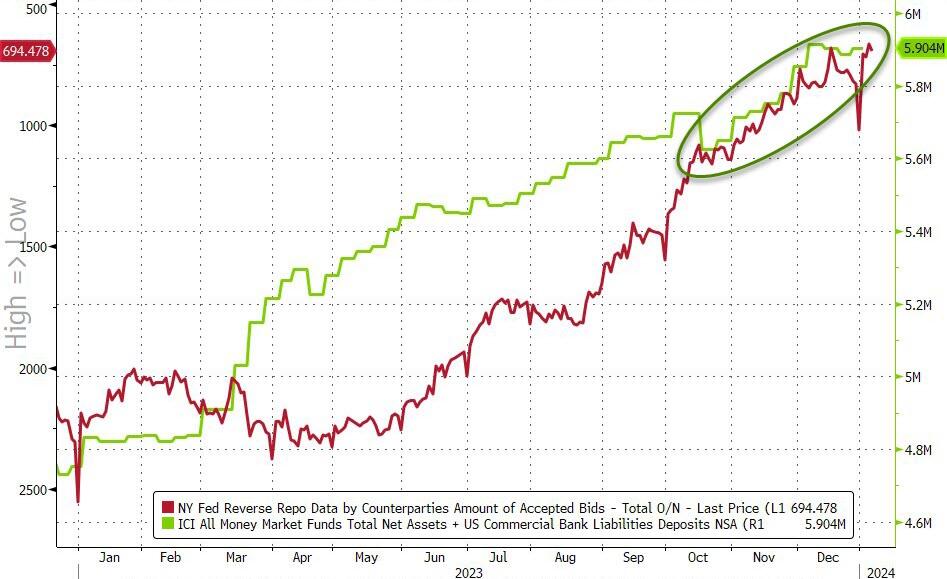
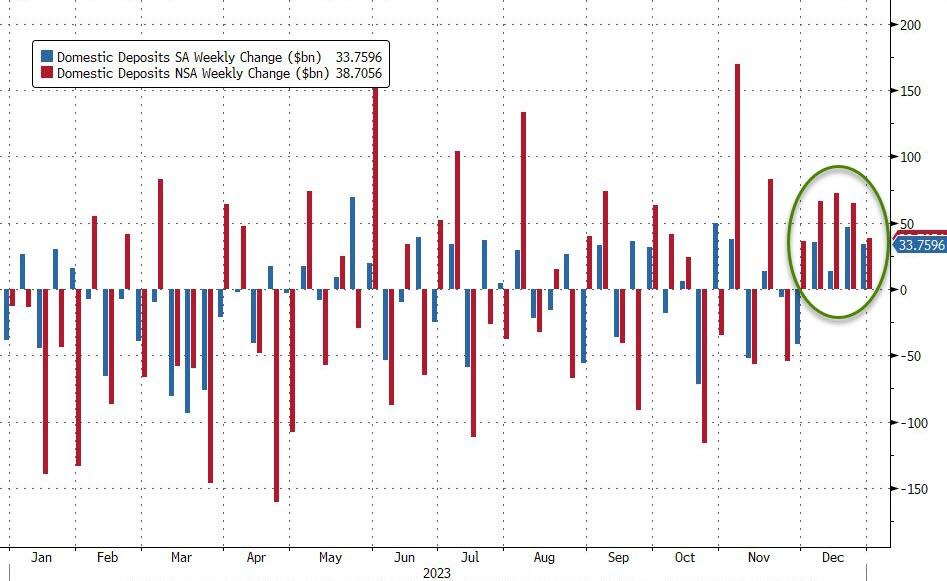
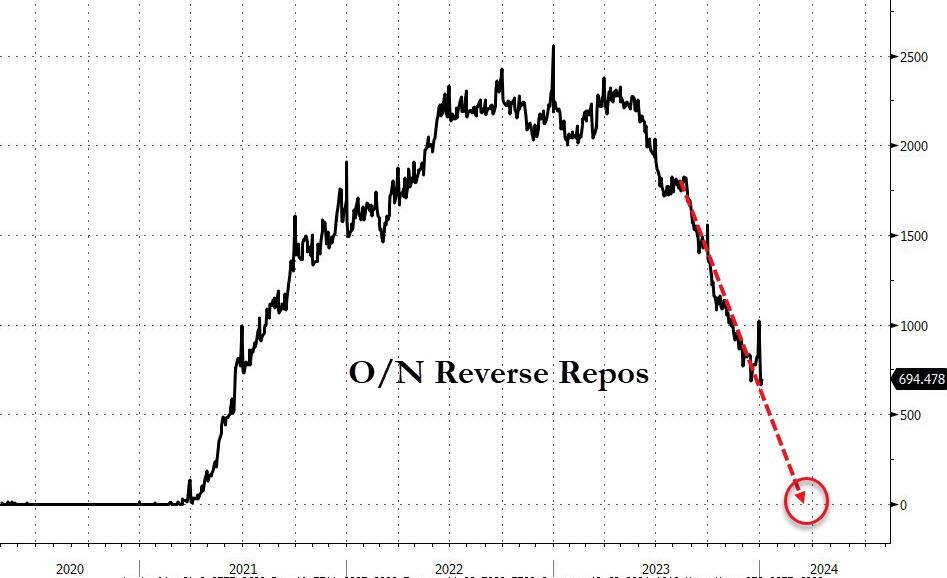
And here is The Federal Reserve Board coming to the rescue of Biden!

Nobody But The Fed! Expiration Of Fed Bank Bailout Facility Strengthens Calls For Earlier Rate-Cut (As Core Inflation Falls Below Fed Funds Target Rate)

Nobody manipulates markets like The Federal Reserve! Nobody but The Fed.

Here we sit with core inflation rate BELOW the current Fed Funds Target Rate (upper bound). So is it time to start withdrawing its more than ample monetary stimulus. Like the Bank Term Funding Program.

The Federal Reserve is likely to retire the Bank Term Funding Program in March. This would entail an additional ongoing headwind for reserves, and thus liquidity, through 2024. At the margin, this adds weight to the case for the Fed cutting interest rates sooner in the year.

The BTFP was created in the wake of the SVB crisis to help struggling banks get access to liquidity when bond prices were dropping. However, its use in recent months has jumped to over $140 billion. That is not, however, a sign of banking stress.

The chart below shows the usage of the BTFP along with the rate paid at the 99th percentile in the fed funds market relative to the upper bound of the range for fed funds.

As can be seen, this is under zero, i.e. banks are not having to pay up to get liquidity.

This is in stark contrast to last March at the time of SVB’s fall when some banks were having to pay 15 bps above the fed funds upper bound for liquidity.

This time the rise in BTFP usage is good old-fashioned arbitrage. After the Fed’s pivot, term rates have come down relative to the policy rate. The cost to use the BTFP is 1y OIS + 10 bps, which is ~4.90%. Banks can post USTs at par as collateral, borrow at this rate, then deposit the funds back at the Fed at the IORB rate (interest on reserve balances), i.e. 5.40%, for a juicy risk-free profit.

This is not good optics, so it is unlikely the program will be renewed when it is due to expire on March 11. Michael Barr, the Fed’s vice chair for supervision, hinted as much on Tuesday when he emphasized the BTFP is an “emergency program.”

And it seems clear the emergency is over. Deposits of small banks (for whom the program was aimed at) have been rising since their drop after SVB’s collapse (both on a seasonally and non-seasonally adjusted basis). That, along with the quiescent fed funds market, suggests banks are not facing stress. Furthermore, the Fed’s pivot has also increased collateral values, making banks’ hold-to-maturity portfolios less underwater.

The BTFP’s expiry would mean another ongoing drain on reserves as the loans expire over the year.

With the Fed now seemingly focused on liquidity in this new paradigm, this adds to reasons why the central bank may cut earlier in the year.

The market is currently pricing 17 bps of cuts for the March 20 meeting, so that’s not an attractive risk-reward, but at under ~7 bps or so that proposition changes – more so if the BTFP is no more.

Meanwhile, the futures market is forecasting rate cuts of over 200 basis points!

The Federal Reserve is a private enterprise that works with The Federal government like in the film “Prometheus” or “Chariots of the Clods.”

Sloppy Joe! Seven Charts Showing The Serious Problems With Bidenomics (Rising Interest Costs, 15% Lower Purchasing Power, Surging Shipping Costs, Etc)

Joe Biden can be called “Sloppy Joe” because of the economic havoc he has sprung on an unsuspecting middle class. The following seven charts are what keeps me up at night (unlike what keeps multimillionaire Michelle Obama up at nights).

First, US interest payment on Federal debt is rising faster than our bloated military budget. Thanks mostly to The Fed raising rates to fight inflation under Biden.

Second, contrainer shipping rates are soaring thanks to Iran’s interference in the Middle East and Biden’s failed diplomacy with Iran.

Third, food prices are over 20% more expensive under Biden while gasoline prices are over 28% more expensive under Biden. Housing is also more expensive under “Sloppy Joe” as in 33.5% more expensive.

Fourth, Bidenomics is about adding more non-productive government jobs.

Fifth, Department of Homeland Insecurity Secretary Alejandro “Cuba Pete” Mayorkas just admitted that 85% of illegal border crossers are released into the general public. I was stunned by this revelation. I just assumed that Mayorkas waived EVERYONE through. Frankly, I think Mayorkas meant he stopped 85 migrants out of the millions who has crossed the border under Sloppy Joe.

Sixth, Grayscale Bitcoin Trust $GBTC traded close to half a billion on Monday. Which shows the lack of confidence in Biden’s handling of the economy.

Seventh, purchasing power of the US Dollar is down 15% under Sloppy Joe.

While some may view Biden’s policies are planned destruction of the US economy, it could simply be that Biden (who is one of the stupidest people in Washington DC) simply is grossly incompetent and … sloppy.

Pension Fund Inferno? Calstrs Seeks $30 Billion In Leverage Amid CRE Turmoil (RE Makes Up 17% Of Calstrs Portfolio)

California is experiencing a pension inferno!

One of the biggest public pension plans in the US plans to borrow tens of billions of dollars to maintain liquidity instead of triggering a fire-sale of its assets. 

Bloomberg reports the roughly $318 billion California State Teachers’ Retirement System (CalSTRS) plans to borrow $30 billion, or about 10% of its portfolio, instead of raising funds through an asset sale that might trigger fire sales

Borrowing to lever up its real estate-laden portfolio when CRE returns are negative??

Calstrs board members will review the first draft of the policy next Thursday. If approved, the leverage would be used “on a temporary basis to fulfill cash flow needs in circumstances when it is disadvantageous to sell assets,” a CalSTRS policy document stated. 

According to Calstrs consultant Meketa Investment Group, the public pension fund already deploys leverage upwards of 4% of its portfolio, adding the proposed increased leverage won’t be used for a new asset allocation policy but rather used to smooth cash flow and as an “intermittent tool” to manage the portfolio. 

The need to increase leverage comes after a report from the Financial Times last April explained that CalSTRS was planning to write down the value of its $52 billion commercial real estate portfolio after high interest rates crushed the values of office towers. 

At the time of the FT report, CalSTRS Chief Investment Officer Christopher Ailman told the media outlet that:

“Office real estate is probably down about 20 percent in value, just based on the rise of interest rates,” adding, “Our real estate consultants spoke to the board last month and said that they felt that real estate was going to have a negative year or two.”

For Calstrs, CRE was one of the best-performing asset classes until Covid and the Fed embarked on the most aggressive interest rate hiking cycle in a generation. Real estate had delivered double-digit returns over a 10-year period for its million-member plan, according to an update last March.

FT noted real estate makes up about 17% of Calstrs’ overall assets. 

We’re sure Calstrs is one of many pension plans under pressure from the CRE downturn. Also, regional banks have high exposure to CRE and are still not out of the woods.

Remember these “best minds in real estate.”

The Incredible Shrinking Econony! Initial US Employment Overstated By 439,000 Jobs In 2023, Civilian Labor Force Shrinks By 636,000 In December (Most Jobs Created In Government)

The closer we look at the December jobs report, the worse it gets. Its like the lights are on, but nobody is home.

A closer look at the numbers from the Bureau of Labor Statistics shows that the government quietly erased 439,000 jobs through November 2023.

That means its initial jobs results were inflated by 439,000 positions, and the job market is not as healthy as the government suggests. 

Since the government wiped out 439,000 jobs after the fact, the total percentage of jobs created by the government last year is even higher. 

But just in December, the civilian labor force shrunk by 636,000 jobs.

Increased government hiring has been driving the jobs numbers higher. This is NOT good since government doesn’t produce anything other than regulations and red tape.

Again, the government sector in December ranked high in job creation.

The health care and social assistance sector, which relies heavily on money from government spending, created about 59,000 jobs.

The economy lost 1.5 million full-time workers since June of last year, while adding 796,000 part-time workers.

That means more workers are holding down multiple jobs to pay for a higher cost of living due to a cumulative 17.4% inflation rate under this White House.

That’s not a good sign.

The Thrill Is Gone? Large Bank Loan Volumes Continue To Shrink Despite Deposit Growth (M2 Money Growth NEGATIVE For All Last Year!)

Yes, BB King was right … about banking. “The Thrill Is Gone” from bank lending,

I observed yesterday that bank credit growth has been negative for the past year. The entire year!

On the bank deposit front, after losing more than a trillion dollars in deposits in 2023 – and seeing usage of The Fed’s emergency funding facility soar to a record high yesterday – total bank deposits rose by $24.2BN in the week-ending 12/27/23 (on a seasonally-adjusted basis) – that is the 4th straight week of deposit inflows…

Source: Bloomberg

On a non-seasonally-adjusted basis, deposits rose almost in line, up $20.3BN (the fifth week of inflows in a row)…

Source: Bloomberg

Interestingly the sizable deposit inflows are occurring alongside sizable money-market fund inflows…

Source: Bloomberg

…now we know where all that reverse repo liquidation cash is going…

Source: Bloomberg

Excluding foreign bank flows, the picture is even rosier with domestic bank deposit inflows of $33.8BN (SA) and $38.7BN (NSA) – the 5th week in a row of NSA inflows…

Source: Bloomberg

While it may surprise some, on an NSA basis, domestic bank deposits are now back above pre-SVB levels…

Source: Bloomberg

Large banks saw $24BN inflows last week and Small Banks $9.4BN (on an SA basis) and for the 5th week in a row both large and small banks saw NSA inflows (+$30BN and +$8.7BN respectively)…

Source: Bloomberg

On the other side of the ledger, loan volumes continued to shrink (despite the deposit growth). Large bank loan volumes fell $8.2BN (the 4th week of falling loan volumes in a row)…

Source: Bloomberg

Which leave us continuing to highlight the fact that there is potential trouble brewing still as the key warning sign continues to flash red (Small Banks’ reserve constraint – blue line), supported above the critical level by The Fed’s emergency funds (for now)…

Source: Bloomberg

As the red line shows, without The Fed’s help, the crisis is back (and large bank cash needs a home – green line – like picking up a small bank from the FDIC).

All of which keep us wondering, are we setting up for another banking crisis in March as:

1) BTFP runs out…

It was only a 12 month temporary program, and it is going to be hard for The Fed to keep it alive.
The BTFP-Fed Arb continues to offer ‘free-money’ 
(and usage of the BTFP has risen by $32BN since the arb existed), but the spread has narrowed a smidge from a peak near 60bps to 50bps today…

Source: Bloomberg

Which will make it hard for The Fed to defend leaving the facility open after March when its “temporary” nature is supposed to expire.

“In justifying the generous terms of the original program, the Fed cited the ‘unusual and exigent’ market conditions facing the banking industry following last spring’s deposit runs,” Wrightson ICAP economist Lou Crandall wrote in a note to clients.

“It would be difficult to defend a renewal in today’s more normal environment.”

2) RRP drains to zero…

…at which point reserves get yanked which means huge deposits flight.

Source: Bloomberg

Is this the real reason why The Fed ‘pivoted’? It knows what’s coming??

Perhaps we should look at The Fed’s little beige book.

The problem is that The Fed doesn’t know what 7 plus 7 equals. Other than asset bubbles.

Running On Empty? The Free Money Has Run Out (M2 Money Growth Has Been Negative For The Past Year!)

Jackson Browne said it best. The US economy is “running on empty.”

M2 Money growth is negative. And M2 Money growth has been negative for the last year.

The third and largest round of fiscal stimulus was in March of 2021. That’s when Biden’s popularity peaked at 55.1 percent.

Base image from 588 Biden Approval Ratings.

Why Biden’s Approval Rating Is Miserable

Income is rising and so are wages. Even real income is up. But real wages are another matter.

Personal income data from the BEA, hourly wages from the BLS, real hourly earnings and chart by Mish.

Personal Income vs Hourly Wages Notes

  • DPI means Disposable Personal Income. Disposable means after taxes.
  • Real DPI means inflation adjusted using the Personal Consumption Expenditures (PCE) deflator. Real DPI is a BEA calculation.
  • Average hourly earning are for production and nonsupervisory workers.
  • Real wages are deflated by the Consumer Price Index (CPI) not the PCE.
  • The BLS does not report a real hourly wage. I used the CPI-W index for production and nonsupervisory workers, produced by the BLS, as the deflator.

Personal Income Definition

The BEA defines personal income as “Income that people get from wages and salaries, Social Security and other government benefits, dividends and interest, business ownership, and other sources.” 

Rental income is a part of other sources.

Three Rounds of Fiscal Stimulus

  • Round 1, March 2020: $1,200 per income tax filer, $500 per child(CARES Act) – Trump
  • Round 2, December 2020: $600 per income tax filer, $600 per child (Consolidated Appropriations Act, 2021) – Trump
  • Round 3, March 2021: $1,400 per income tax filer, $1,400 per child (American Rescue Plan Act) – Biden

The three rounds of free money fiscal stimulus (literally a helicopter drop), plus eviction moratoriums put an unprecedented amount of money in people’s hands. In addition, unemployment insurance paid people more to not work than they received working.

The third round of stimulus under Biden was totally unwarranted. However, it is also worth noting that Trump wanted a much bigger second stimulus package than the Republican Congress gave him. Trump is no fiscal hero.

For more discussion, please see Why Biden’s Approval Rating Is Miserable in One Economic Chart

The three stimulus packages, on top of supply chain disruptions, energy disruptions due to the war in Ukraine, and Bidenomics in general, set in motion the biggest wave of inflation in over 30 years.

Biden went from an approval rating of 17.2 percent to a disapproval rating of 17.2 percent.

Peak Free Money

In addition to declining real wages, perhaps Biden’s big problem is the free money has run out.

Biden’s popularity peaked in March of 2021 along with stimulus. Was that a honeymoon impact or peak free money?

[ZH: While not a perfect indicator, the lagged US credit impulse perhaps provides a proxy for US fiscal excess and when overlaid with Biden’s approval rating, it is clear that 2022’s re-acceleration did nothing for people’s faith in him… and it’s only got worse…]

I suspect a bit of each coupled with hope of more free money, especially student loan forgiveness.

Sending free money to Israel and Ukraine does not help perceptions of how Biden is doing. And neither does the border or ridiculous energy regulations that cost people money.

Biden keeps telling people what a great job he has done.

I don’t believe it and most don’t either. And that shows up in the polls no matter what reason you assign.

Can Biden scrounge up some more stimulus? Because the private sector is not doing well under “Open Borders Biden.”

Bidenomics Housing Market: Average US Household Can Afford Only Cheapest 16% Of Listed Homes (WORST Housing Affordability In History!)

Some content on this page was disabled on May 23, 2024 as a result of a DMCA takedown notice from Adtech lt, UAB. You can learn more about the DMCA here:

https://wordpress.com/support/copyright-and-the-dmca/

Alarm! US Debt Breaks $34 Trillion As Bitcoin Hiccups

Alarm!

In another episode of “Government Gone Wild” we see that total Federal debt just broke through the $34 trillion mark.

Some context: US debt increased by…

  • $1 trillion in the past 3 months
  • $2 trillion in the past 6 months
  • $4 trillion in the past 2 years
  • $11 trillion in the past 4 years

The Congressional Budget Office (CBO) is flashing the alarm.

Reckless spending in Washington DC by the administration and Congress is projected to drive US Debt to GDP to rise like the nuclear reactor in the film K-19: The Widowmaker.

Today the crypto market flash-crashed this morning with Bitcoin instantaneously puking from $45,500 to $41,000…

And Ethereum followed suite…

Over $550 million in crypto long positions were liquidated in the past 24 hours, per data from CoinGlass, including $104 million in Bitcoin longs in the past hour alone.

The extremely volatile cryptos are rallying. But still down on the day.

How Do You Spell Contraction? M-O-N-E-Y (Velocity Of Bank Credit Crashes As Manufacturing PMI Sinks To Contraction)

How do you spell contraction? M-O-N-E-Y!

Take a look at this chart of real GDP YoY / Bank Credit YoY on the left axis and M2 Money growth on the right axis. I call this the velocity of bank credit. And it is sucking wind! Crashing to -13 in Q3.

Then we have US manufacturing PMI saw only two months in 2023 that were not in contraction and ended on a decidedly poor note with the final December print dropping to 47.9 (from 48.2 flash and 49.4 prior).

Source: Bloomberg

Across the board it was ugly with:

  • Renewed contraction in output as orders fall at sharper pace
  • Rates of inflation pick up
  • Joint-fastest drop in employment since June 2020

How bad is Biden’s fiscal policy? US interest payments on our bloated Federal debt is now higher than defense spending. Biden isn’t tuff enough to moderate spending or the border invasion.