Biden loves to blame Republicans for the border crisis. Although he has it in his power to close and secure the border, but won’t. It’s easier to blame the opposition, like “extreme MAGA Republicans.” Huh, I didn’t realize that as a conservative American I am considered extreme by the Biden Administration.
Unfortunately, Biden, Schumer and Johnson only provided financial support for Jordan, Lebanon, Egypt, Tunisia and Oman. In the form of $380 million.
As the US falls to 23rd in World Happiness ranking. Based, in part, on Biden’s idiotic open borders policy.
A new $1.2 trillion government spending package Congress is trying to ram through faces significant headwinds in the House, where members are expected to vote on it later this morning.
The 1,012-page bill was introduced at around 3am Thursday morning – just 48 hours before a midnight Friday funding deadline. It must pass both the House and the Senate, after which President Biden will sign it (with crayons at the ready, we’re sure).
The package accounts for approximately 70% of discretionary government spending – and consists of six out of twelve total bills that Congress must pass each fiscal year to fund the government. The six others, around $460 billion in spending, were passed earlier this month.
According to Fox News, multiple GOP sources, two GOP lawmakers and one senior GOP aide think the package will pass, but by a tight margin.
On Thursday afternoon, however, the bipartisan deal hit turbulence – with one GOP lawmaker citing absurd pork contained within – including funding for LGBTQ centers and facilities that provide late-term abortions.
Pork City
As usual, Democrats slipped in as much pork as possible, including:– $850k for a gay senior home- $15 million to pay for Egyptian’s college tuitions- $400k for a gay activist group to teach elementary kids about being trans- $500k for a DEI zoo- $400k for a group to gives clothes to teens to help them hide their gender
$60,000,000,000 for Ukraine (of course). NOTHING for US border.
$1,140,000,000,0000 for pork barrelling
1.2 trillion in inflation, an increase of the money supply by 2% in a single spending bill.
The US Dollar’s purchasing power is down -16% under Gaslight Joe.
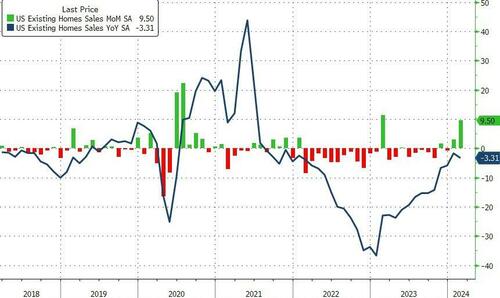
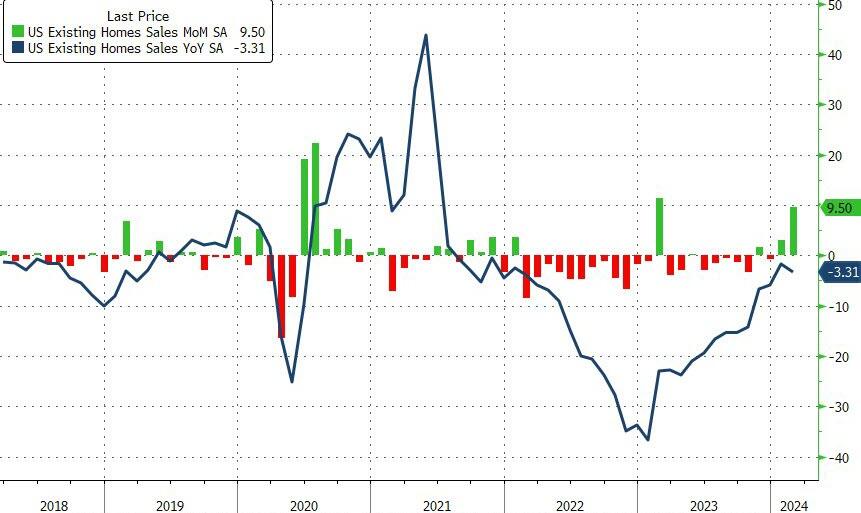
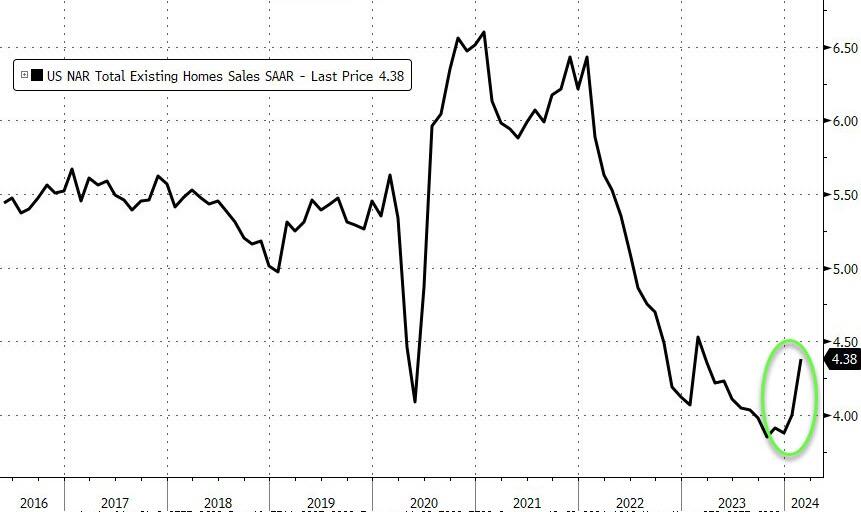
February’s existing home sales are like a scoop of cottage cheese. Seemingly satisfying until you look more closely at the data (or get hungry 30 minutes later).
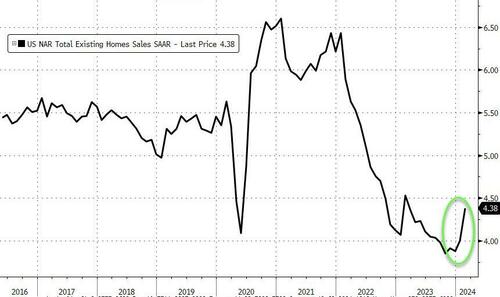
Total existing home sales SAAR surged to 4.38mm – a 12 month high…
Source: Bloomberg
Homeowners may be accepting that mortgage rates are settling into a new normal and can’t delay moving any longer, NAR Chief Economist Lawrence Yun said on a call with reporters.
“Additional housing supply is helping to satisfy market demand,” Yun said in a statement.
“Housing demand has been on a steady rise due to population and job growth, though the actual timing of purchases will be determined by prevailing mortgage rates and wider inventory choices.”
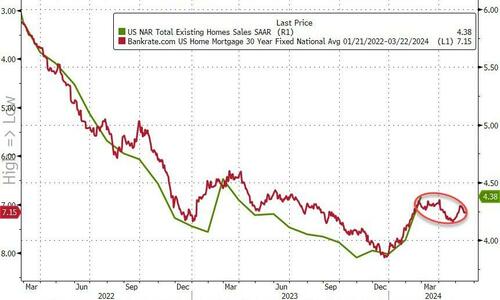
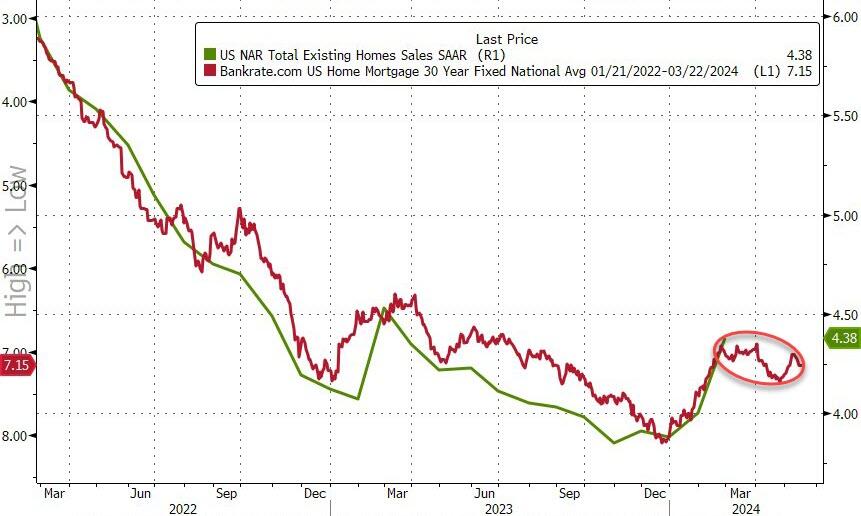
With a 2-month lag, we can see why existing home sales may have risen, but with mortgage rates rising since then, we suspect the fun and games may come to an end again soon (even if the NAR economist thinks otherwise)…
The number of previously owned homes for sale climbed to about 1.07 million last month, and Yun said he expects that will continue to go up. At the current sales pace, selling all the properties on the market would take 2.9 months, the lowest in about a year.
Realtors see anything below five months of supply as indicative of a tight market.
Even with greater inventory, strong demand put upward pressure on prices. The median selling price advanced 5.7% to $384,500 from a year ago, the highest for any February in data back to 1999.
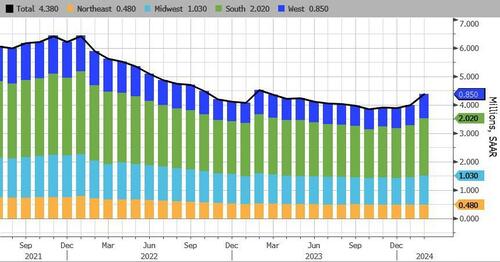
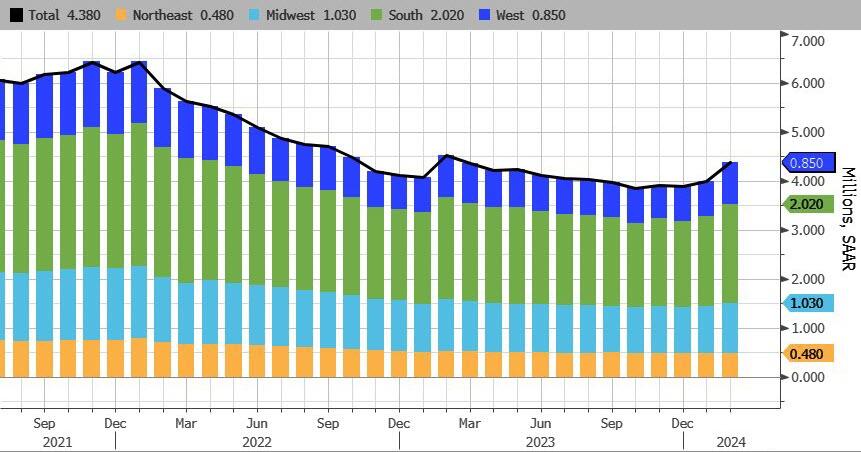
Sales rose in three of four regions, led by a 16.4% surge in the West
First-time buyers made up 26% of purchases in February, matching the lowest on record.
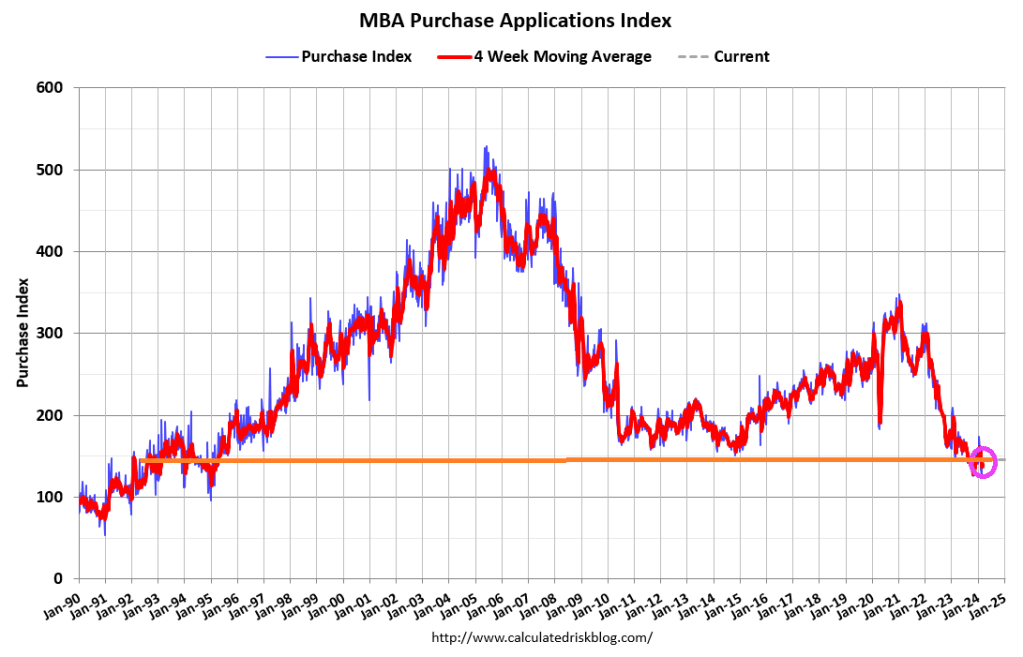
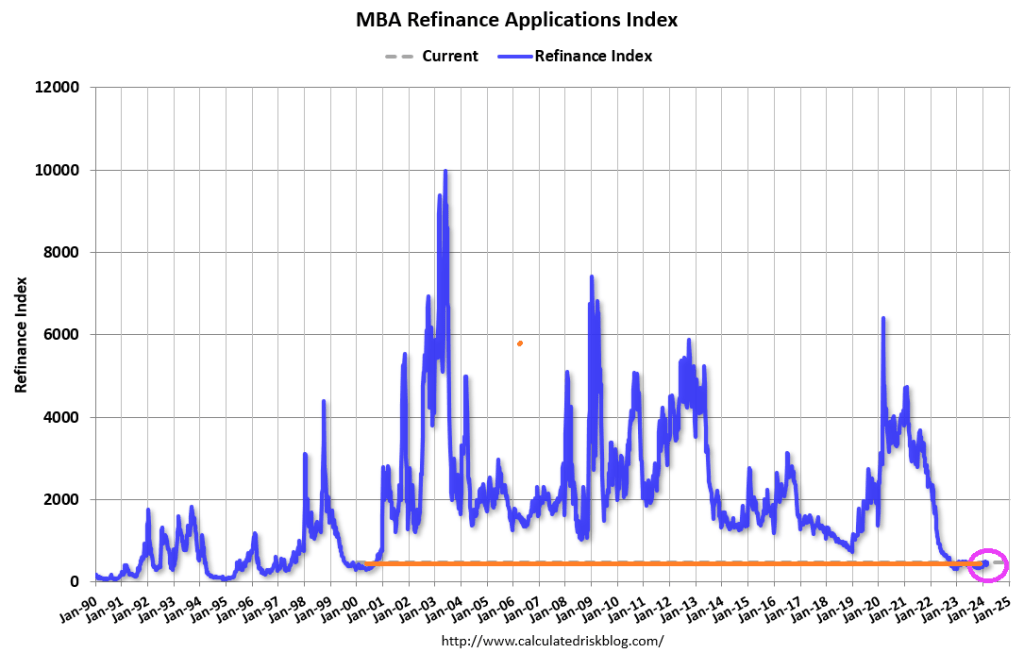
The woes for the mortgage market continue under President Magoo.
Mortgage applications decreased 1.6 percent from one week earlier, according to data from the Mortgage Bankers Association’s (MBA) Weekly Mortgage Applications Survey for the week ending March 15, 2024.
The Market Composite Index, a measure of mortgage loan application volume, decreased 1.6 percent on a seasonally adjusted basis from one week earlier. On an unadjusted basis, the Index decreased 1 percent compared with the previous week. The seasonally adjusted Purchase Index decreased 1 percent from one week earlier. The unadjusted Purchase Index decreased 1 percent compared with the previous week and was 14 percent lower than the same week one year ago.
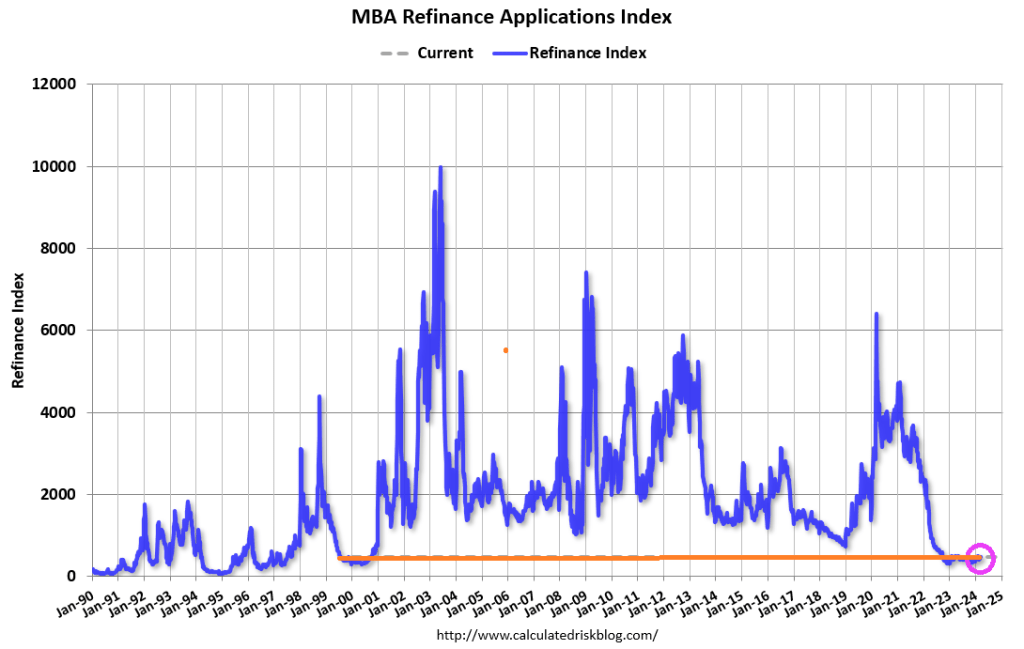
The Refinance Index decreased 3 percent from the previous week and was 3 percent lower than the same week one year ago.
Between The Fed’s announcement of rate changes and The Biden Crime hearings in DC (where Hunter of course failed to appear), there is plenty to keep us occupied.
How bad is Bidenomics for the American middle class? We know that inflation is far higher under China/Ukraine Joe (even with those awful looking Hoka shoes), but the pain that is being felt is attrocious.
Housing costs have soared over the past four years
A monthly mortgage payment on a typical U.S. home has nearly doubled since January 2020, up 96.4% to $2,188 (assuming a 10% down payment).
Home values have risen 42.4% in that time, with the typical U.S. home now worth about $343,000. Mortgage rates ended January 2020 near 3.5%, keeping the cost of a home affordable for most households that could manage the down payment. At the time of this analysis, mortgage rates were about 6.6%.
Wages have not kept up
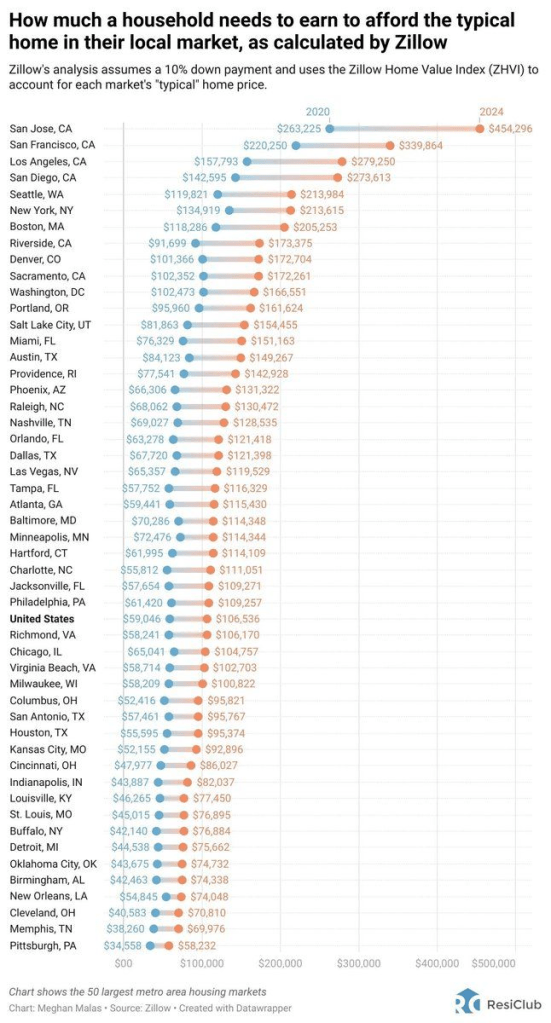
In 2020, a household earning $59,000 annually could comfortably afford the monthly mortgage on a typical U.S. home, spending no more than 30% of its income with a 10% down payment. That was below the U.S. median income of about $66,000, meaning more than half of American households had the financial means to afford homeownership.
Now, the roughly $106,500 needed to comfortably afford the mortgage payment on a typical home is well above what a typical U.S. household earns each year, estimated at about $81,000.
Buyers are teaming up, “house hacking,” and moving to more affordable areas
Metro areas where a buyer could comfortably afford a typical home with the lowest income are Pittsburgh ($58,232 income needed to afford a home), Memphis ($69,976), Cleveland ($70,810), New Orleans ($74,048) and Birmingham ($74,338). The only major metros where a typical home is affordable to a household making the median income are Pittsburgh, St. Louis and Detroit.
There are seven markets among major metros where a household’s income must be $200,000 or more to comfortably afford a typical home. The top four are in California: San Jose ($454,296), San Francisco ($339,864), Los Angeles ($279,250) and San Diego ($273,613). Seattle ($213,984), the New York City metro area ($213,615) and Boston ($205,253) complete the list.
Methodology
Quarterly median household income is taken from the American Community Survey (ACS) and Moody’s Analytics through 2022. Present-day estimates use quarterly changes in the Employment Cost Index provided by the Bureau of Labor Statistics (BLS) to chain ACS income to the current day.
Years to save for a 10% down payment is the number of years it would take the median household to save for a 10% down payment on a typical home in their metro, assuming a 5% annual savings rate.
Income needed to afford a home with 10% down is defined as the income needed to afford the total monthly payment on the typical home. The total monthly payment is based on the monthly mortgage payment, insurance, property taxes, and annual maintenance costs of the home.
Of course, tech town San Jose and San Francisco lead the nation in income needed to afford a typical home in a market. Los Angeles and San Diego are third and fourth, followed by Seattle. Pittsburgh PA has a lowest income to afford a home, probably because they signed Russell Wilson AND Justin Fields at QB.
Nike has made a pair of shoes fitting Biden’s international image.
And much of the debt burden falls on the middle class.
Serious auto delinquencies are on the rise.
And lowest earners saw the biggest increase in credit card delinquenices.
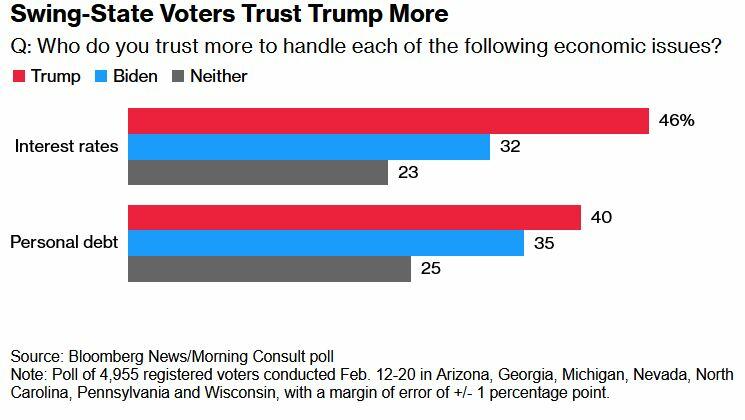
And who voters prefer as of today? Trump on interest rates and personal debt.
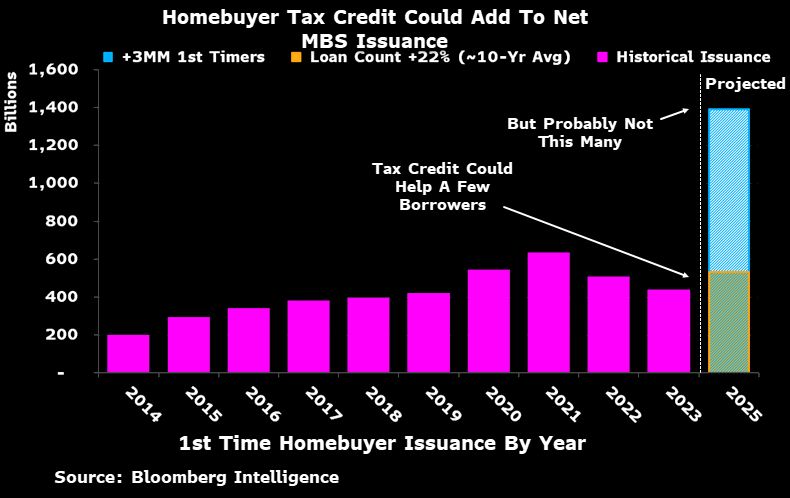
In addition to the absurd idea of removing title searches for government-guaranteed mortgages (now rely on attorney opinions), the Biden Administration is considering a homebuyer tax credit … that likely won’t help much.
And if you want to see which lenders have the largest concentrations of commercial real estate (CRE) loans, BankOZK takes the cake as the most concentrated lender.
The more the Biden Administration tries to “help” make housing more affordable, paradoxically makes housing even MORE unaffordable.
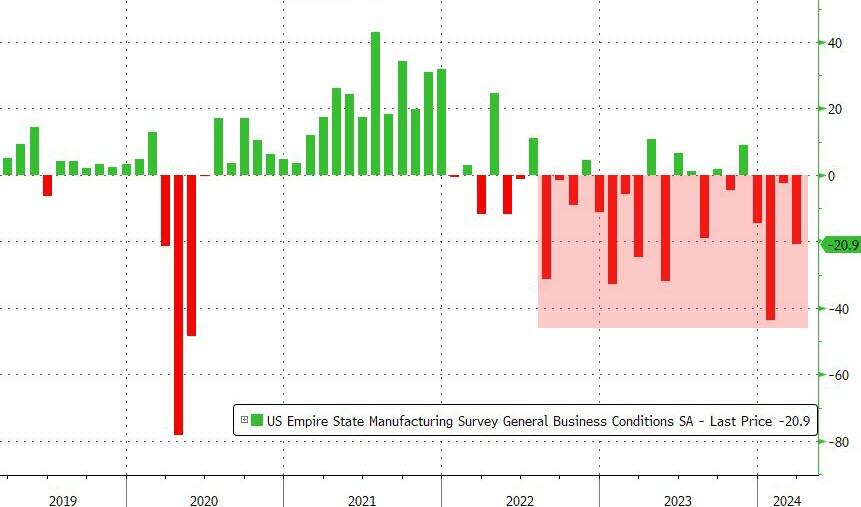
The NY Fed’s Empire State Manufacturing crashed and burned in March. NYFRB’s general business conditions index plunged 18.5pts in March to -20.9. A reading below zero indicates contraction, and the measure was weaker than all estimates in a Bloomberg survey of economists. Hey, I though illegal immigrantion was good for the economy!!!
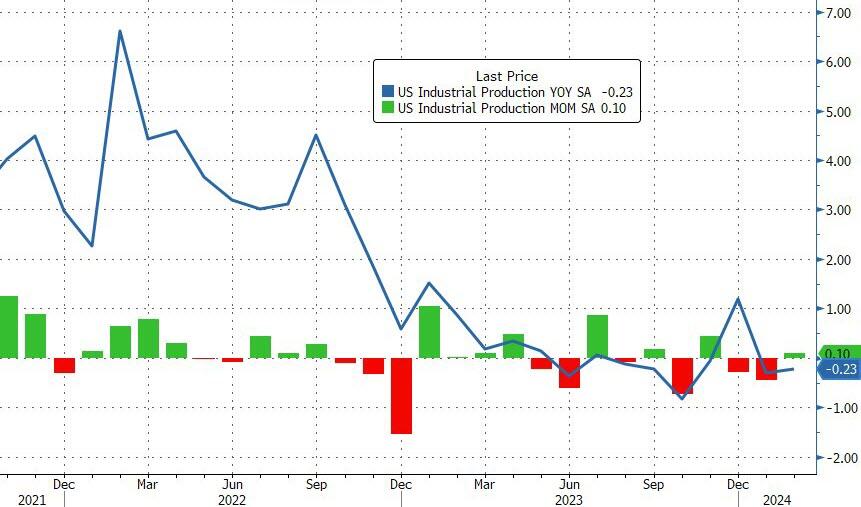
Industrial production fell tp -0.23 YoY in February, not a stellar sign for the economy.
1. Everybuddy: 100% of workforce 2. Wisense: 100% of workforce 3. CodeSee: 100% of workforce 4. Twig: 100% of workforce 5. Twitch: 35% of workforce 6. Roomba: 31% of workforce 7. Bumble: 30% of workforce 8. Farfetch: 25% of workforce 9. Away: 25% of workforce 10. Hasbro: 20% of workforce 11. LA Times: 20% of workforce 12. Wint Wealth: 20% of workforce 13. Finder: 17% of workforce 14. Spotify: 17% of workforce 15. Buzzfeed: 16% of workforce 16. Levi’s: 15% of workforce 17. Xerox: 15% of workforce 18. Qualtrics: 14% of workforce 19. Wayfair: 13% of workforce 20. Duolingo: 10% of workforce 21. Rivian: 10% of workforce 22. Washington Post: 10% of workforce 23. Snap: 10% of workforce 24. eBay: 9% of workforce 25. Sony Interactive: 8% of workforce 26. Expedia: 8% of workforce 27. Business Insider: 8% of workforce 28. Instacart: 7% of workforce 29. Paypal: 7% of workforce 30. Okta: 7% of workforce 31. Charles Schwab: 6% of workforce 32. Docusign: 6% of workforce 33. Riskified: 6% of workforce 34. EA: 5% of workforce 35. Motional: 5% of workforce 36. Mozilla: 5% of workforce 37. Vacasa: 5% of workforce 38. CISCO: 5% of workforce 39. UPS: 2% of workforce 40. Nike: 2% of workforce 41. Blackrock: 3% of workforce 42. Paramount: 3% of workforce 43. Citigroup: 20,000 employees 44. ThyssenKrupp: 5,000 employees 45. Best Buy: 3,500 employees 46. Barry Callebaut: 2,500 employees 47. Outback Steakhouse: 1,000 48. Northrop Grumman: 1,000 employees 49. Pixar: 1,300 employees 50. Perrigo: 500 employees
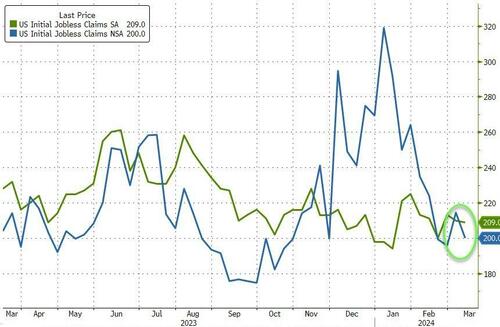
But, according to the government-supplied data…
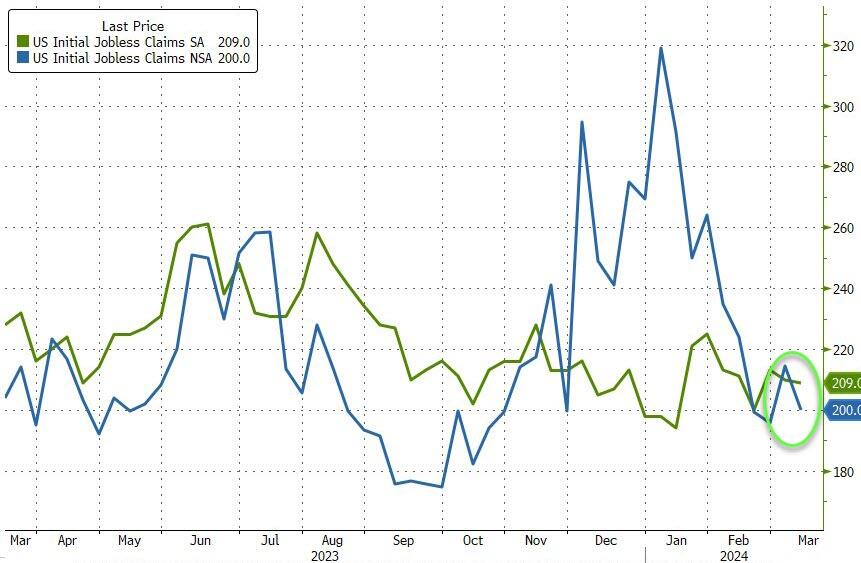
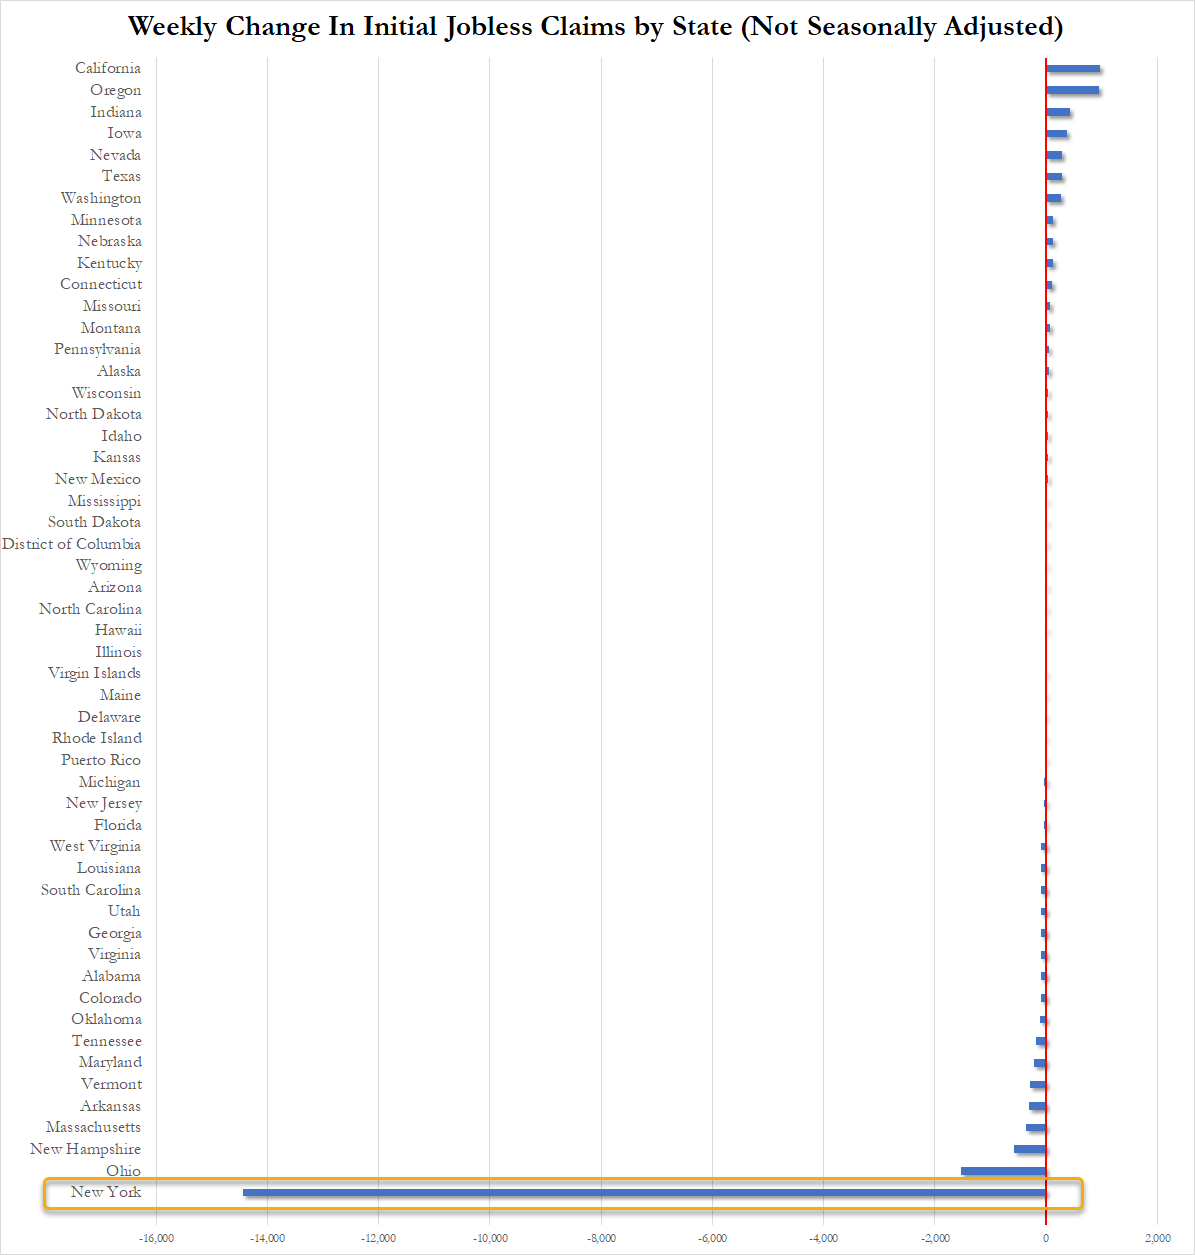
The number of American filing for jobless benefits for the first time last week dropped to 209k (vs 218k exp) with the NSA number tumbling to 200k…
Source: Bloomberg
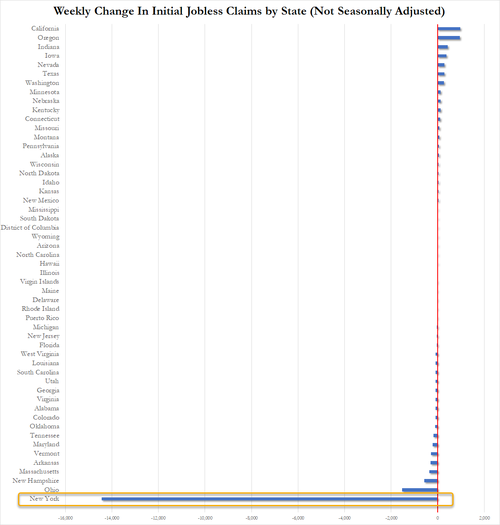
How is this possible, you may ask… well let us show you the ways… New York State claims that its jobless benefits rolls collapsed last week. New York accounted for 99.75% of the weekly change in initial claims across the entire US as shown below…
Source: Bloomberg
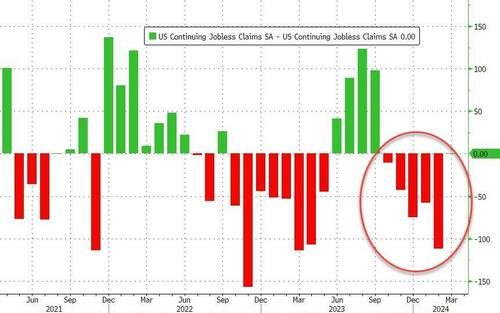
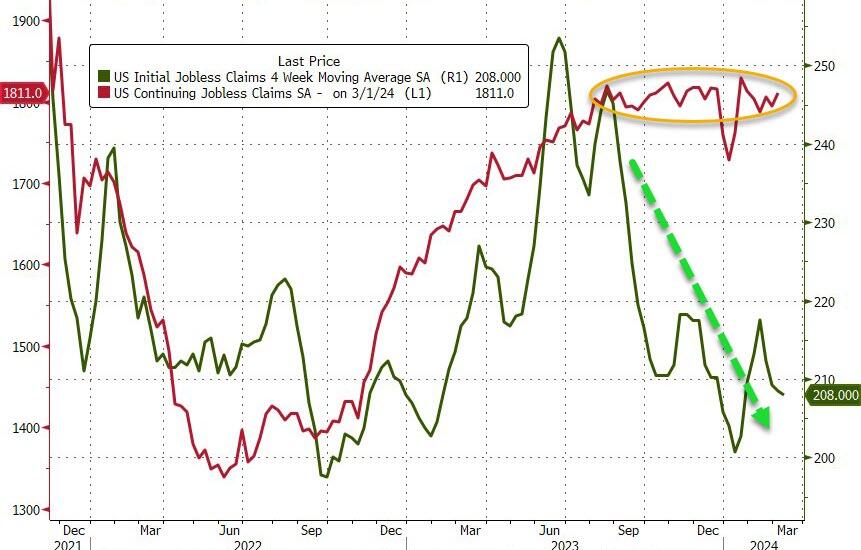
Continuing Claims was a shit show – with a massive 112k person downward revision for last week from 1.906 million to 1.794mm. That is the 5th straight weekly downward revision of continuing claims…
Source: Bloomberg
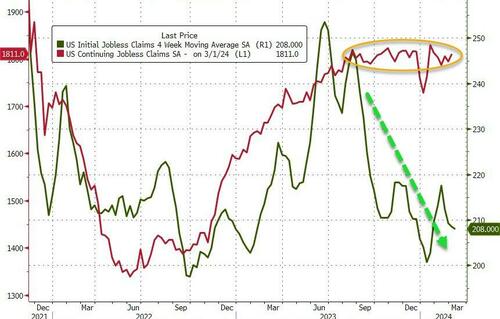
But thanks to the adjustments, it all looks ‘normal’ and ‘stable’ at around 1.8 million Americans…
Source: Bloomberg
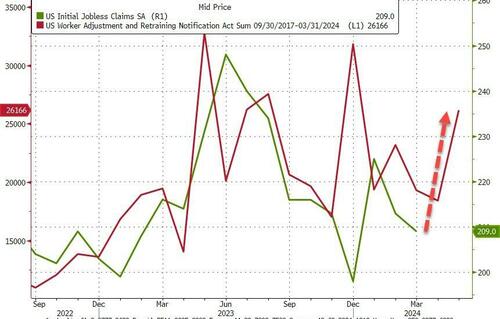
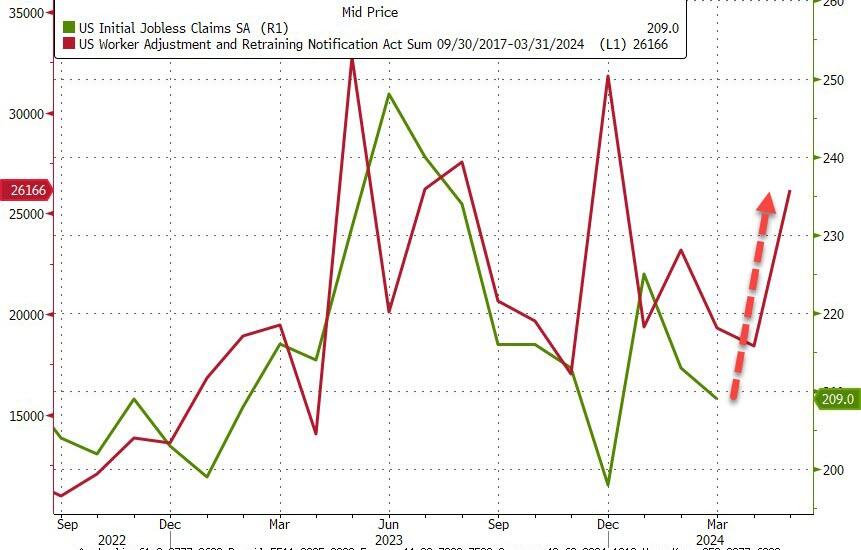
And WARN numbers are rising rapidly…
Source: Bloomberg
As a reminder, if you doubt the accuracy of the Biden admin’s data, here’s what the most recent FOMC Minutes said:
“While the recent trends prior to the meeting had been remarkably positive, Fed officials judged that some of the recent improvement “reflected idiosyncratic movements in a few series.”
Even they aren’t buying it, and neither should you!
We are experiencing a situation known as House Latitudes. Where mortgage rates are so high that the mortgage market is struggling to recover from Bidenomics.
Mortgage applications increased 7.1 percent from one week earlier, according to data from the Mortgage Bankers Association’s (MBA) Weekly Mortgage Applications Survey for the week ending March 8, 2024.
The Market Composite Index, a measure of mortgage loan application volume, increased 7.1 percent on a seasonally adjusted basis from one week earlier. On an unadjusted basis, the Index increased 8 percent compared with the previous week. The seasonally adjusted Purchase Index increased 5 percent from one week earlier. The unadjusted Purchase Index increased 6 percent compared with the previous week and was 11 percent lower than the same week one year ago.
The Refinance Index increased 12 percent from the previous week and was 5 percent higher than the same week one year ago.
The average contract interest rate for 30-year fixed-rate mortgages with conforming loan balances ($766,550 or less) decreased to 6.84 percent from 7.02 percent, with points decreasing to 0.65 from 0.67 (including the origination fee) for 80 percent loan-to-value ratio (LTV) loans.
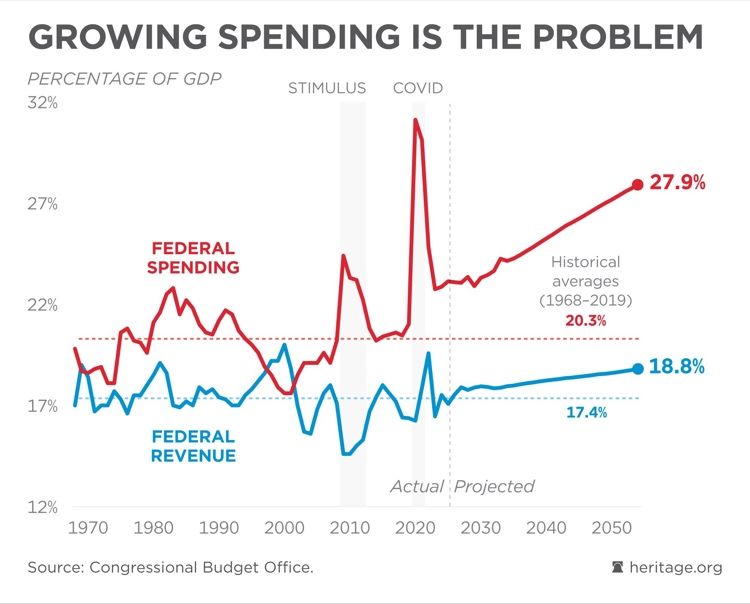
Following yesterday’s release of Biden’s $7.3 trillion budget, the Biden administration bragged about lowering the deficit by $3 trillion over the next decade – an average of 0.8% of GDP over that period.
This would consist of roughly $2.6 trillion over 10 years in additional spending programs, offset by around $4.8 trillion in tax increases over the same period. Most of the tax and spending proposals have been included in prior budget proposals from the White House, according to Goldman’s Alec Phillips, however there are several new items.
The budget would increase the corporate alternative minimum tax on book income from 15% to 21%, raising $137 billion over the next decade. It also limits a corporation’s ability to deduct employee pay exceeding $1mm/year, raising $272 billion over 10 years. The largest proposed tax increases include; raising the corporate minimum tax from 21% to 28%, as well as a series of tax increases on high-income earners, including new Medicare taxes, and a new 25% minimum tax on incomes over $100 million, raising $500 billion over the next decade.
Of course, it has zero chance of passing under the current Congress – but that’s not the point.
As one DC strategist wrote in a morning email noted by CNBC‘s Brian Sullivan, the budget deficit will still grow by another $16 trillion over the next decade – and that’s with aforementioned tax hikes.
Without them, the deficit grows to $19 trillion.
In short, talk of ‘$3 trillion saved’ is total bullshit in the grand scheme of things, given how much the national debt will grow in the best case scenario.
“No family budget or business could exist with this kind of math,” says Sullivan.
Yes Brian, no family budget could exist with this kind of math AND SPENDING!
And the national debt is rising by $1 TRILLION every 100 days. Before Spending Joe’s budget!


You must be logged in to post a comment.