Yellen’s Bald-Faced Lies Exposed (Cost Of Living Rose 25% More Than Average Hourly Wage Under Biden)

From Zero Hedge: Yellen’s Bald-Faced Lies Exposed

Authored by MN Gordon via EconomicPrism.com,

Did you see the recent government propaganda from the U.S. Bureau of Labor Statistics?

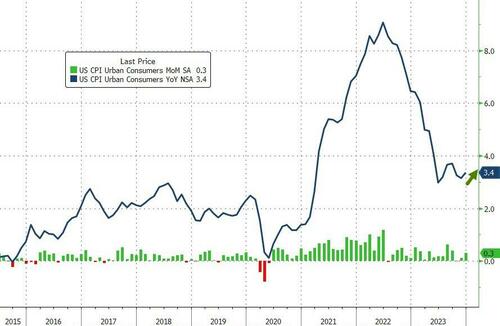
Not the latest faulty claim that consumer prices increased at an annual rate of just 3.4 percent in December.  But rather the claim that 216,000 jobs were added in December.

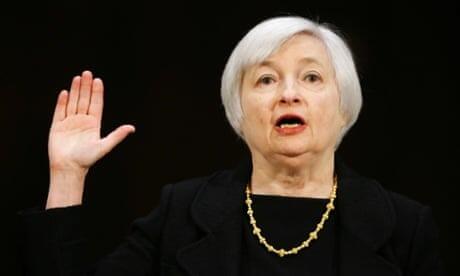
Upon release, and right on cue, Treasury Secretary Janet Yellen declared that the U.S. economy had achieved a soft landing.  She also said that her “hope is that it will continue.”
What Yellen neglected to mention was that October employment was revised down by 45,000 jobs and November was revised down by 26,000 jobs.  That’s 71,000 jobs the government recently reported which didn’t exist.

How many of the 216,000 jobs reported for December will wind up being pure fantasy?

Yellen also didn’t mention that 52,000 of the reported jobs are in government, 59,000 are in health care and social assistance, and 22,000 are in food services. 

These aren’t the kind of jobs that create and spread new wealth and abundance to the economy.

In addition, there are 4.2 million workers that are employed part time for economic reasons. 

This represents individuals who prefer full-time employment but are working part-time because their hours have been cut or they cannot find full-time work.

There are also 8.5 million multiple job holders.  These are people who work more than one job because a single job doesn’t pay the bills.

Yellen, obviously, isn’t interested in these pesky details.  What she is interested in is that when the data is massaged and contrived, and then summed up, the government can report an unemployment rate of 3.7 percent.

Hence, she can point to this number and crow about how through her expert navigation skills she has piloted a soft landing.

What’s really going on? 

Here we’ll offer an anecdote followed by some thoughts…

Burning Ambition

Your editor’s son, a junior in high school, works at a pizza joint in the mall.  There he makes and sells pizzas to hungry customers for $12.50 per hour – pre-tax.  The minimum wage in Tennessee is $7.25 per hour.

Of note, he’s the only highschooler working there.  His coworkers are all well into their dirty-30s.  Some have kids.  Some have multiple jobs.  We haven’t asked any of them.  But we suppose none would claim to be living the dream.

Reviews on Google are unflattering.  They warn of pizzas and customer service that are of dubious quality.  They tell a story of a shortage of good help.  Here are several recent examples:

“Walked up to ask when they open.  Some jerk behind the counter with a ponytail and big ear piercings goes, ‘Lights out not open!’  With a ton of attitude.  We said, ‘You don’t have to be rude, we just wanted to know what time you opened.’  And his response was, ‘Welcome to the mall.’  What an absolute jerk. Don’t go here!”

“Ever had stale crackers with cheap ketchup and paper-thin burnt pepperoni on top of a thin layer of what was once cheap cheese before?  If you’re on a quest to find the worst pizza in Knoxville, then come to the west town mall.”

“Got a slice of cheese pizza, sat down and the bottom of it was burnt.  I tried to go get a different slice and he told me that all the other pizzas would be like that too and that it was normal for them to serve burnt pizza.  He was a bit sarcastic about the situation.”

There are over one hundred reviews posted which share various tales of customer dissatisfaction.  You’ve likely had similar experiences at your own local establishments.  Burning pizzas and serving them with heapings of attitude is normal these days.  Though having a burning ambition is rare.

What’s the point…

Cherry Picking Data Durations

These low-level service jobs, filled by people with low-level skill sets, are the jobs that Yellen is so excited about. 

Absolutely, these jobs are important. 

If they didn’t exist there would be no option to get cheap mall pizza while simultaneously getting insulted. 

Life would be less abundant.

Nonetheless, these are not the type of jobs that drive the economy forward. 

They certainly don’t offer opportunities for American workers to get ahead. 

They don’t provide the cutting-edge skills, or the higher wages needed to propel the American economy above its foreign competitors.

One of Yellen’s key talking points is that wage growth is outpacing inflation.  She can even point to the December jobs report for justification.

Based on the government propaganda, hourly earnings rose 4.1 percent in the year through December while consumer price inflation, as measured by the consumer price index (CPI), came in at 3.4 percent for the year.  Here’s Yellen:

“Wage increases are running over price increases now.  American workers are getting ahead and the progress for the middle-income families is very noticeable.”

Cherry picking data durations to support a false narrative is a longstanding tactic of big government statists.  The reality is that on Yellen’s watch American workers have steadily fallen behind.

When you zoom out to show from December 2020 to the present, average hourly wages and CPI tell a much different story. 
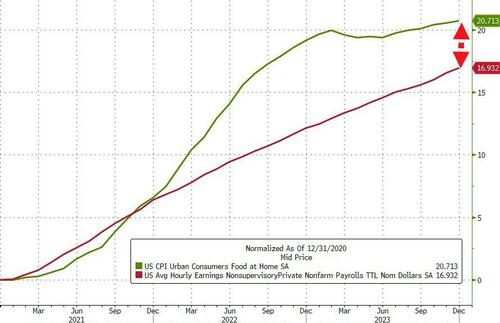
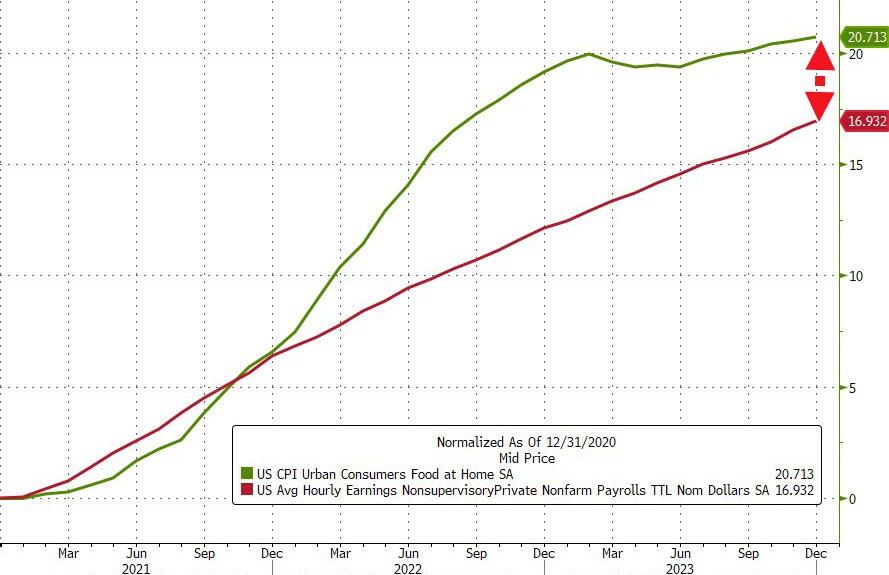
As David Stockman, the former Director of the Office of Management and Budget recently detailed“the cost of living has risen 25 percent more than the average hourly wage.”

In other words, American workers have taken a significant pay cut over the last three years.

Yellen’s Bald-Faced Lies

If you didn’t know, Yellen has held various positions with the Federal Reserve and later the Treasury over the last 30 years.  She’s participated in and advanced an era of unprecedented economic activism.

Moreover, Yellen and her colleagues at the Fed have their fingerprints all over the wage debasement that has taken place over the last several years. 

As Stockman elaborated:

“A few years ago when the shortest inflation ruler available—the core PCE deflator—was running significantly below the Fed’s sacred 2.00% target, the Eccles Building was all for a catch-up of the level.  The Fed even announced a policy of targeting inflation to average 2.0% over time, which ukase did not include, conveniently, the exact span of time to be measured.

“‘The Federal Reserve now intends to implement a strategy called flexible average inflation targeting (FAIT).  Under this new strategy, the Federal Reserve will seek inflation that averages 2% over a time frame that is not formally defined.  This means that after long periods of low inflation, the Federal Reserve will not enact tighter monetary policy to prevent rates higher than 2%.  One benefit of this flexible strategy to managing the mandate of price stability is that it will impose fewer restrictions on the mandate of full employment.’

“Wouldn’t you know it?  The Fed switched to ‘averaging’ in August 2020—just months before inflation went soaring to levels not seen since the 1970s.”

The gap between reality – consumer price increases vs wage increases – and what government bureaucrats want you to believe to be true takes frequent bald-faced lies to fill. 

Yellen, for her part, excels at selectively using contrived data to make assertions that are visibly false.

We don’t know if she believes the propaganda she spews or if her intent is to deceive people.  Regardless, the whole act is exceedingly wearisome.

US Mortgage Rates UP 141% Under Biden As M2 Money Growth Collapses (Fed Funds Rate Still Growing At 22.2% YoY)

The Federal Reserve has line on you!

The Federal Reserve has tightened their monetary manipulations to combat inflation caused by loose monetary policy and excessive spending by Biden and Congress.

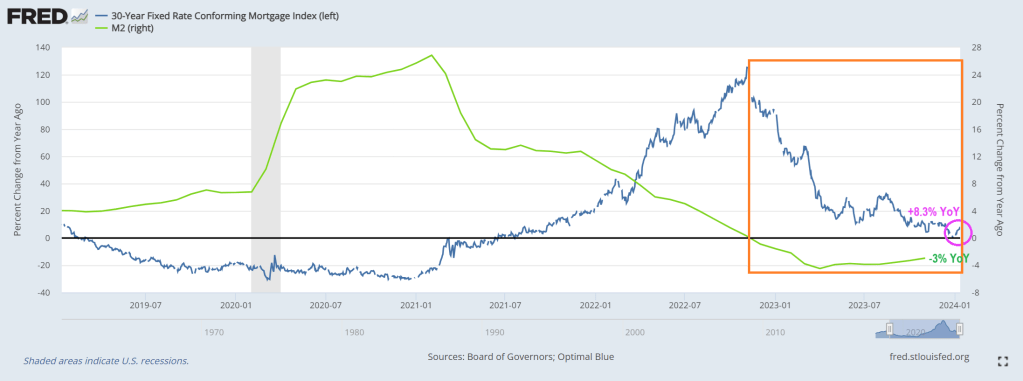
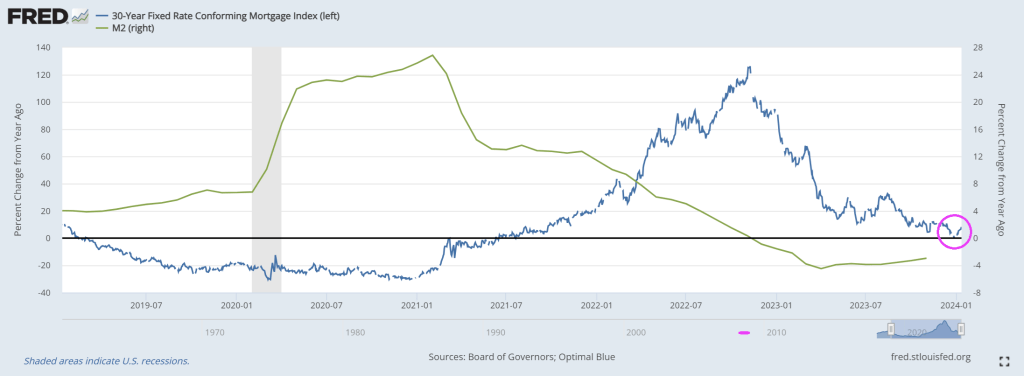
The result? US conforming 30-year mortgage rates are up 8.3% since last year and up a whopping 141% since the beginning of 2021 (the year Biden was selected to be President).

Check out mortgage rate GROWTH (blue line) as M2 Money growth *green line) went negative (orange box).

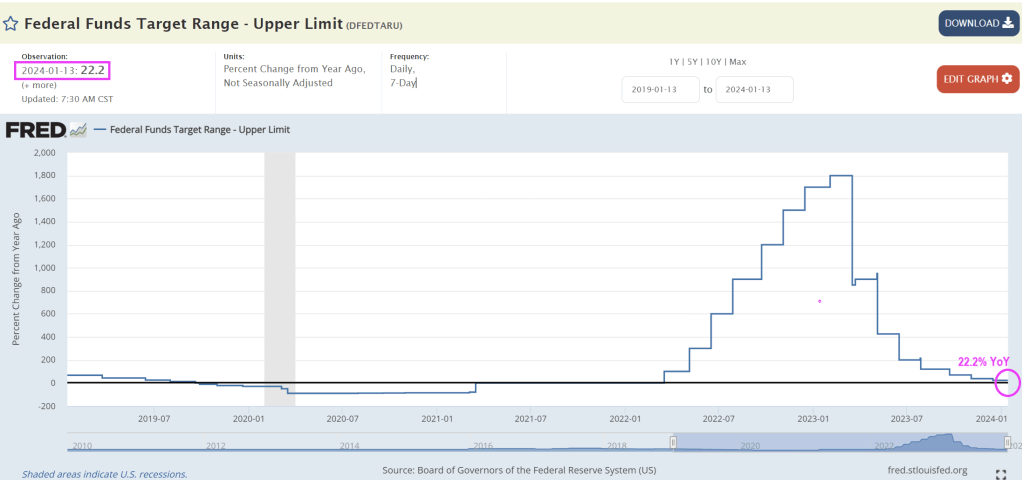
This graph corresponds nicely with this chart of YoY changes in The Fed Funds rate. Which is still rising at a rate of 22.2% year-over-year (YoY).
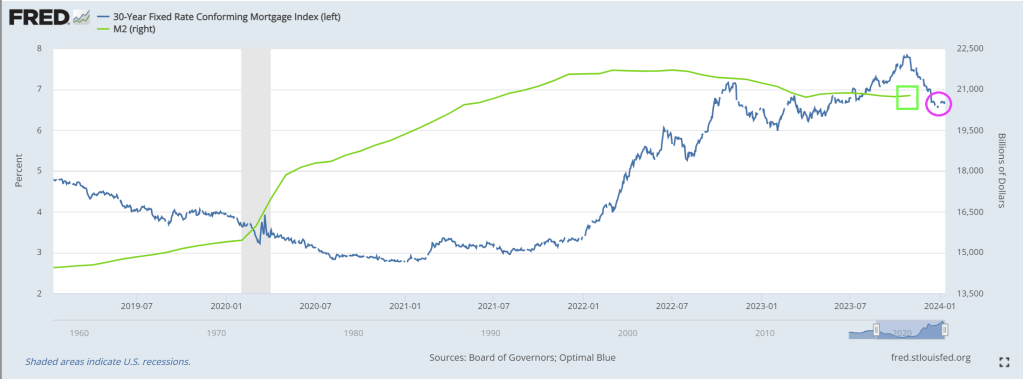
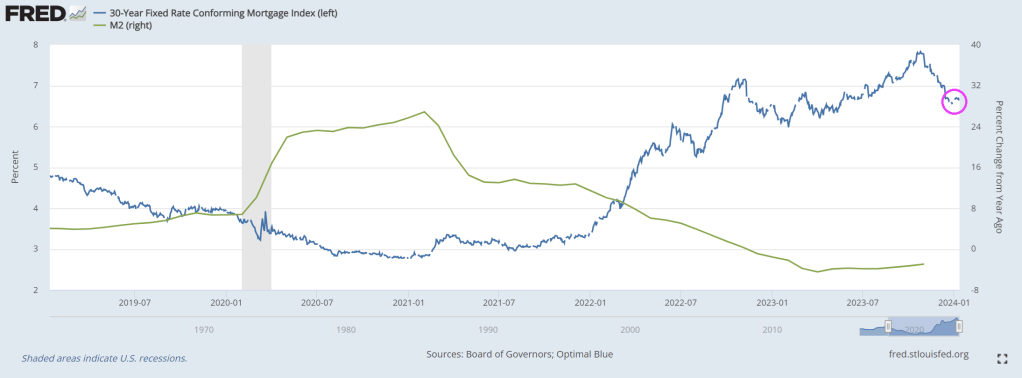
The 30-year mortgage rate had been falling after peaking in August 2023 after peaking at 7.299%. The latest reading on January 11, 2024 was 6.662%.

US Mortgage Rates Rise Slightly (+8% YoY) As M2 Money Growth Dies (-3% YoY) In Plain Sight (M2 Money Growth Has Been Negative For All Of 2023)

We are closing out the first week of the New Year and 30-year conforming mortgage rates are up slighlty.

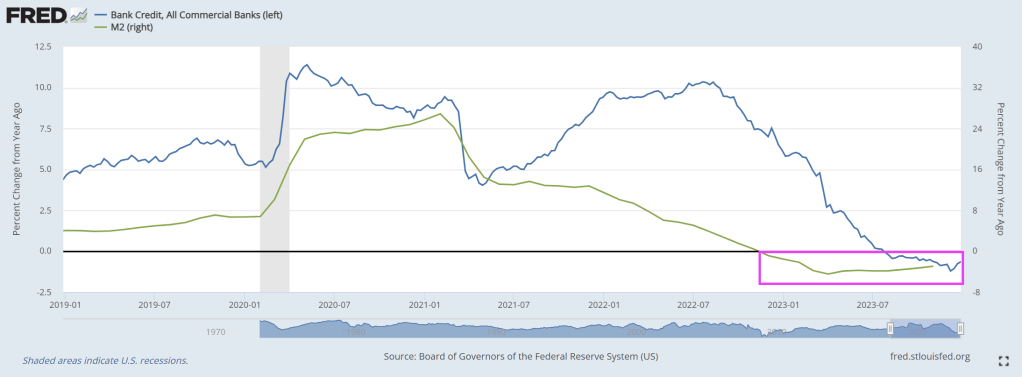
Mortgage rate GROWTH is now at 8% year-over-year (YoY). While M2 Money growth has died and is down -3% YoY.

Bank credit growth has been negative since July 2023 and M2 Money growth has been negative for the entirity of 2023.

Mortgage rates should decline in 2024 as The Fed cuts rates to prop up Vacation Joe.
Here is a video of The Federal Reserve managing interest and mortgage rates.
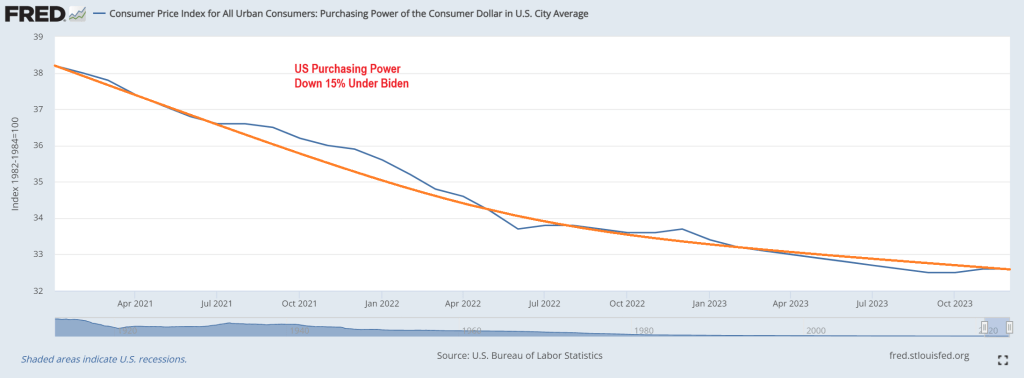
Government Power! Core Producer Prices Up 17% Under Biden But 3rd Straight Month Of ‘Deflation’ (Consumer Purchasing Power Down 15% Under Biden)

Government power is causing inflation and middle class economic repression.

For example, US credit card debt is at an all-time high as consumers attempt to cope with inflation under Biden.

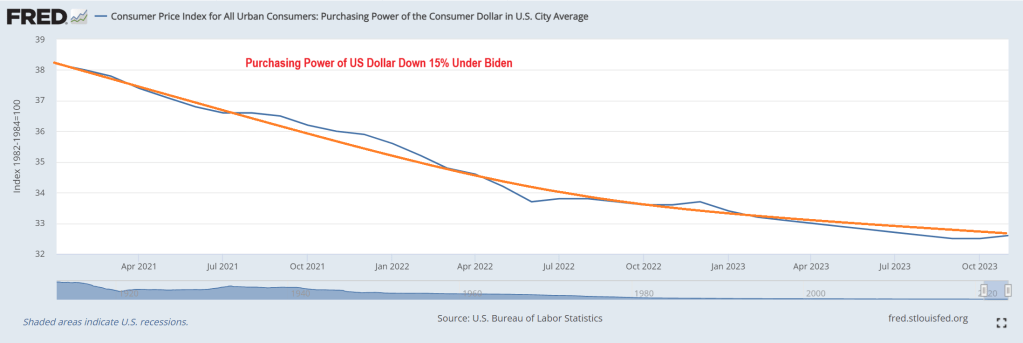
While inflation RATE is finally cooling off, the LEVEL of inflation remains high. Purchasing power for consumers is down 15% under Vacation Joe.

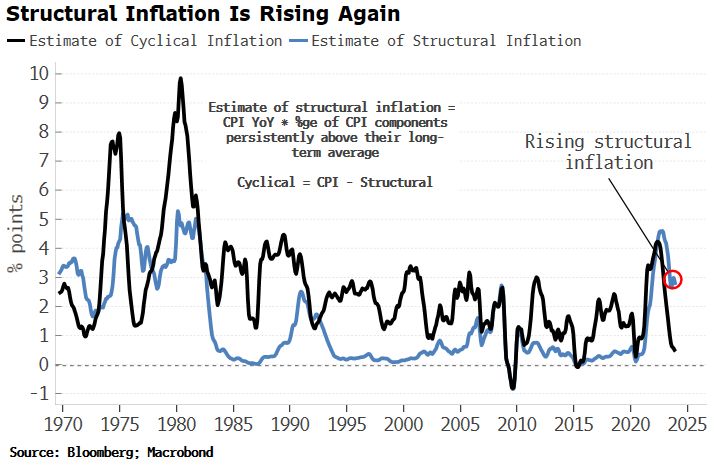
With structural inflation rising again.

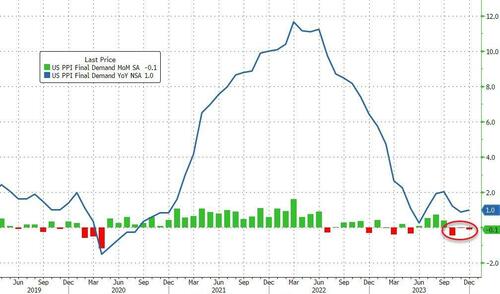
Following yesterday’s hotter-than-expected CPI, this morning’s Producer Price Index was expected to accelerate (headline not core). However, it did not – headline PPI actually decline 0.1% MoM (+0.1% MoM exp). That is the 3rd straight month of ‘deflation’ but inched PPI YoY up to +1.0%

Source: Bloomberg

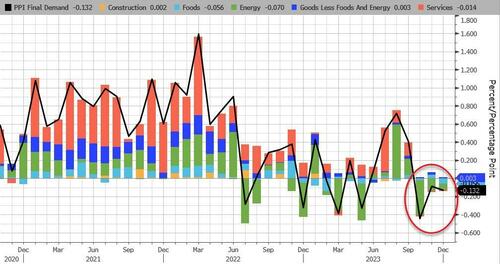
Energy and Construction cost deflation dominated the headline PPI MoM decline…

Source: Bloomberg

Energy and Food deflation dominated the slowing of the YoY PPI (though Services is re-accelerating)…

Source: Bloomberg

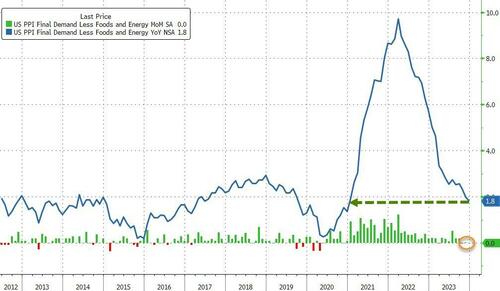
Excluding food and energy, the core PPI was unchanged MoM in December – the third month of unchanged in a row, which dfragged the Core PPI YoY down to +1.8% (the lowest since Dec 2020)…

Source: Bloomberg

Goods PPI deflated and Services was unchanged…

Half of the decrease in the index for final demand goods is attributable to prices for diesel fuel, which dropped 12.4%

Over 80% of the decrease in the index for unprocessed goods for intermediate demand can be attributed to a 13.2% drop in prices for crude petroleum.

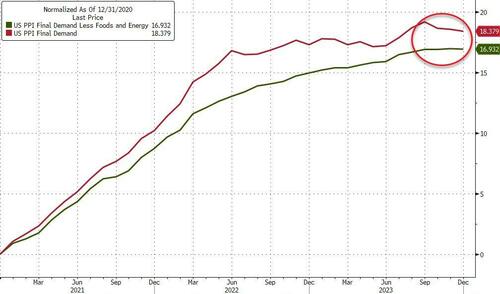
Reminder, disinflation does not mean lower prices. Core producer prices are up 16.9% since President Biden came into office (and headline PPI up over 18%)

Source: Bloomberg

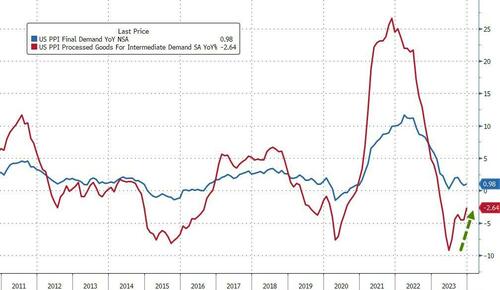
Finally, the deflationary impulse remains for the headline PPI as ‘intermediate PPI’ remains below zero BUT it is starting to accelerate higher…

Source: Bloomberg

That’s a little worrying given The Fed seems adamant it wants to cut in March to save the banking system from collapse.

I am amazed that the Biden family babysitter (Jill Biden) is trashing Trump supporters calling them insurrectionist and dangerous extremists while her demented husband tries to use courts to remove his primary Presidential candidate from the ballot and violates Federal law by leaving the border wide open, letting in millions of unvetted immigrants. Rep Jerry Nadler (D-NY) admitted that he is in favor of open borders because 1) fruits and vegetables need to be picked and 2) Democrats need to import Democrat voters because Americans are fed up with Democrat policies. Like rampant inflation.

And Jill Biden said Joe works hard EVERY DAY! Except for the near 40% of his Presidency spent on vacations to Delaware, Nantucket, Virgin Islands and whereever else large corporate donors live.

Biden’s Fiscal Inferno! Biggest Peactime, Non-crisis Budget Deficit In US History! (December Deficit Equals $129.4 Billion, UP 50% From December 2022)

Yes, it’s Biden’s fiscal inferno! And getting worse as the Presidential election approaches!

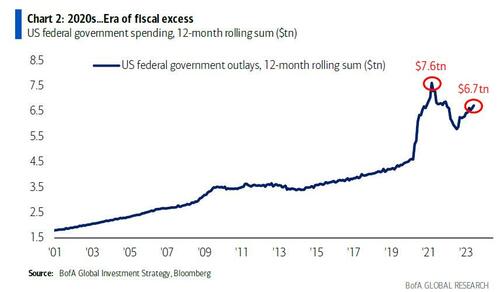
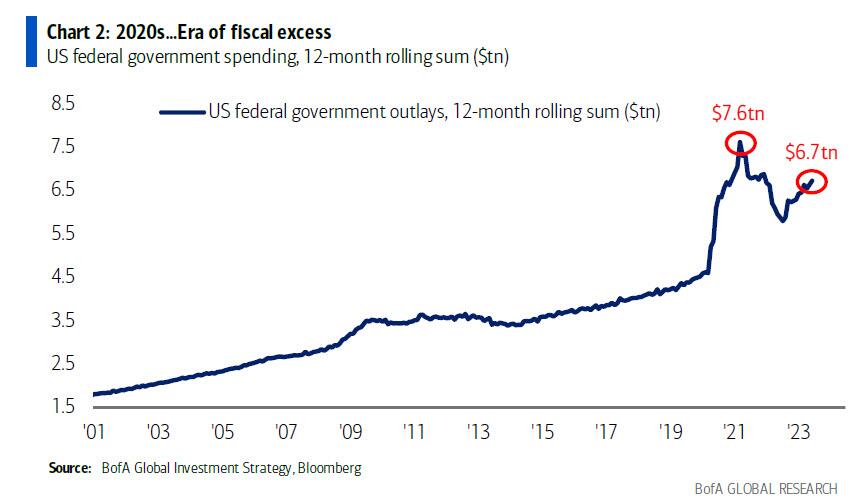
Remember when I showed that the “stealth” secret sauce behind Bidenomics was nothing more than a massive, multi-trillion debt-fueled spending spree, which led to the biggest peactime, non-crisis budget deficit in US historywith the total deficit for fiscal 2023 ending just over $2 trillion, or double the prior year, something which BofA’s Michael Hartnett called the “era of fiscal excess”?

Well, we have news for you: if 2023 was bad, 2024 – an election year of course – is shaping up to be far worse.

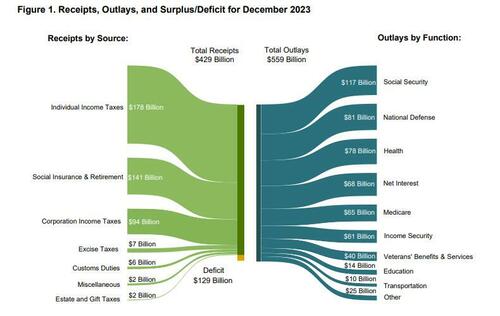
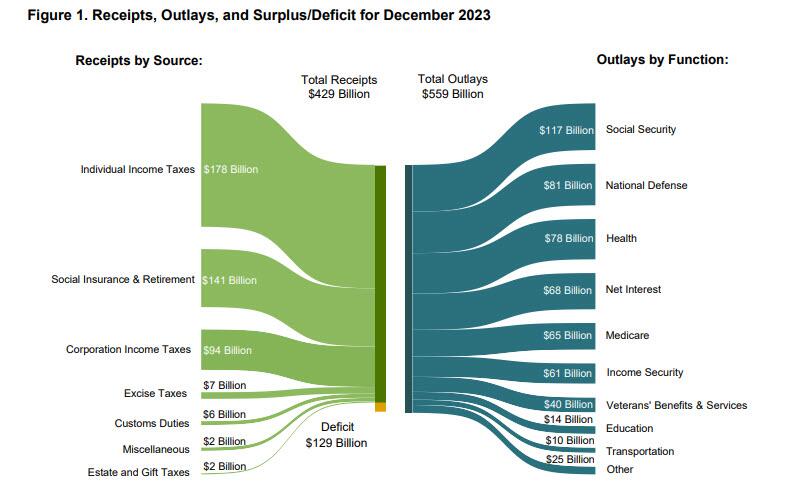
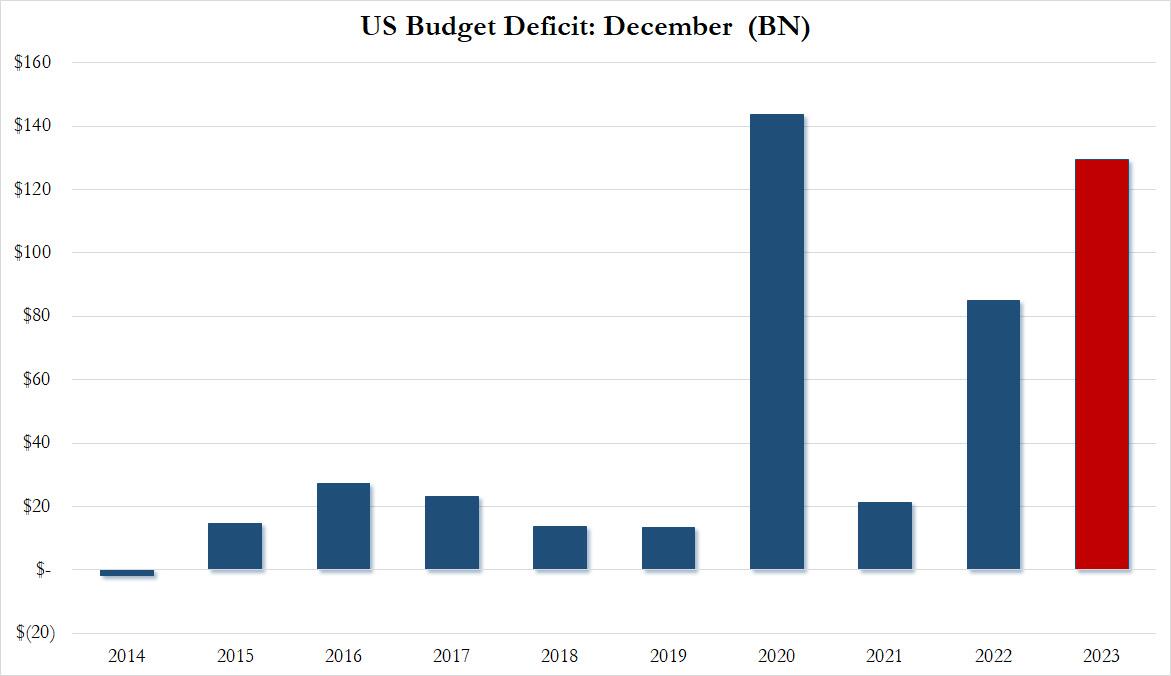
Moments ago the US Treasury reported the budget deficit picture for December and it will come as no surprise to anyone that the US has continued to spend like a drunken sailor, or rather, even more. As shown in the chart below, in the month of December, the US collected $429 billion through various taxes, while total outlays hit $559 billion…

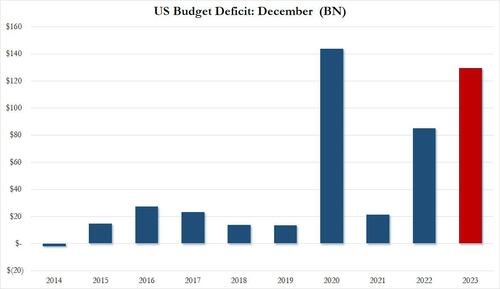
… resulting in a December deficit of $129.4 billion.This may not sound like a lot, but December is actually one of those months when the US deficit is relatively tame, or used to be.

As shown in the next chart, traditionally the December deficit was barely in the $10-20BN range… until 2020 when it exploded to an all time high of $140BN. And while it dropped sharply in 2021, it rebounded dramatically in 2022, and rose to just shy of the December crisis high last month!

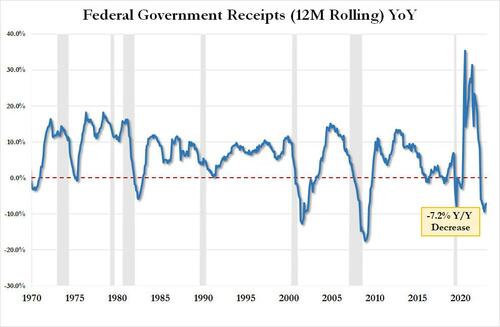
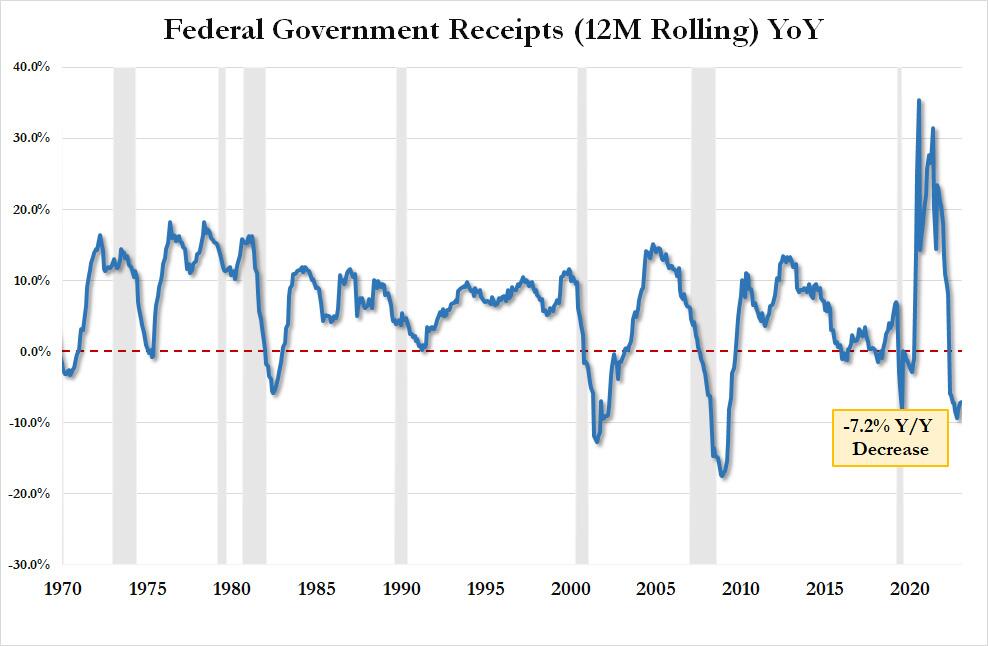
Here is some more context: tax receipts of $429.3BN in December were down 5.6% from the $454.9BN in December 2022 and down a whopping 11.8% from December 2021. On an LTM basis, US total tax receipts were $4.521TN, or down 7.2% YoY. This is now the 9th consecutive YoY decline in LTM tax receipts, something that historically has only taken place when the US was in a recession. As an aside, the “smart economists” were certain that the collapse in tax receipts would reverse after November when the postponed California taxes would be collected. Well, November has come and gone and the big picture is just as ugly.

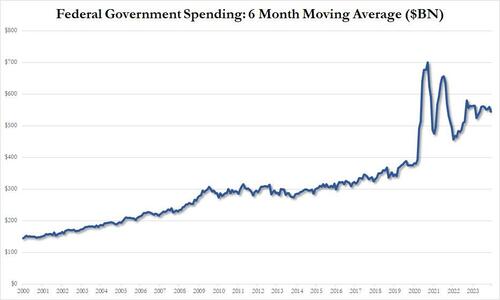
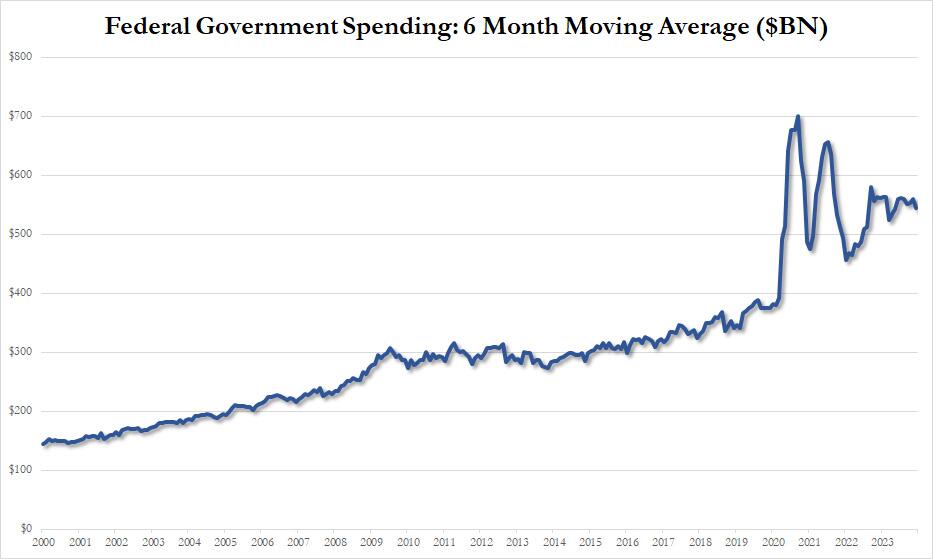
Looking at outlays, unlike tax receipts, there is danger of a decline… ever; and indeed in December the US spent a total of $559 billion, up 3.5% from the $540BN spent a year ago, and up even more from the $508BN in 2021. On a 6 month moving average basis, we are rapidly approaching the exponential phase even when accounting for the spending burst in 2020 and 2021.

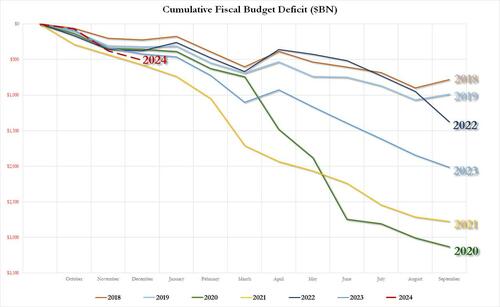
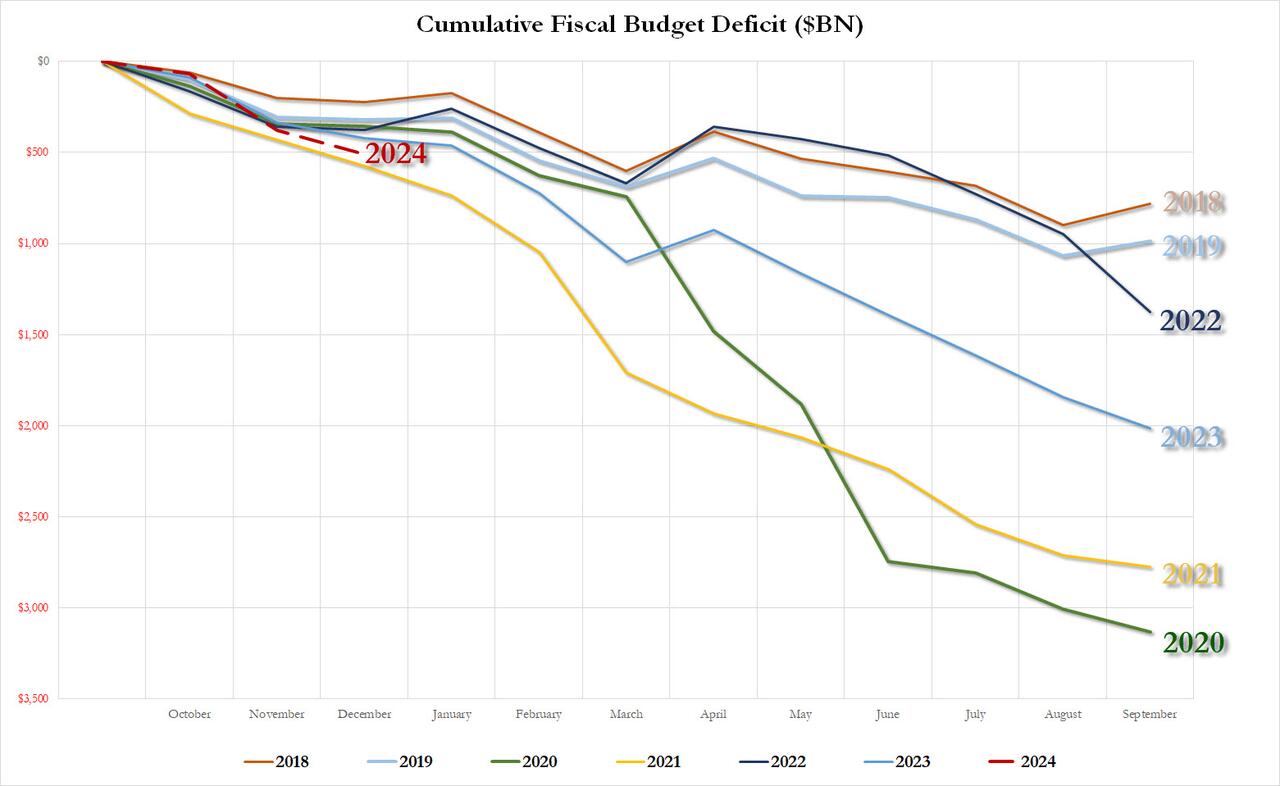
Putting it all together, we get the scariest chart of all: the YTD budget deficit three months into fiscal 2024 is already $509 billion, which would be the biggest deficit in US history after one quarter with the exception of the covid outlier year of 2021 when the US injected multiple trillions in stimmies.

As for the final, and most shocking, data point, the December budget deficit of $129.4 billion was more than $40BN higher than the $87.5BN median estimate, and was more than 50% higher compared to the $85BN December deficit in fiscal 2022.

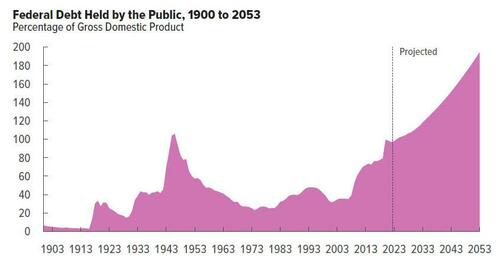
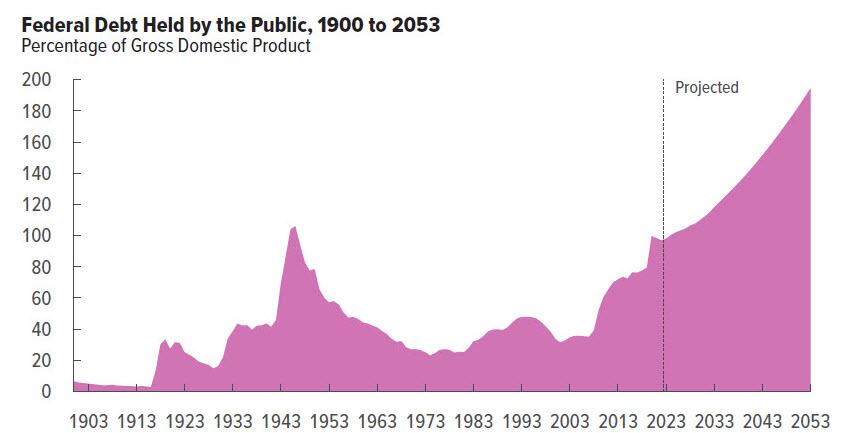
Needless to say, this is completely unsustainable and assures fiscal collapse for the US, not if, but when. Then again, we already knew this thanks to the CBO which was kind enough to chart the endgame:

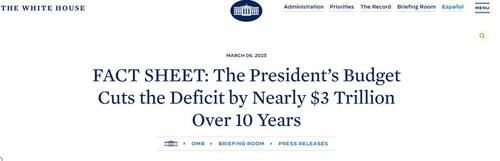
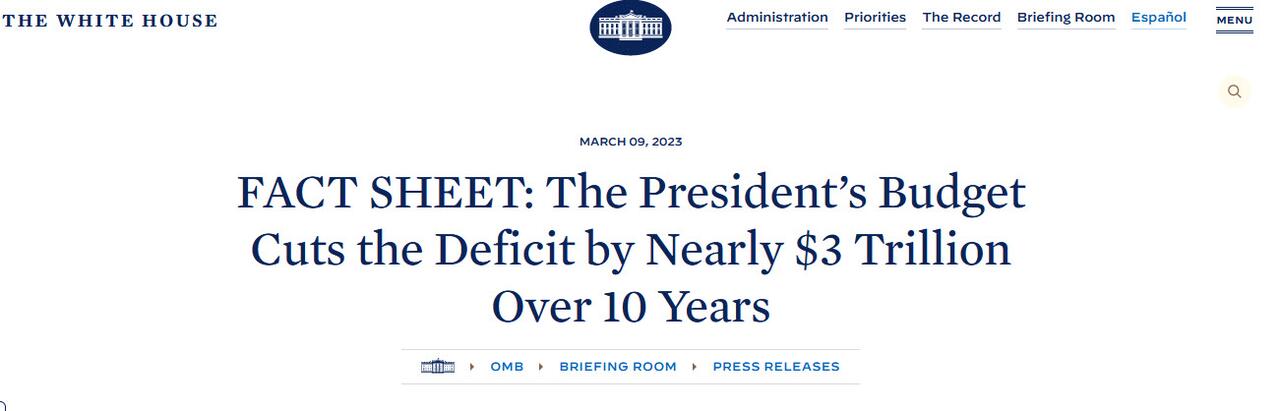
What is funniest about all this is that the US is on an accelerating path to ruin less than one year after the imposter in the White House published this laughable propaganda.

We can’t wait to see what really happens to the budget deficit over the next 10 years. Spoiler alert: there won’t be a happy ending.

And here is The Federal Reserve Board coming to the rescue of Biden!

Inflation Feelin’ Hot, Hot, Hot! CPI Rises To 3.4% YoY, Core Inflation Declines To 4% YoY (Is The Fed Tightening Too Much Since The Target Rate Is 150 Basis Points HIGHER Than Core Inflation Rate??)

Inflation is feelin’ hot, hot, hot!

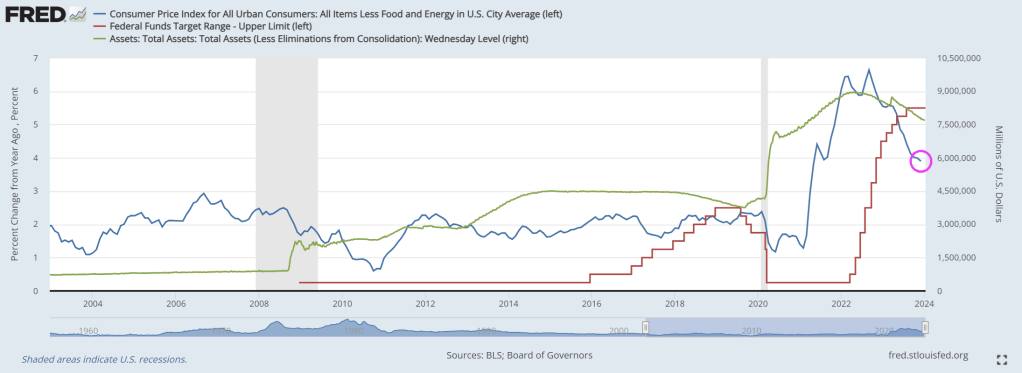
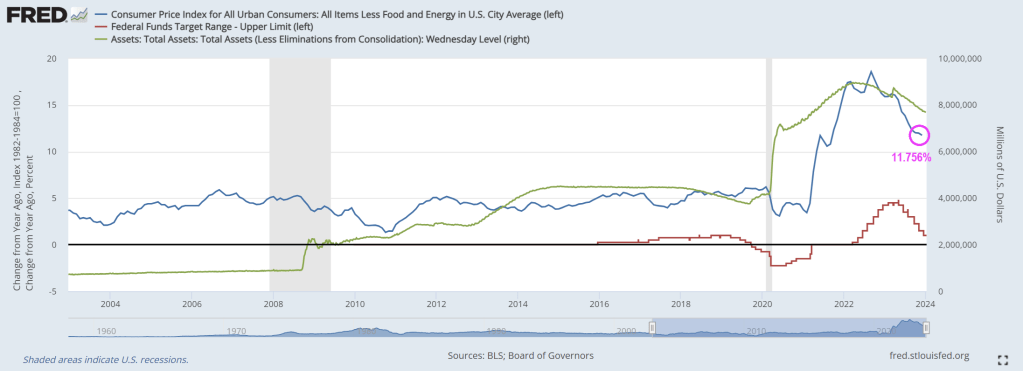
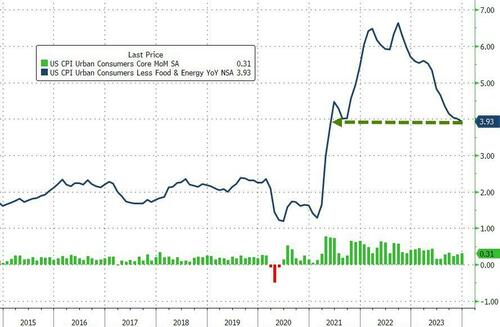
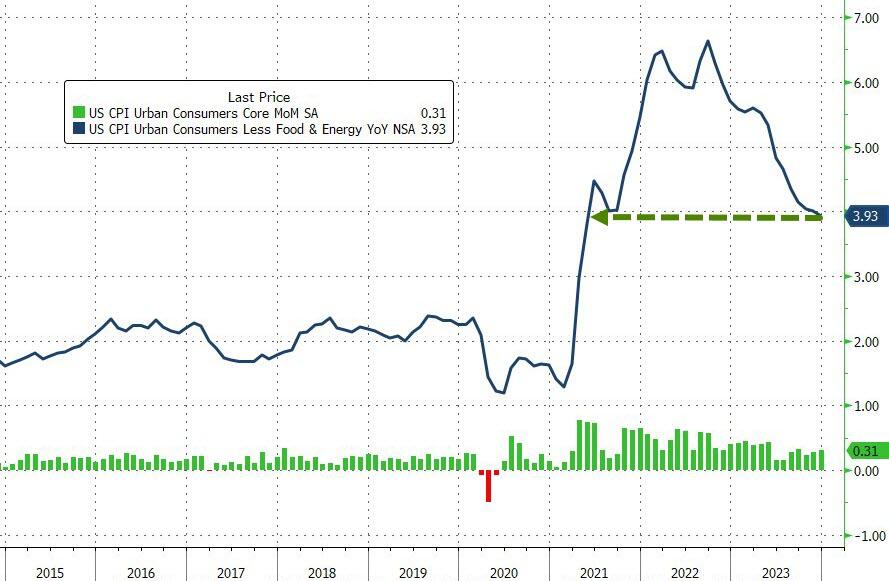
Although core inflation declined in December (CPI all items less food and energy), it is still hot, hot, hot at 4% Year-over-year (YoY). This raises the following question: Is The Fed tightening too much? Aka, yet another Fed policy error?? Since The Fed target rate is 5.50% and core inflation is now 4%?

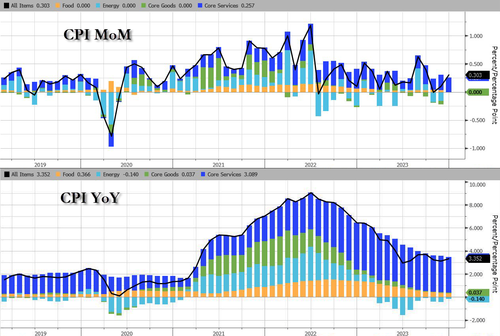
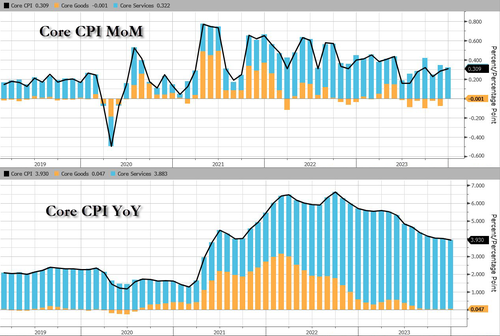
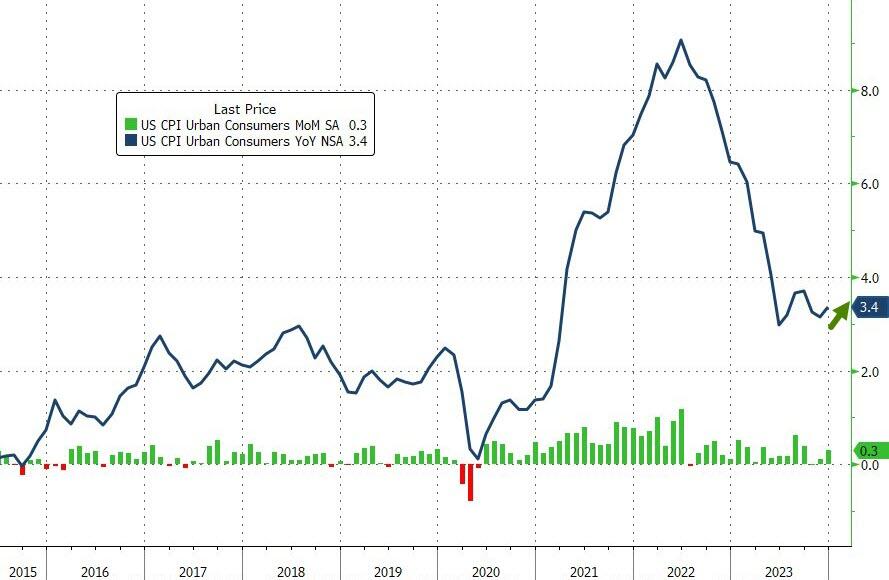
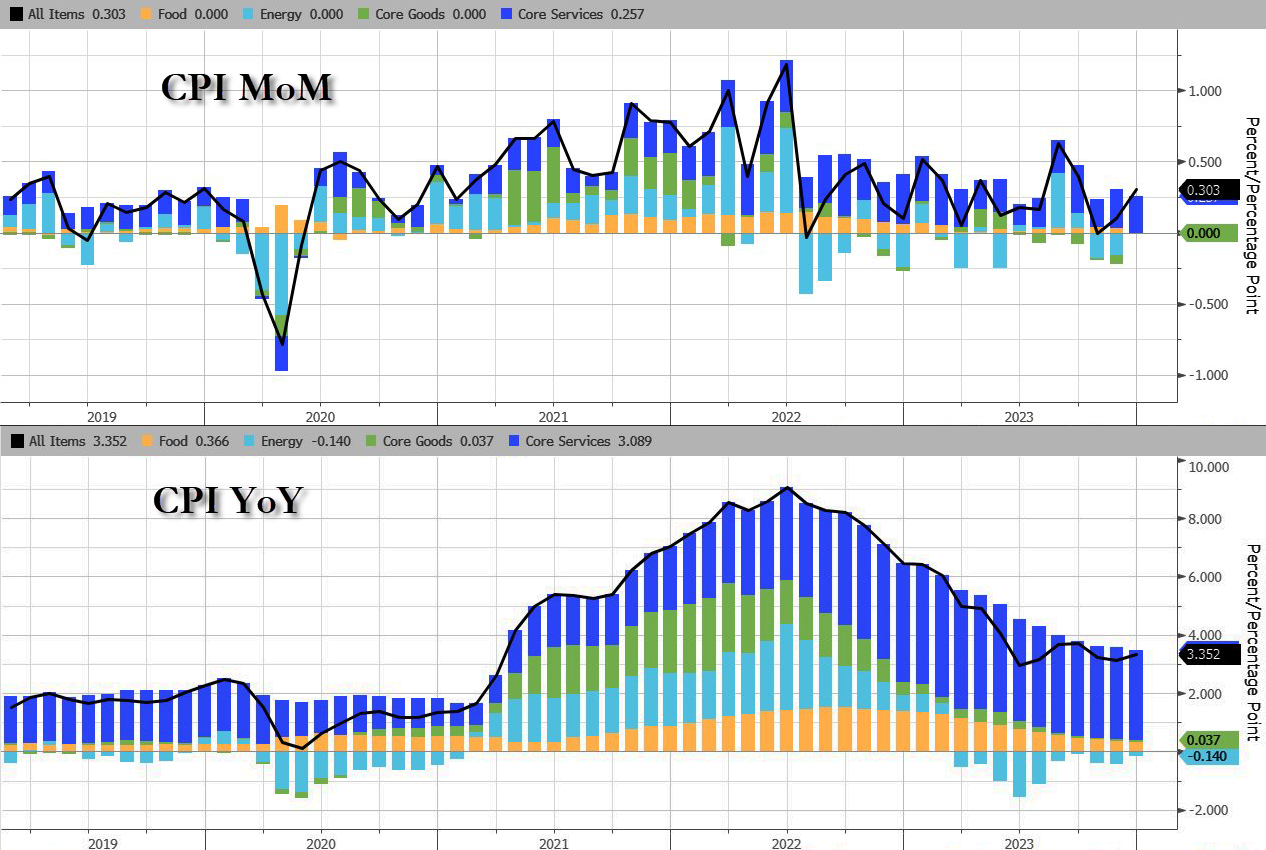
Headline Consumer Price Inflation printed hotter than expected in December, +0.3% MoM vs +0.2% exp and +0.1% prior, pushing the YoY headline CPI up to +3.4% (from +3.1% prior and hotter than the +3.2% exp)…

Source: Bloomberg

Services (Shelter mostly) costs re-accelerated and energy deflation stalled in December…

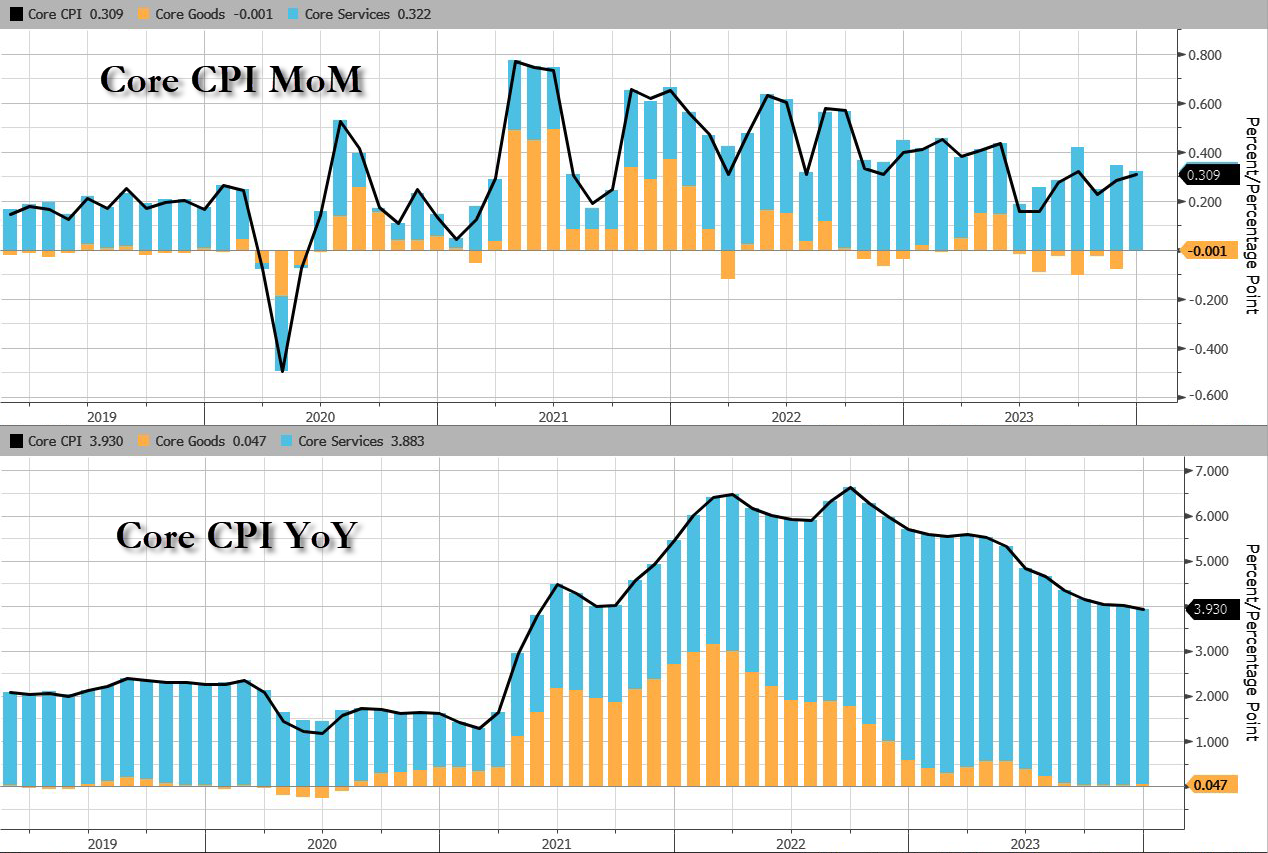
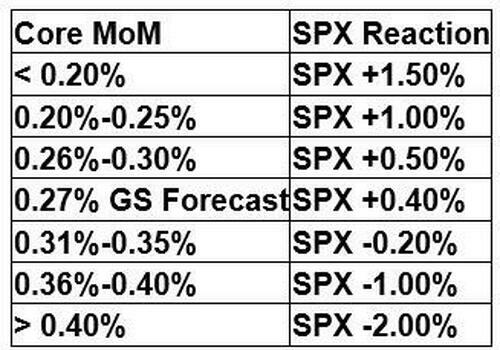
On the brighter side, core CPI according to the BLS rose 0.3% MoM as expected, dropping the YoY change below 4.00% for the first time since May 2021…

Source: Bloomberg

Goods deflation has stalled as the used cars and trucks index rose 0.5 percent over the month, after rising 1.6 percent in November.

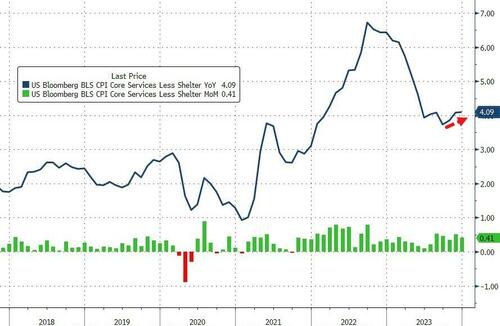
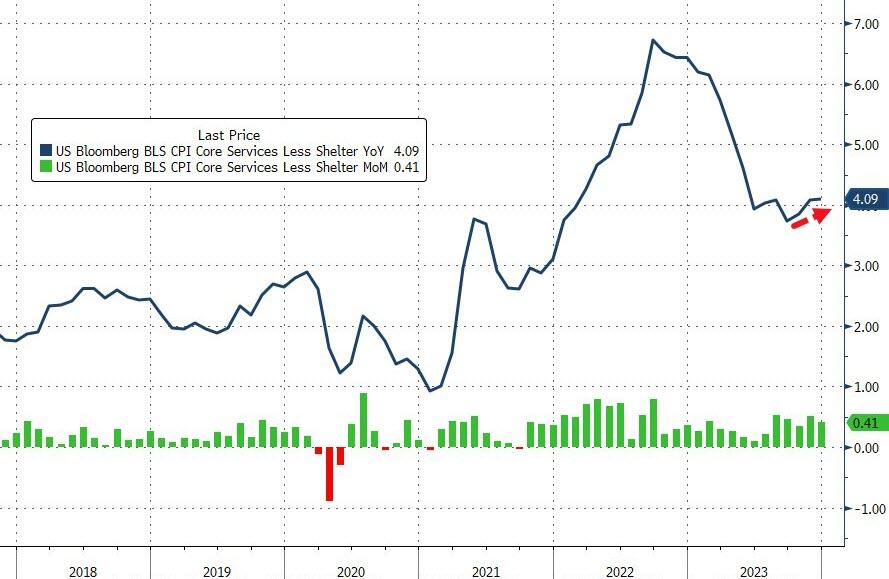
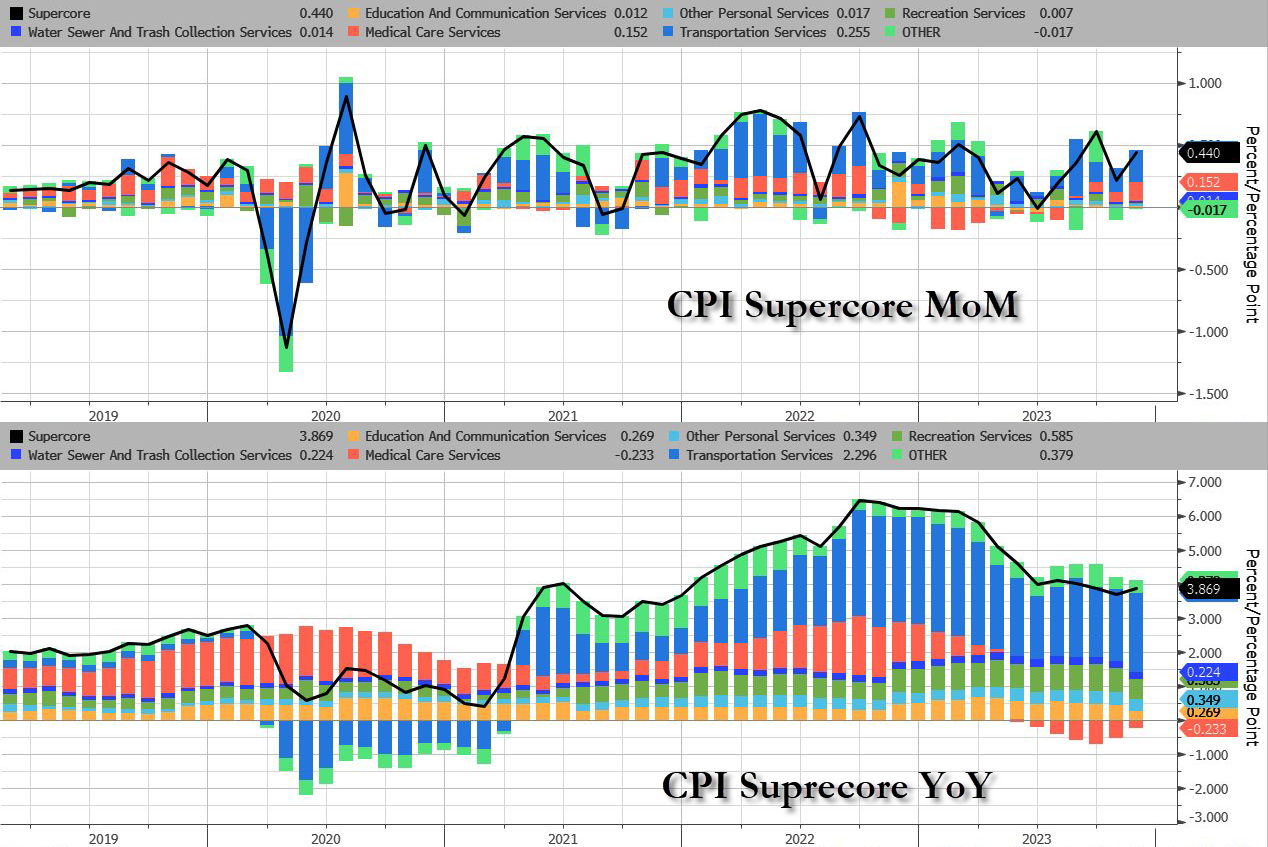
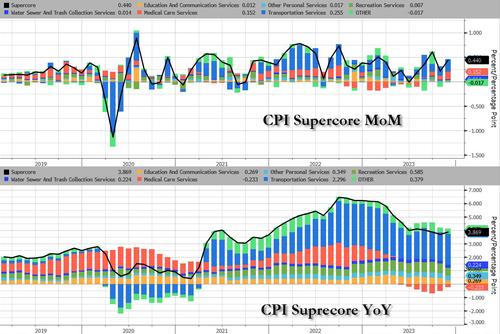
More problematically for The Fed (and the rate-cut ‘hypers’), is the fact that Core CPI Services Ex-Shelter (SuperCore) rose 0.4% MoM, upticking the YoY rise to +4.09%…

Source: Bloomberg

This is a category that Fed Chair Jerome Powell and other policymakers have highlighted as a focus. 

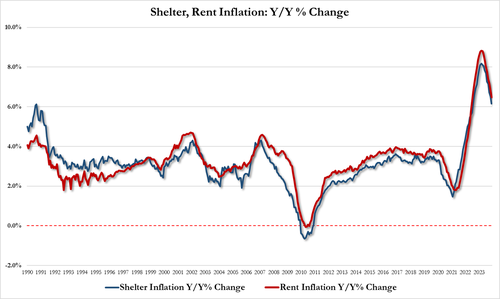
All the subsectors of SuperCore rose MoM with the shelter index increased 6.2 percent over the last year, accounting for over two thirds of the total increase in the all items less food and energy index.

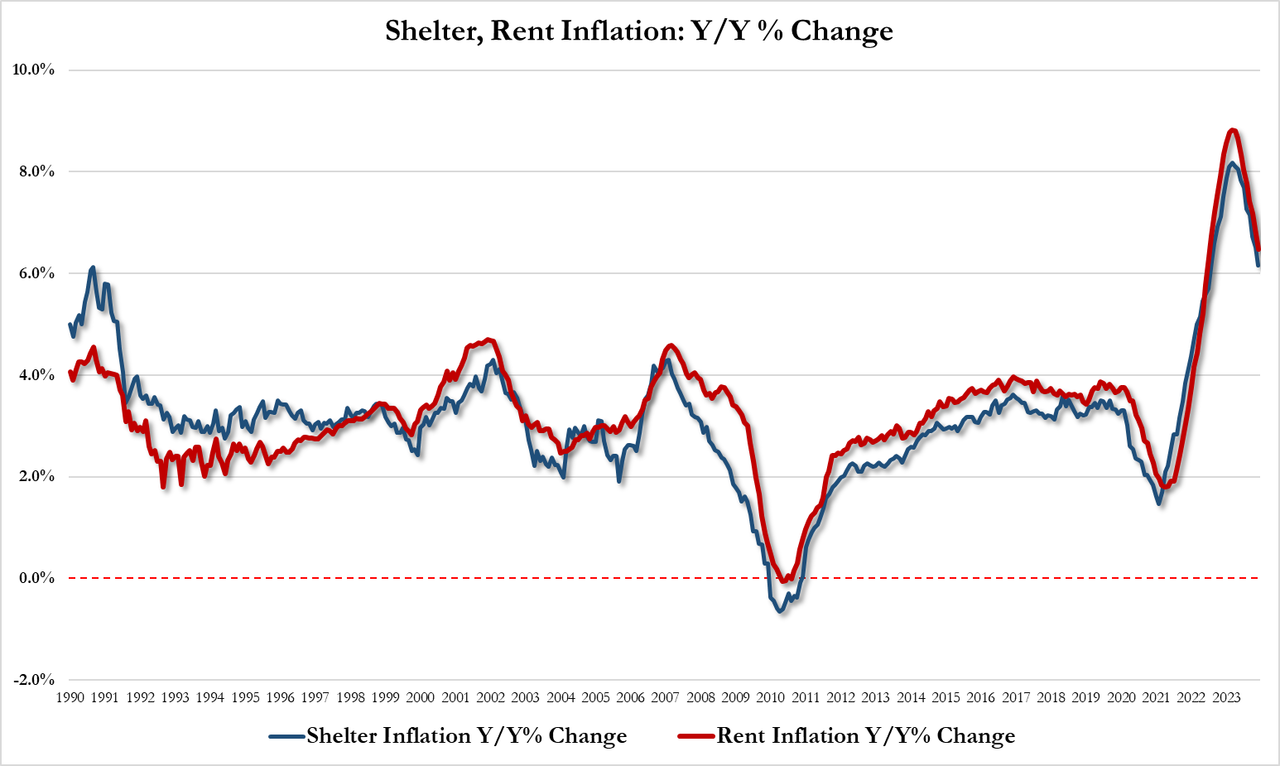
But shelter inflation is slowing (slowly):

  • Shelter inflation was up 6.15% YoY in Dec, down from 6.51% in Nov and the lowest since July 2022
  • Rent inflation was up 6.47% YoY in Dec, down from 6.87% in Nov and the lowest since July 2022

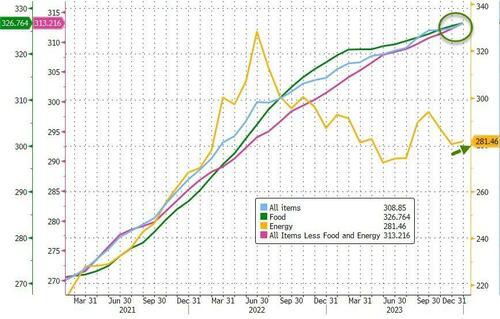
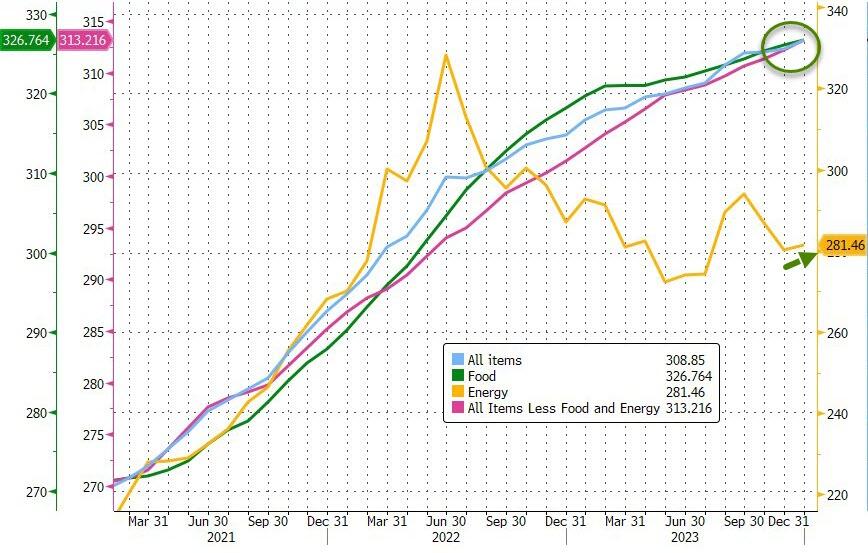
And the next time someone from the Biden administration says ‘inflation is down’ in an attempt to gaslight the public into believing ‘prices are down’ – show them this chart…

  • Headline costs at record highs
  • Core costs are record highs
  • Food costs at record highs
  • Fuel costs on the rise again

Source: Bloomberg

Four of the six major grocery store food group indexes increased over the month.

The index for meats, poultry, fish, and eggs rose 0.5 percent in December, led by an 8.9-percent increase in the index for eggs.

The index for food away from home rose 5.2 percent over the last year.

The index for limited service meals rose 5.9 percent over the last 12 months, and the index for full service meals rose 4.5 percent over the same period.

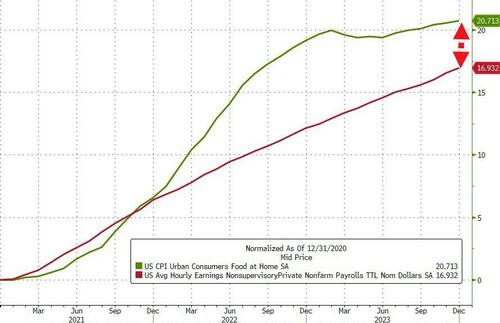
The White House was quick to note that real hourly earnings was positive in December (+0.8% YoY) but that number is the aggregate of ALL American workers.

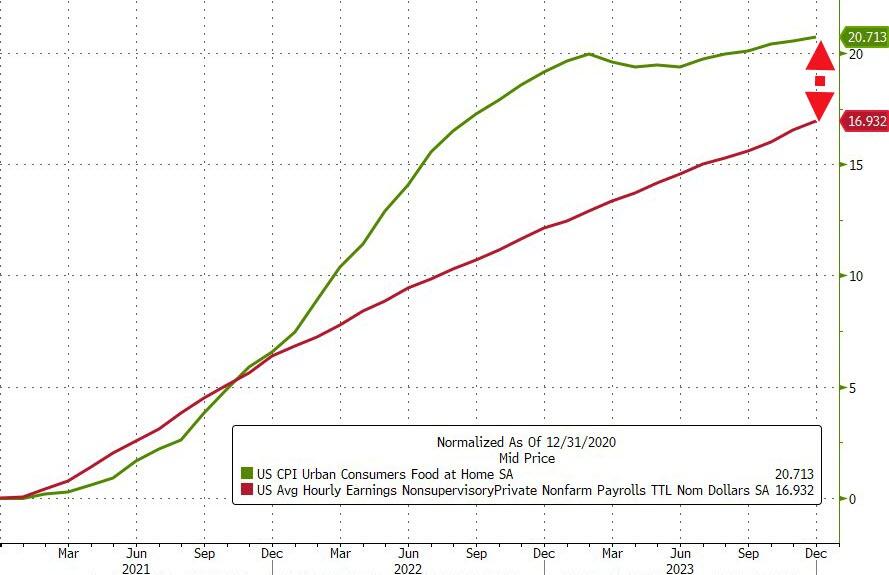
If we drill down to the ‘average joe’ – production and non-supervisory jobs – their wages are up 17% since Biden was elected… The only problem is, the cost of food since then has surged almost 21%…

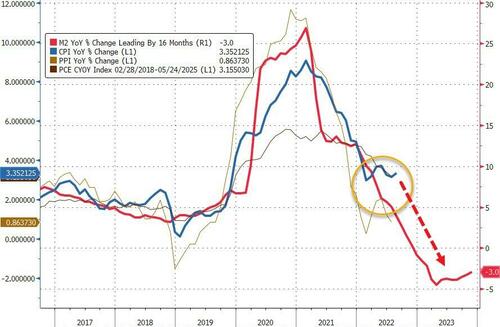
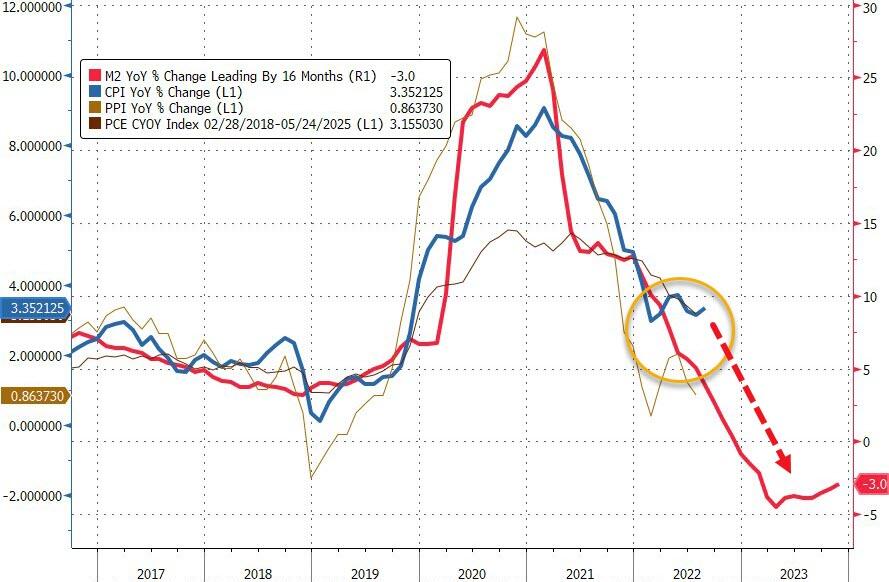
Is this a pause before the re-plunge? M2 thinks so…

So what happens next?

Not so much Goldilocks perfection. 

Powell is in a real pickle now – does the Fed begin shrinking QT in March (which it has to if it is terminating BTFP and Reverse Repo is drained) without starting rate cuts.

Nobody But The Fed! Expiration Of Fed Bank Bailout Facility Strengthens Calls For Earlier Rate-Cut (As Core Inflation Falls Below Fed Funds Target Rate)

Nobody manipulates markets like The Federal Reserve! Nobody but The Fed.

Here we sit with core inflation rate BELOW the current Fed Funds Target Rate (upper bound). So is it time to start withdrawing its more than ample monetary stimulus. Like the Bank Term Funding Program.

The Federal Reserve is likely to retire the Bank Term Funding Program in March. This would entail an additional ongoing headwind for reserves, and thus liquidity, through 2024. At the margin, this adds weight to the case for the Fed cutting interest rates sooner in the year.

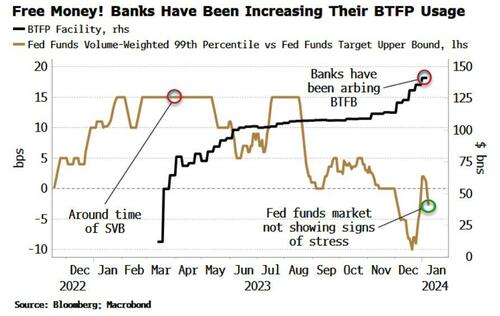
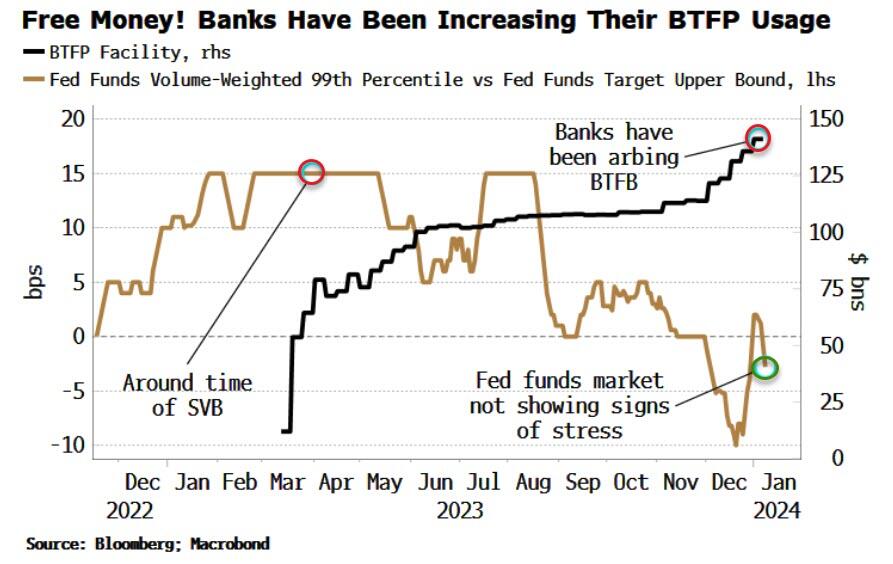
The BTFP was created in the wake of the SVB crisis to help struggling banks get access to liquidity when bond prices were dropping. However, its use in recent months has jumped to over $140 billion. That is not, however, a sign of banking stress.

The chart below shows the usage of the BTFP along with the rate paid at the 99th percentile in the fed funds market relative to the upper bound of the range for fed funds.

As can be seen, this is under zero, i.e. banks are not having to pay up to get liquidity.

This is in stark contrast to last March at the time of SVB’s fall when some banks were having to pay 15 bps above the fed funds upper bound for liquidity.

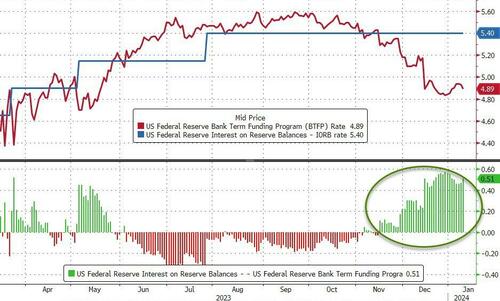
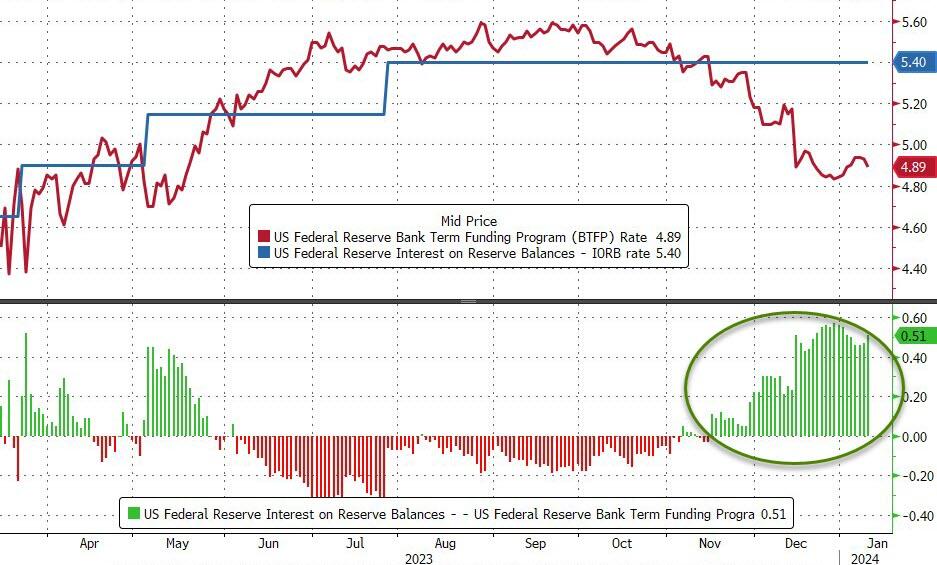
This time the rise in BTFP usage is good old-fashioned arbitrage. After the Fed’s pivot, term rates have come down relative to the policy rate. The cost to use the BTFP is 1y OIS + 10 bps, which is ~4.90%. Banks can post USTs at par as collateral, borrow at this rate, then deposit the funds back at the Fed at the IORB rate (interest on reserve balances), i.e. 5.40%, for a juicy risk-free profit.

This is not good optics, so it is unlikely the program will be renewed when it is due to expire on March 11. Michael Barr, the Fed’s vice chair for supervision, hinted as much on Tuesday when he emphasized the BTFP is an “emergency program.”

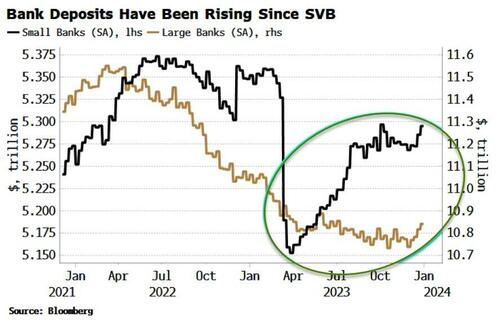
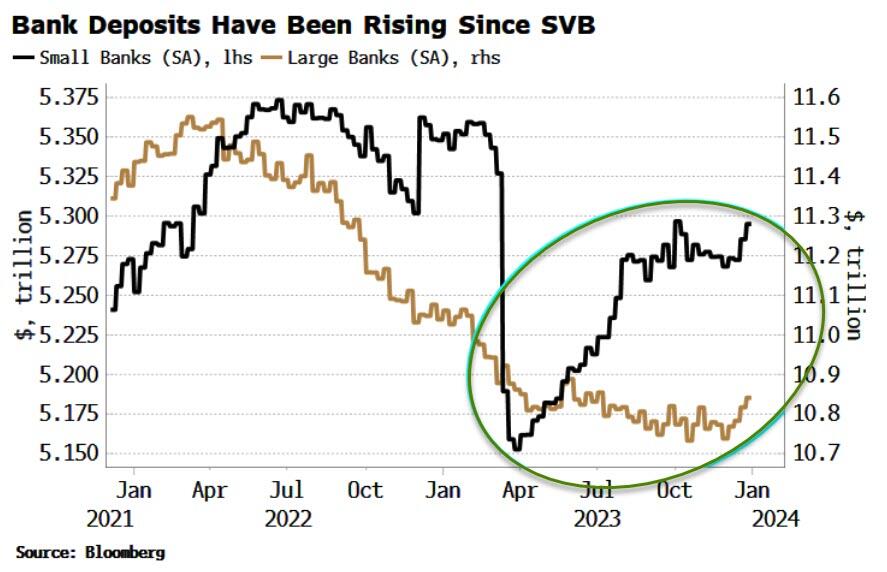
And it seems clear the emergency is over. Deposits of small banks (for whom the program was aimed at) have been rising since their drop after SVB’s collapse (both on a seasonally and non-seasonally adjusted basis). That, along with the quiescent fed funds market, suggests banks are not facing stress. Furthermore, the Fed’s pivot has also increased collateral values, making banks’ hold-to-maturity portfolios less underwater.

The BTFP’s expiry would mean another ongoing drain on reserves as the loans expire over the year.

With the Fed now seemingly focused on liquidity in this new paradigm, this adds to reasons why the central bank may cut earlier in the year.

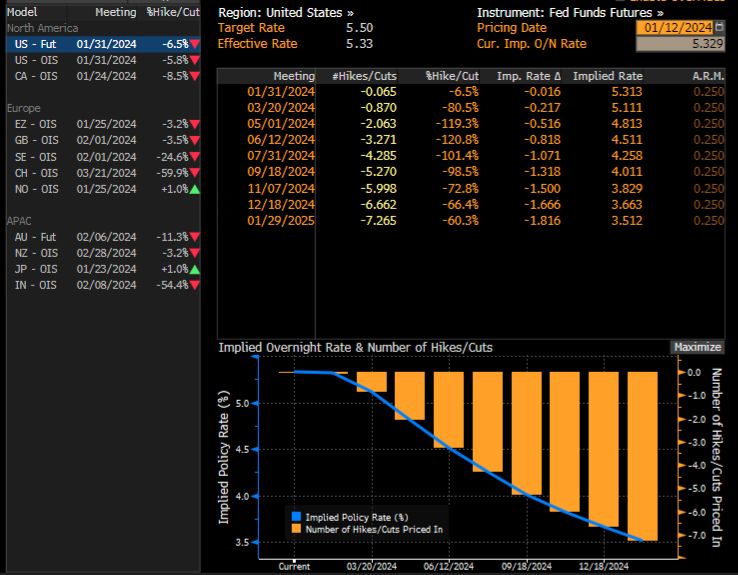
The market is currently pricing 17 bps of cuts for the March 20 meeting, so that’s not an attractive risk-reward, but at under ~7 bps or so that proposition changes – more so if the BTFP is no more.

Meanwhile, the futures market is forecasting rate cuts of over 200 basis points!

The Federal Reserve is a private enterprise that works with The Federal government like in the film “Prometheus” or “Chariots of the Clods.”

Sloppy Joe! Seven Charts Showing The Serious Problems With Bidenomics (Rising Interest Costs, 15% Lower Purchasing Power, Surging Shipping Costs, Etc)

Joe Biden can be called “Sloppy Joe” because of the economic havoc he has sprung on an unsuspecting middle class. The following seven charts are what keeps me up at night (unlike what keeps multimillionaire Michelle Obama up at nights).

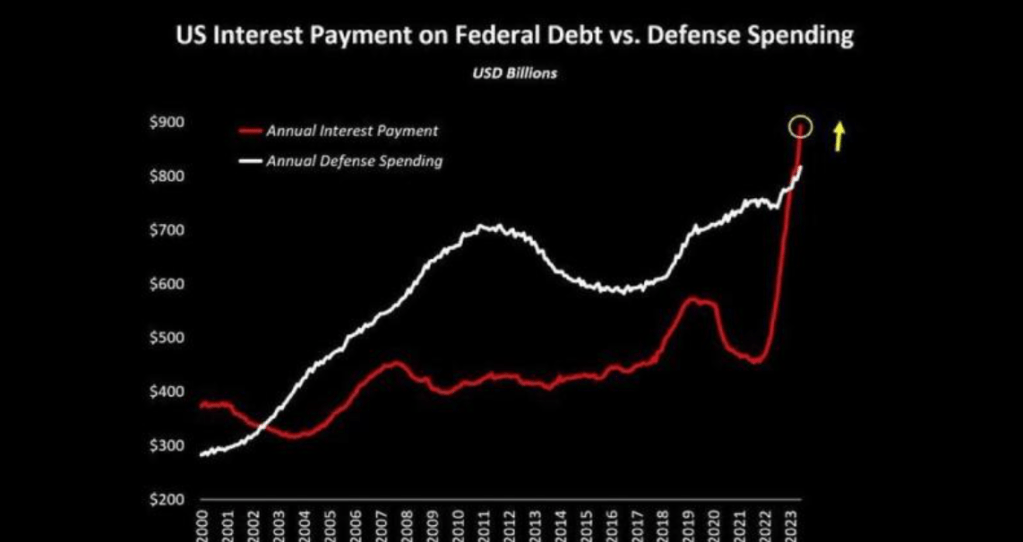
First, US interest payment on Federal debt is rising faster than our bloated military budget. Thanks mostly to The Fed raising rates to fight inflation under Biden.

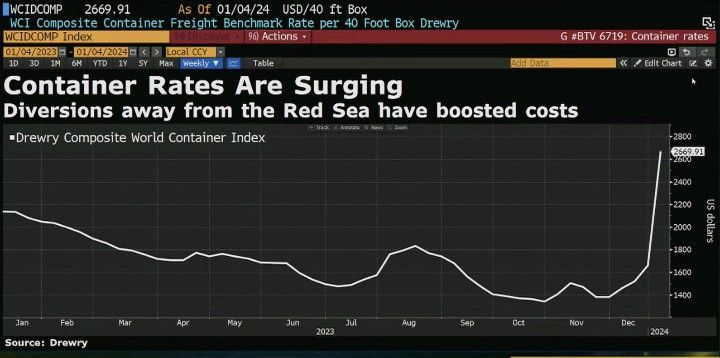
Second, contrainer shipping rates are soaring thanks to Iran’s interference in the Middle East and Biden’s failed diplomacy with Iran.

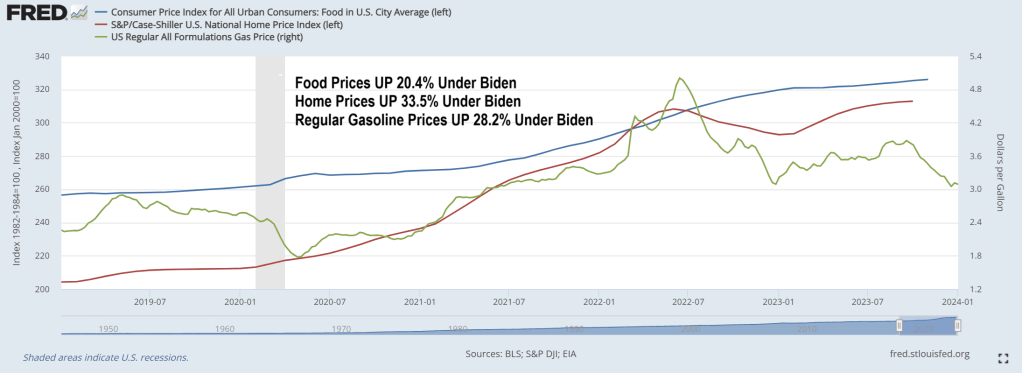
Third, food prices are over 20% more expensive under Biden while gasoline prices are over 28% more expensive under Biden. Housing is also more expensive under “Sloppy Joe” as in 33.5% more expensive.

Fourth, Bidenomics is about adding more non-productive government jobs.

Fifth, Department of Homeland Insecurity Secretary Alejandro “Cuba Pete” Mayorkas just admitted that 85% of illegal border crossers are released into the general public. I was stunned by this revelation. I just assumed that Mayorkas waived EVERYONE through. Frankly, I think Mayorkas meant he stopped 85 migrants out of the millions who has crossed the border under Sloppy Joe.

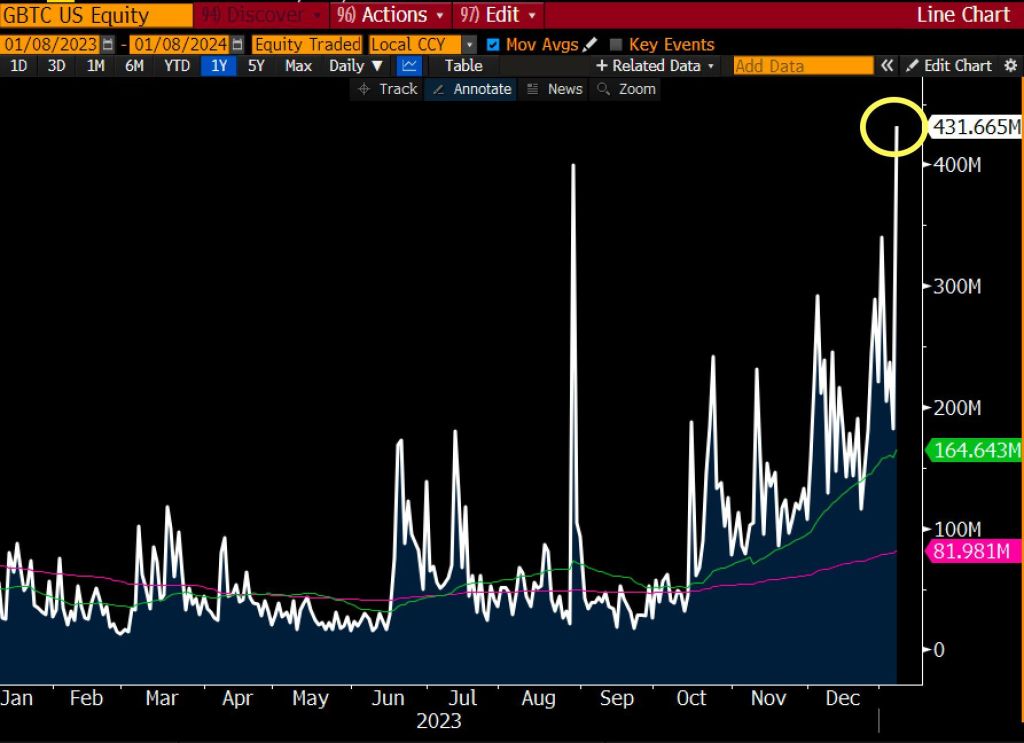
Sixth, Grayscale Bitcoin Trust $GBTC traded close to half a billion on Monday. Which shows the lack of confidence in Biden’s handling of the economy.

Seventh, purchasing power of the US Dollar is down 15% under Sloppy Joe.

While some may view Biden’s policies are planned destruction of the US economy, it could simply be that Biden (who is one of the stupidest people in Washington DC) simply is grossly incompetent and … sloppy.

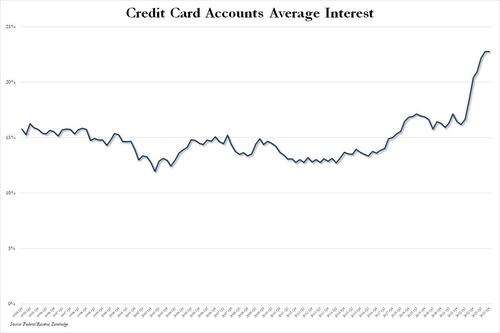
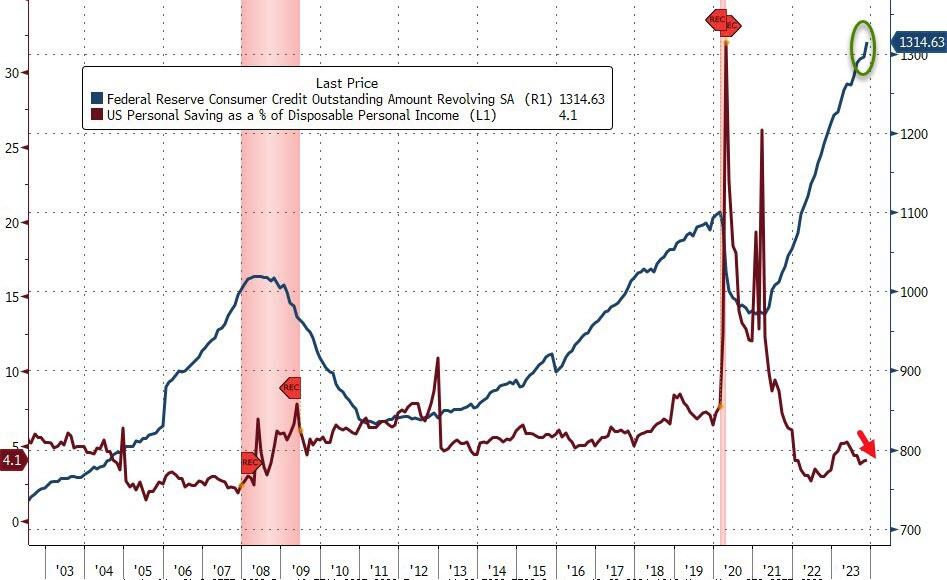
Bidenomics In The Underworld! Inflation Causing Consumer Credit Debt To Soar After Second Biggest Surge In Credit Card Debt On Record As Food And Gasoline Prices Soar > 20% Under Biden (Credit Card Rates At 22.75%)

Bidenomics has taken the US economy to the underworld. Where households have to run up credit cards to ridiculous levels to cope with inflation under Bidenomics. Under Bidenomics, food prices are up 20.4%, home prices are up 33.5% and regular gasoline prices are up 28.2%. Whip out those credit cards!!!!!

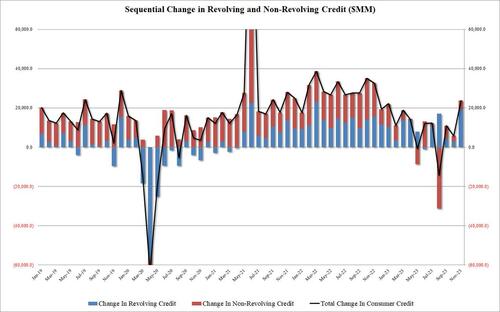
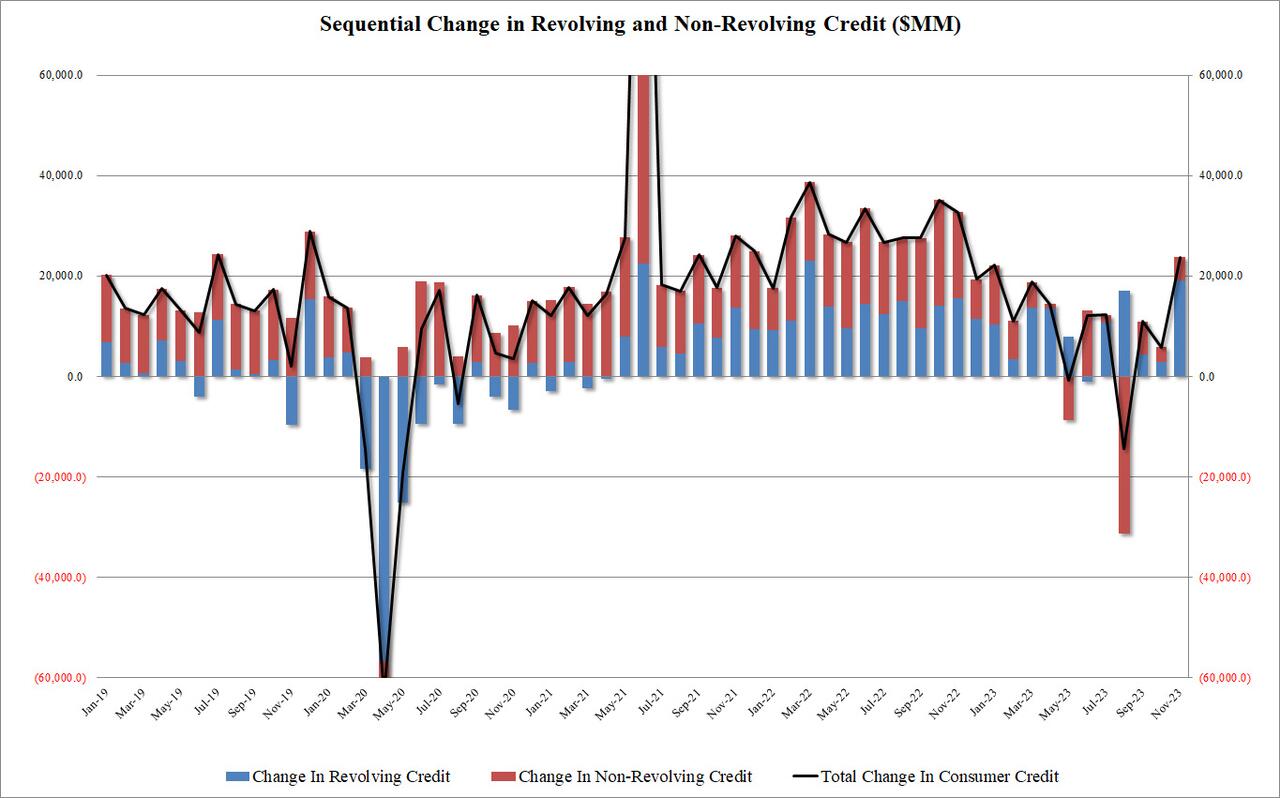
According to the latest monthly consumer credit report from the Fed, in November, consumer credit exploded higher by $24.75BN, blowing away expectations of a “modest” $9BN increase after the surprisingly subdued $5.8BN (upward revised from $.5.1BN) in October and the $4.3BN average of the past 6 months. This was the biggest monthly increase since last November, and was the first $20BN+ print since Jan 2023.

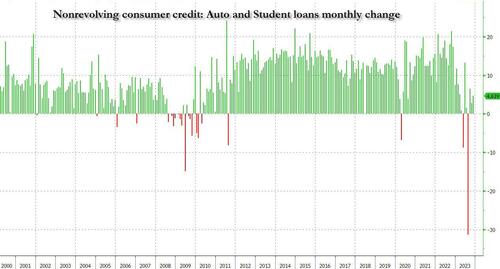
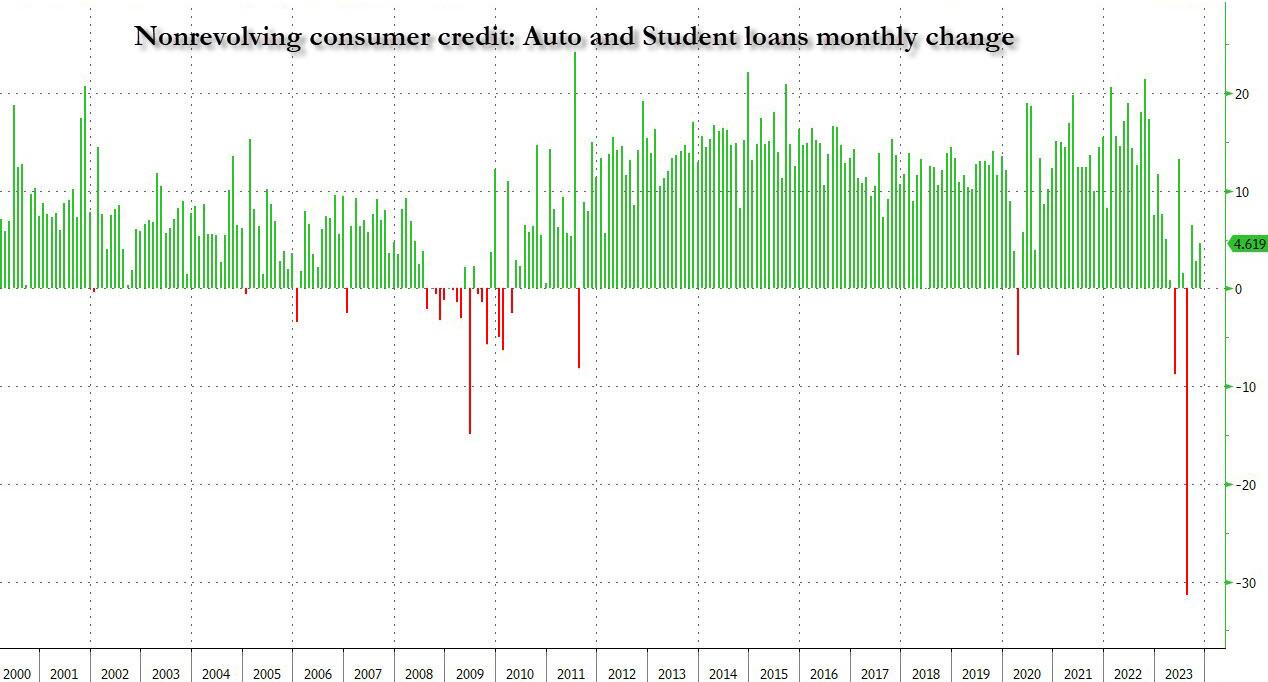
When looking into the details we find something remarkable: while non-revolving credit rose a modest $4.6BN…

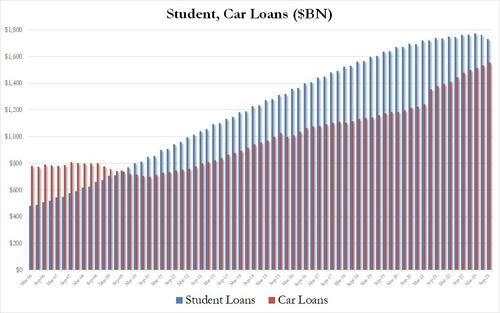
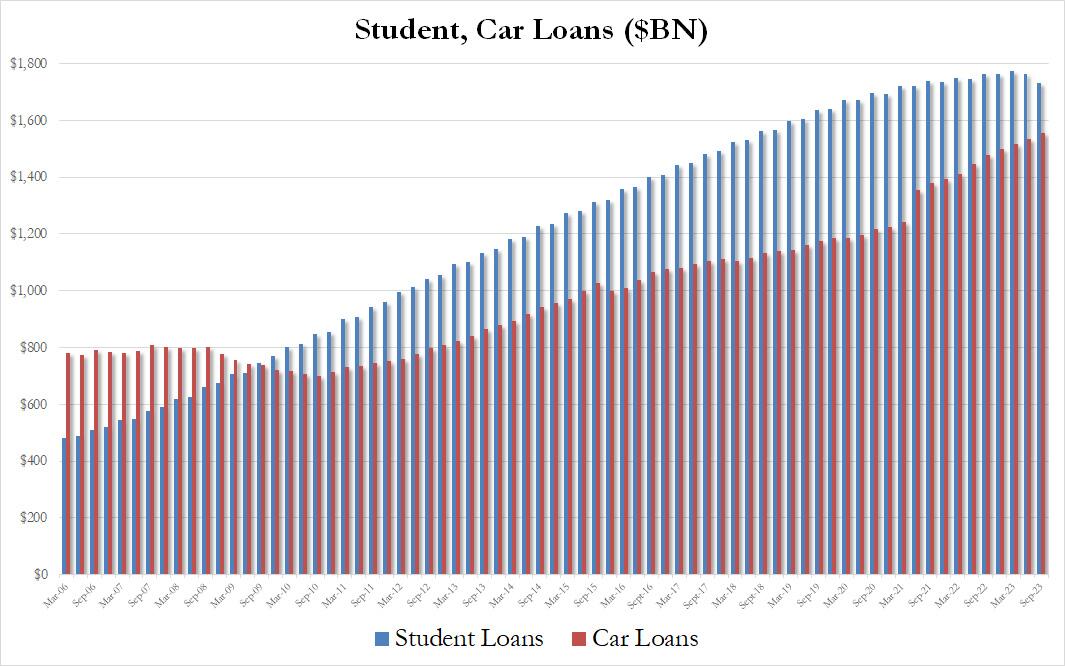
… in keeping with the subdued increase in recent months as rates on auto loans make them prohibitive for most consumers while student loans are actually shrinking for the 2nd quarter in a row…

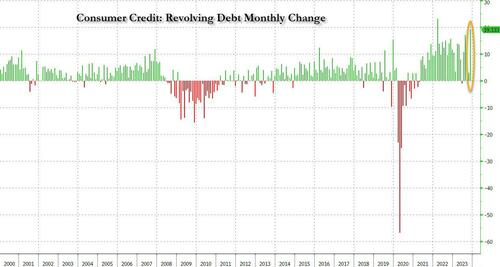
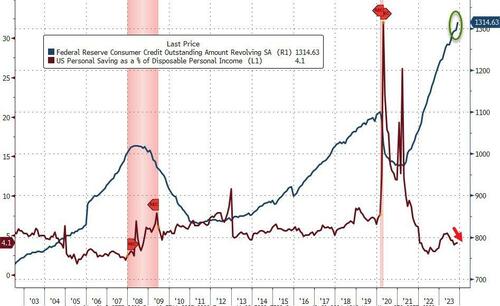
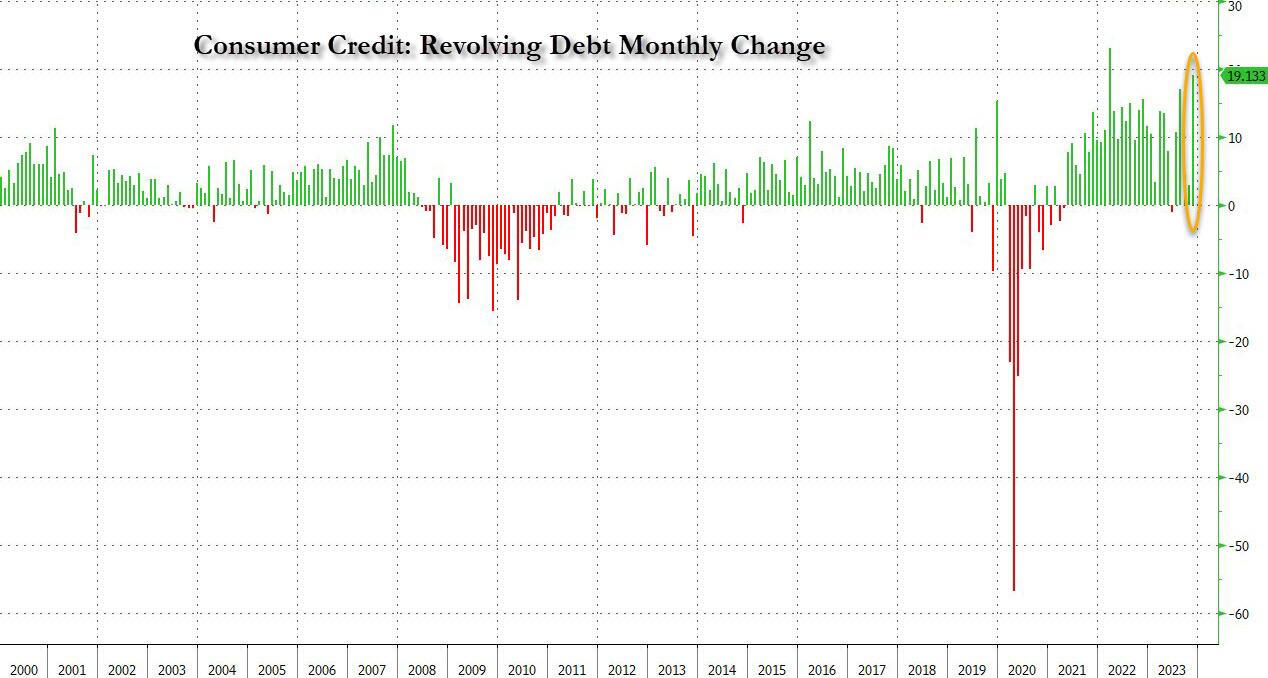
… what was the big shock in today’s data was the blowout surge in revolving credit, which in November exploded by a whopping $19.133BN, a record surge from the $2.9BN in October, and the second biggest monthly increase in credit card debt on record!

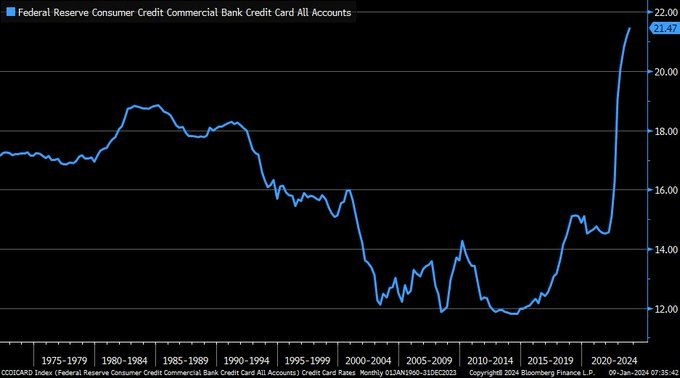
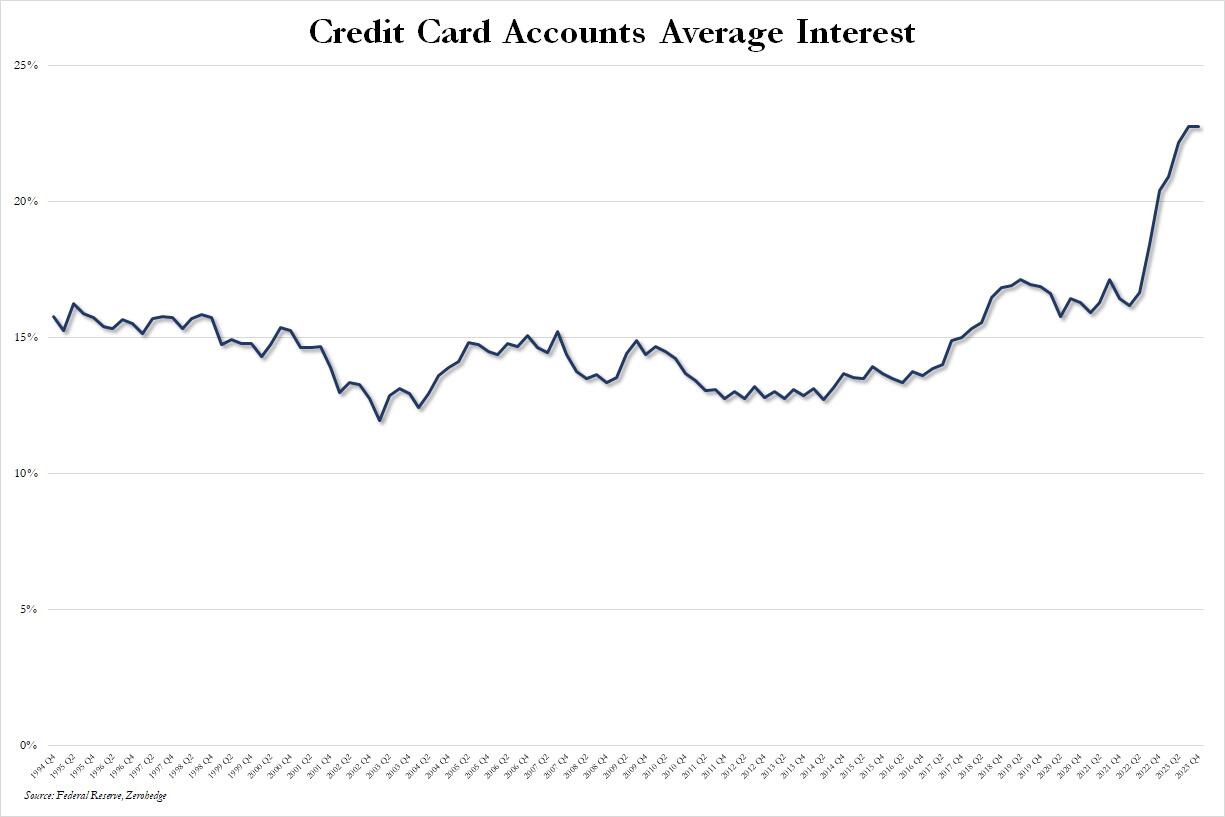
This, despite the average interest rate on credit card accounts in Q4 flat at a record high 22.75% for the second quarter in a row.

What is especially surprising about this conirmation that the bulk of holiday spending was on credit  is that it takes place after several months of relative return to normaly, when consumers appeared increasingly reluctant to max out their credit cards due to record high rates, and at a time when the personal savings rate in the US has collapsed back near multi-decade lows in recent months.

Well, it now appears that Americans have once again done what they do so well: follow in the footsteps of their government and throw all caution to the wind, charging everything they can (and whatever they can’t put on installment plans which also hit a record late last year) including groceries, on their credit card, and praying for the best… or not even bothering to worry about what comes next.

In addition to massive debt to cope with Bidenomics, we now have Soylent Green.

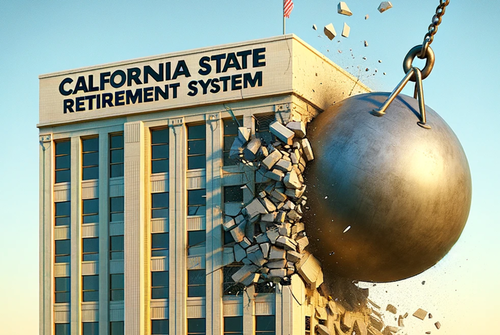
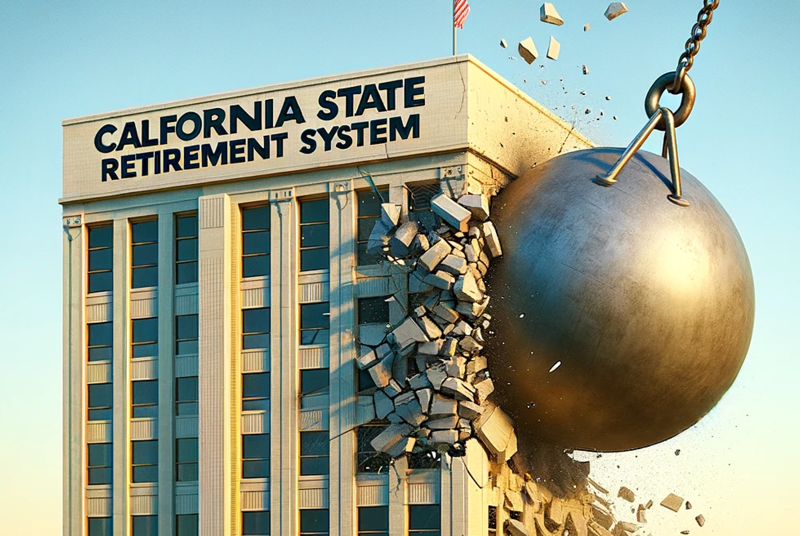
Pension Fund Inferno? Calstrs Seeks $30 Billion In Leverage Amid CRE Turmoil (RE Makes Up 17% Of Calstrs Portfolio)

California is experiencing a pension inferno!

One of the biggest public pension plans in the US plans to borrow tens of billions of dollars to maintain liquidity instead of triggering a fire-sale of its assets. 

Bloomberg reports the roughly $318 billion California State Teachers’ Retirement System (CalSTRS) plans to borrow $30 billion, or about 10% of its portfolio, instead of raising funds through an asset sale that might trigger fire sales

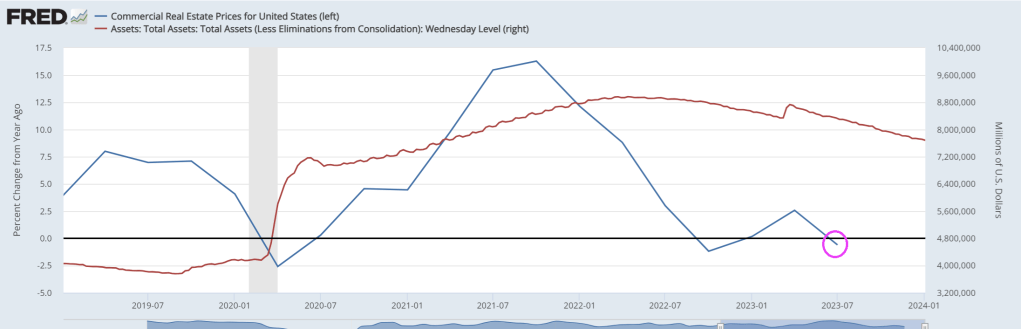
Borrowing to lever up its real estate-laden portfolio when CRE returns are negative??

Calstrs board members will review the first draft of the policy next Thursday. If approved, the leverage would be used “on a temporary basis to fulfill cash flow needs in circumstances when it is disadvantageous to sell assets,” a CalSTRS policy document stated. 

According to Calstrs consultant Meketa Investment Group, the public pension fund already deploys leverage upwards of 4% of its portfolio, adding the proposed increased leverage won’t be used for a new asset allocation policy but rather used to smooth cash flow and as an “intermittent tool” to manage the portfolio. 

The need to increase leverage comes after a report from the Financial Times last April explained that CalSTRS was planning to write down the value of its $52 billion commercial real estate portfolio after high interest rates crushed the values of office towers. 

At the time of the FT report, CalSTRS Chief Investment Officer Christopher Ailman told the media outlet that:

“Office real estate is probably down about 20 percent in value, just based on the rise of interest rates,” adding, “Our real estate consultants spoke to the board last month and said that they felt that real estate was going to have a negative year or two.”

For Calstrs, CRE was one of the best-performing asset classes until Covid and the Fed embarked on the most aggressive interest rate hiking cycle in a generation. Real estate had delivered double-digit returns over a 10-year period for its million-member plan, according to an update last March.

FT noted real estate makes up about 17% of Calstrs’ overall assets. 

We’re sure Calstrs is one of many pension plans under pressure from the CRE downturn. Also, regional banks have high exposure to CRE and are still not out of the woods.

Remember these “best minds in real estate.”