We have Federal Reserve of St Louis President James “Bully” Bullard saying that The Fed could raise rates by 75 basis points in May, the Japanese Yen to Dollar is crashing as mortgage rates continue to soar.
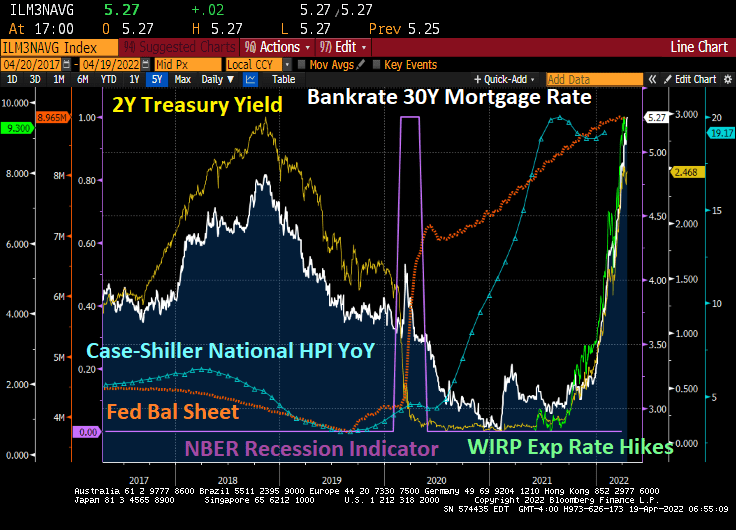
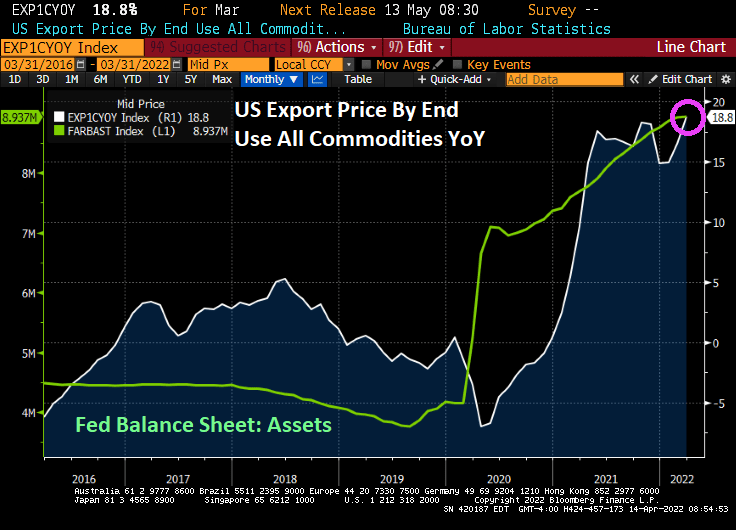
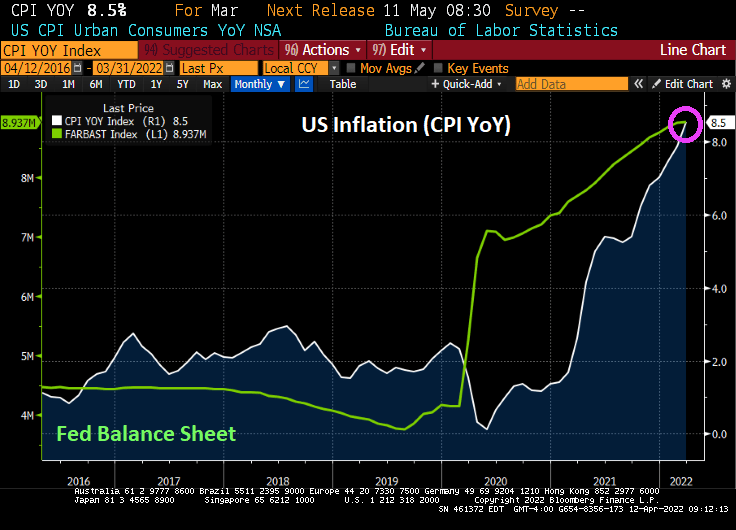
Here is a nice summary of The Fed’s massive balance sheet expansion in reaction to Covid (orange line) and the resulting soaring of home prices. Then The Fed signals that they will remove the “punchbowl” and mortgage rates have boomed. And not in a good day.
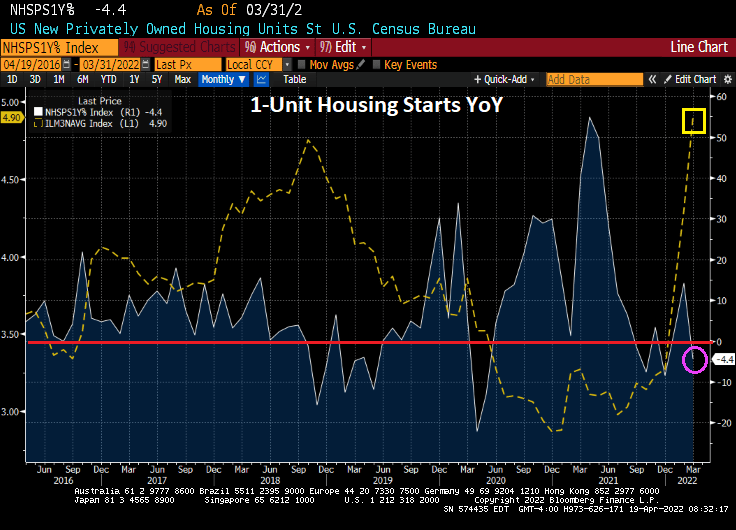
Today we have the US housing starts report. In a nutshell, 1-unit housing starts (single-family detached) declined -4.4% YoY as mortgage rates skyrocket.
5+ unit (aka, apartment stats rose 7.49% MoM in March while 1-unit starts declined by -1.72% MoM. 1-unit permits fell by -4.81% MoM while 5+ units starts rose by 10.89% MoM.
Soaring home prices coupled with soaring mortgage rates equals … apartment living.
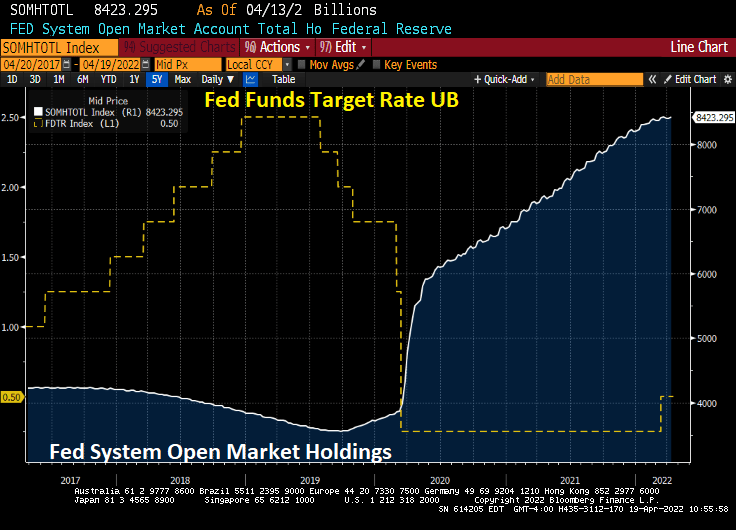
Bear in mind that The Fed STILL have massive monetary stimulypto outstanding!!
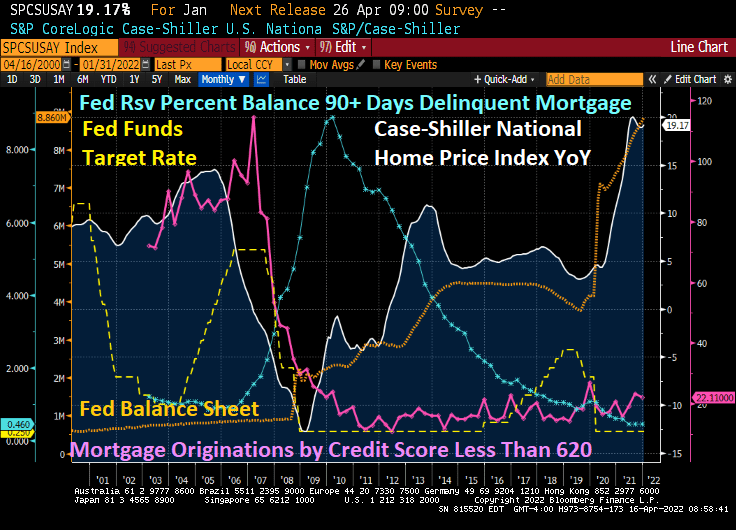
The book and movie “The Big Short” revolved around the 2005-2007 housing bubble driven by lending to borrowers with subprime credit (and little or no underwriting). As we know, Bear Stearns, Lehman Brothers and other investment banks too large positions in subprime asset-backed securities (SABS) that became highly toxic once the demand for high-yield subprime ABS dried up. The decline in US home prices coupled with soaring 90-day mortgage delinquencies led to the failure of Bear Stearns and Lehman Brothers along with Fannie Mae and Freddie Mac being put into conservatorship by their regulator.
Fast forward to today. Mortgage originations by credit scores of 620 or less have shriveled while home price growth YoY is even higher than the subprime mortgage crisis of 2005-2007. So, is the US facing another “Big Short” scenario? Yes and no.
The answer is no in that lenders have tightened their credit box sufficiently so that investment banks are no longer buying large quantities of subprime credit paper. The answer is yes if we consider that the current housing bubble is fueled by extraordinary monetary stimulus due to Covid (as well as rampant Federal government stimulus spending).
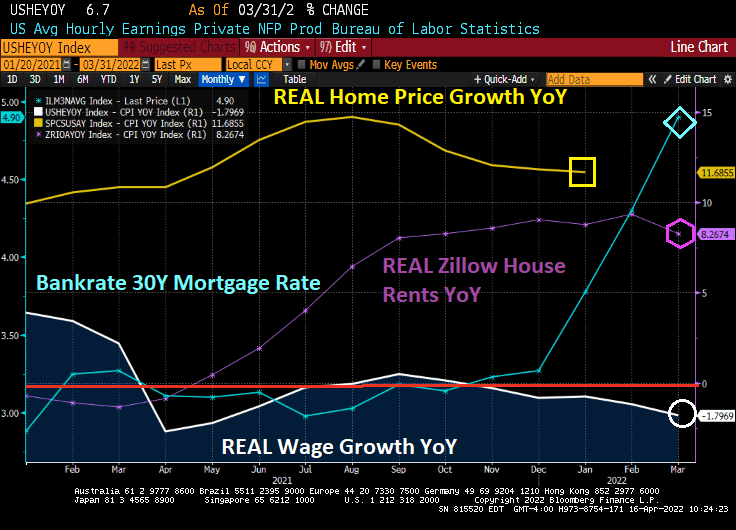
Following the Federal Reserve of Dallas’ lead, here is a chart of REAL home price growth YoY against REAL average hourly earnings YoY. I added REAL Zillow house rents YoY as well.
Look at the affordability gap during the Subprime Bubble of 2004-2006 and then the Fed Bubble of 2020 to today. Both bubbles show a disconnect between REAL home prices and REAL wages. REAL Zillow home rents are not as high as REAL home price growth, but still how a huge gap in rent affordability.
So, what can upset the apple cart? How about Jay and The Gang jacking up mortgage rates making home affordability even worse (unless it slows home price growth).
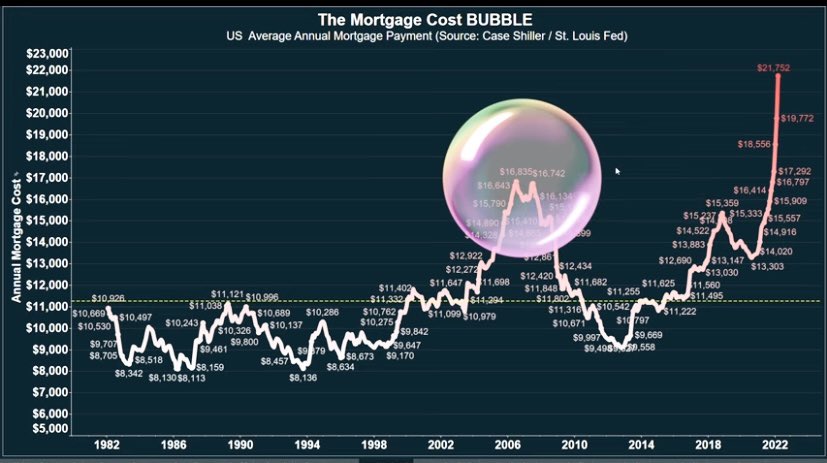
Thanks to The Fed’s propose quantitative tightening, mortgage rates are soaring and mortgage costs along with them. Mortgage costs, thanks to The Fed driving up housing prices AND mortgage rates, are substantially higher than during the subprime mortgage housing bubble.
The Fed’s whipsaw approach helped crash home prices during the subprime mortgage crisis by dropping rates too fast at first (helping to ignite a housing bubble) then raising rates too fast (helping to crash housing prices).
WASHINGTON (AP) — Long-term U.S. mortgage rates continued to climb this week as the key 30-year loan rate reached 5% for the first time in more than a decade amid persistent high inflation.
The average 5% rate on the 30-year mortgage was up from 4.72% last week, mortgage buyer Freddie Mac reported Thursday. The average rates in recent months have been showing the fastest pace of increases since 1994. By contrast, a year ago the 30-year rate stood at 3.04%.
The average rate on 15-year, fixed-rate mortgages, popular among those refinancing their homes, jumped to 4.17% from 3.91% last week.
Yet The Federal Reserve’s balance sheet keeps on growing.
Today, the US Treasury 10-year yield exploded upwards by over 12 basis points. With it, the 30-year mortgage yield is above 5%. And MBA Mortgage Purchase Applications are actually increasing.
Export prices by end us YoY is up to 18.8%, the highest in recorded history (or since 1983 when they started recording export prices).
Import prices by end use rose to 12.5% YoY.
Unrelated to US export and import prices, the MBA’s mortgage credit availability index slumped with the Covid outbreak and the explosion of The Fed’s Balance Sheet. As I have said before, nothing has been the same since Covid.
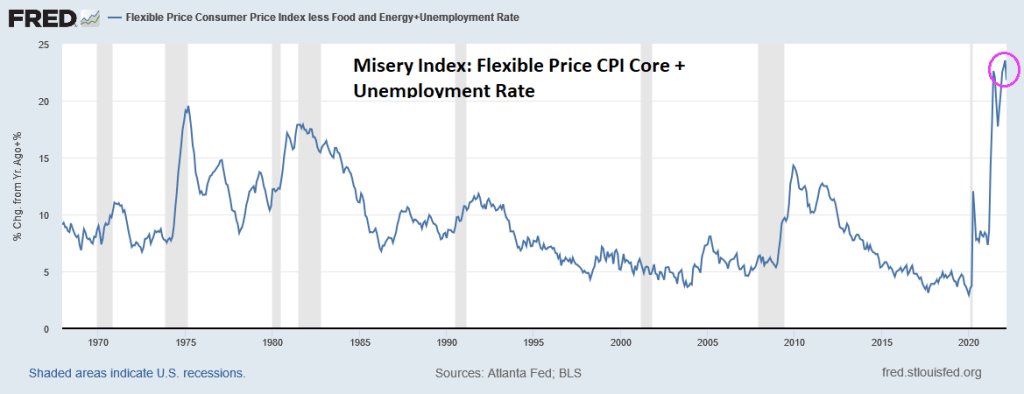
The Federal Reserve’s two goals of price stability and maximum sustainable employment are known collectively as the “dual mandate.” Unfortunately, inflation is running away (bad) from employment gains (good). Sort of like “The Good, The Bad and The Ugly.” But just the Good and The Ugly combine to create the Misery Index.
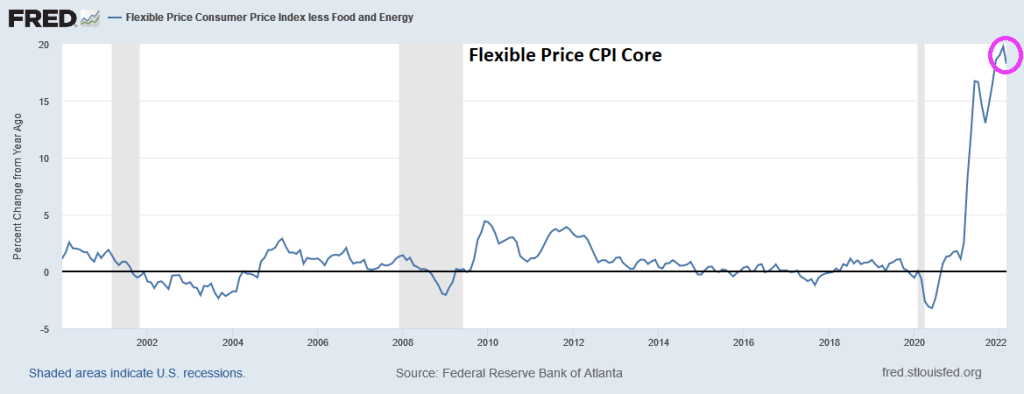
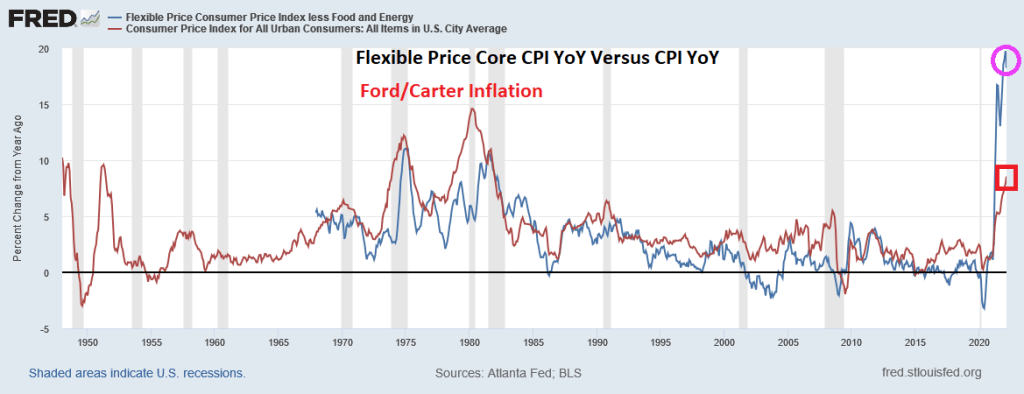
Here is the Atlanta Fed’s CORE flexible CPI YoY for March. The good news? Flexible Core CPI YoY was a little lower than the historic high reading in February. The bad news? We are still talking about 21.82%+ rise in prices (down from 23.56% in February).
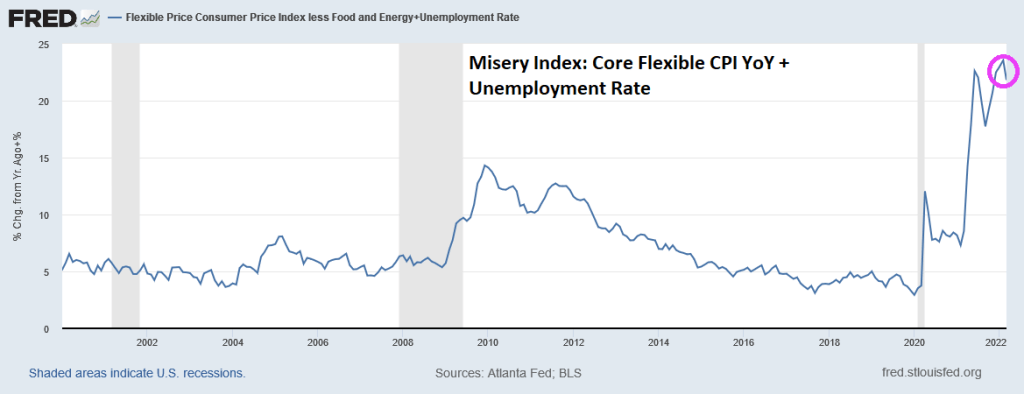
If I use the Atlanta Fed’s flexible consumer price CORE index combined with the U-3 unemployment rate, we see that March’s inflation report plus U-3 unemployment is generating a misery index that was last seen in July 2008 during The Great Recession. Unless we consider the July 2021 reading of 31.3%, so we have seen two horrible misery index readings under Biden.
If we look at the Misery Index since 1967, we now have the GOAT (Greatest of All-time) Misery.
Now, inflation under Presidents Ford and Carter (red line) were higher than the flexible core price index (blue line) in the 1970s and 1980. But flexible core price CPI YoY is substantially higher than March’s CPI growth of 8.5%.
The bottom line is that inflation losses are far outweighing the employment gains, resulting in elevated misery.
US real average weekly earnings growth YoY is down to -3.60%. That is the lowest since 2007 and is worse than The Great Recession and financial crisis of 2008.
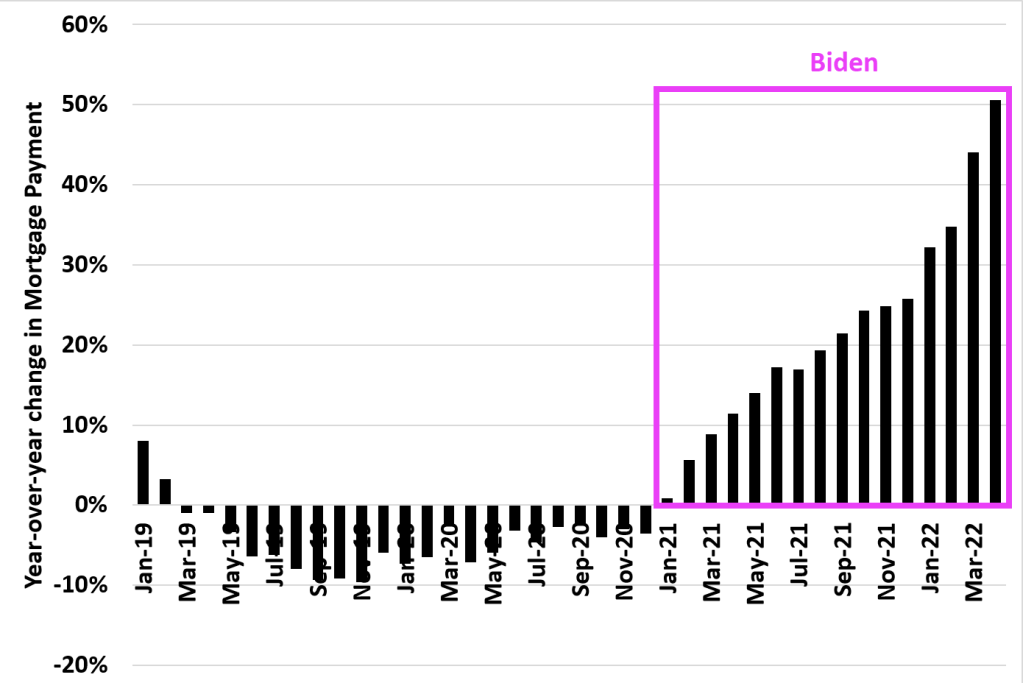
And look at this chart of mortgage payments under Biden. The US was actually experiencing DECLINING mortgage payments YoY in 2019 and 2020. But under Biden’s leadership, mortgage payments have increased by 50% making housing even MORE unaffordable for the middle class and lower-income households.
And now for something kind of scary. The US today suffered a 12 basis point decline in the 2-year Treasury yield, generally a bad sign for the economy. As if we needed more bad news for today.
Highest inflation in 40 years, worst wage growth since 2007 and rising mortgage payments. We will need all the luck we can get.
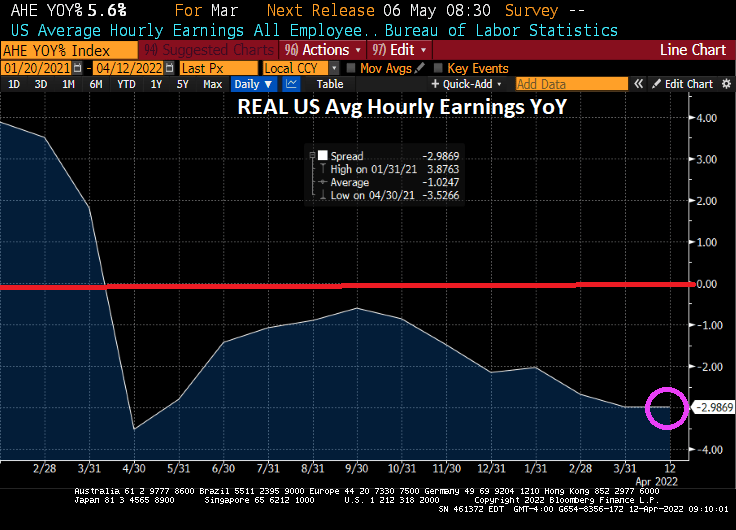
With 8.5% YoY inflation, REAL average hourly earnings growth fell to -3% YoY.
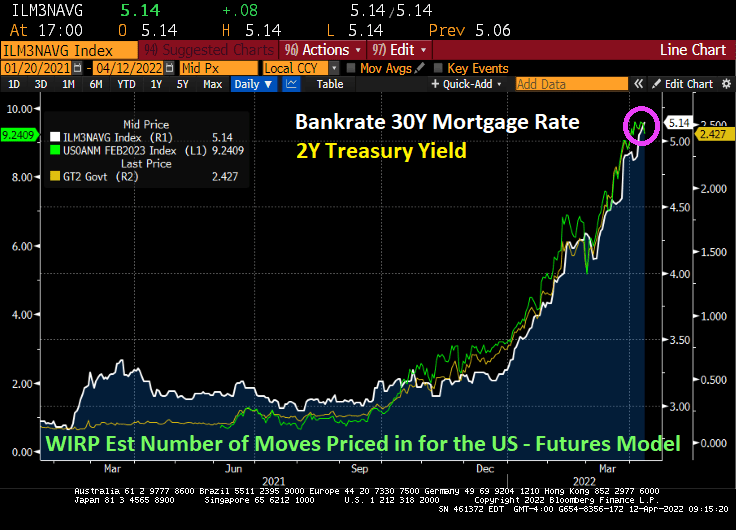
And with The Fed intent on extinguishing their part of the inflation, Bankrate’s 30Y mortgage rate rose to 5.14%.
Energy is the biggest culprit (fuel oil up 70.1% YoY) thanks to the double whammy of 1) Russia’s invasion of Ukraine and 2) Biden’s restrictions on oil and natural gas production. Food at home is up 10% YoY.
Here is a colorful chart of MoM growth in prices.
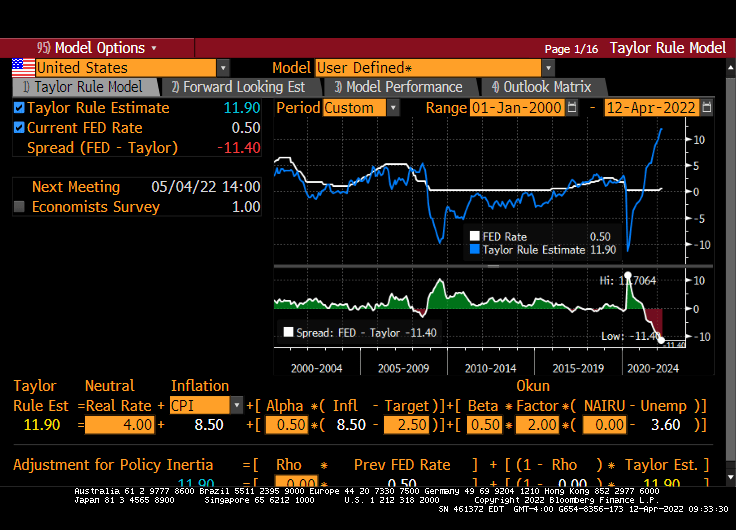
The Taylor Rule model now says that The Fed Funds Target Rate should be 11.90%. Hence, Fed Stimulypto is still in place with the signal that rates will increase.
How about WTI Crude and Brent Crude soaring over 4% today?
Once again, the Four Horsemen of the Inflation Apocalypse (Biden, Powell, Pelosi, Schumer) overstimulated the economy and financial markets with excessive monetary stimulus (Powell) and excessive Federal spending (Biden, Pelosi, Schumer) where demand soared for products and supply naturally hasn’t caught up.
As we are painfully aware, The Fed’s exaggerated monetary flood combined with Federal stimulus spending has led to horrible inflation.
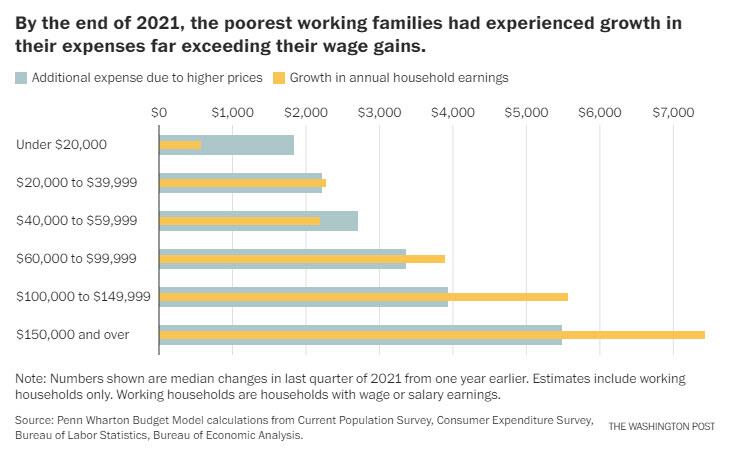
Yes, despite what government talking heads say, Federal stimulus increases demand for goods, the supply is generally slow to respond resulting in rising prices. Then government policies driving up energy prices also leads to highers prices. Throw in Federal Reserve monetary stimulypto and we have this chart from hell from Penn-Wharton. The chart shows that households earning less that $60,000 experience higher expenses due to rising prices than their gain in earnings.
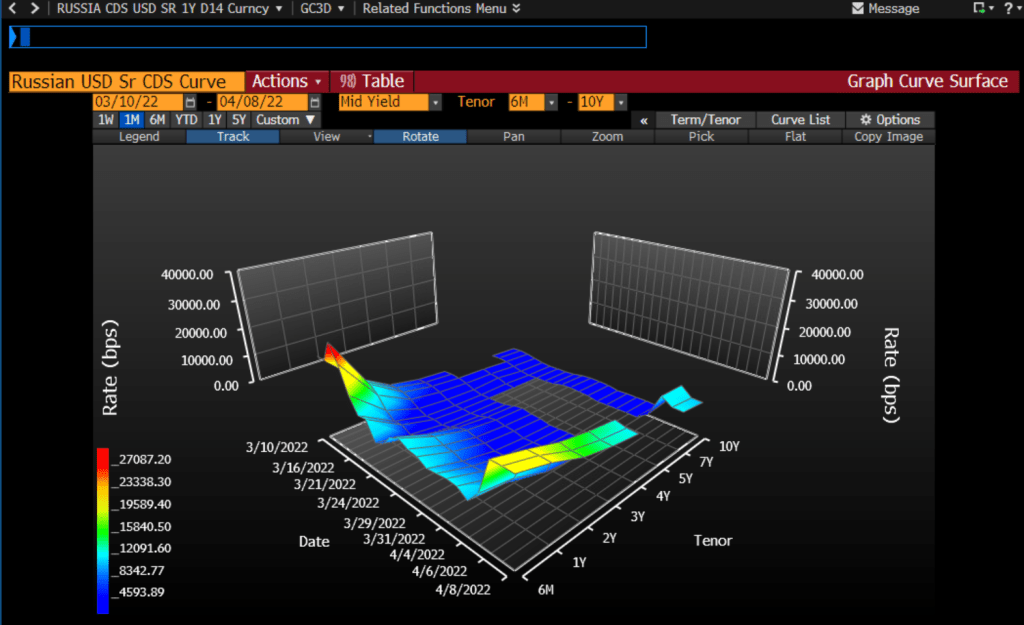
Another chart from hell is the Russian USD Credit Default Swap (CDS) curve. It is spiking at over 20,000.
The one-year Russian CDS is currently at a whopping 20,336 indicating that there is about a 99% of a Russian default over the coming year. As someone who lived through the 1998 Russian credit default scare on Wall Street, this will send a shock wave through credit and Treasury markets.
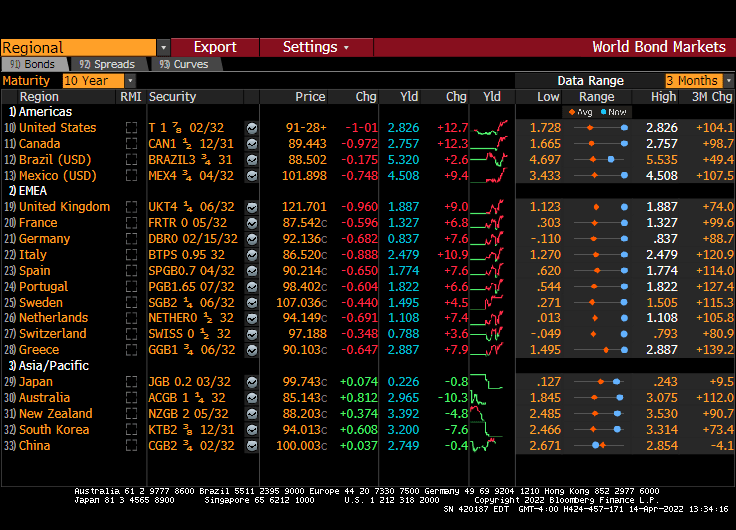
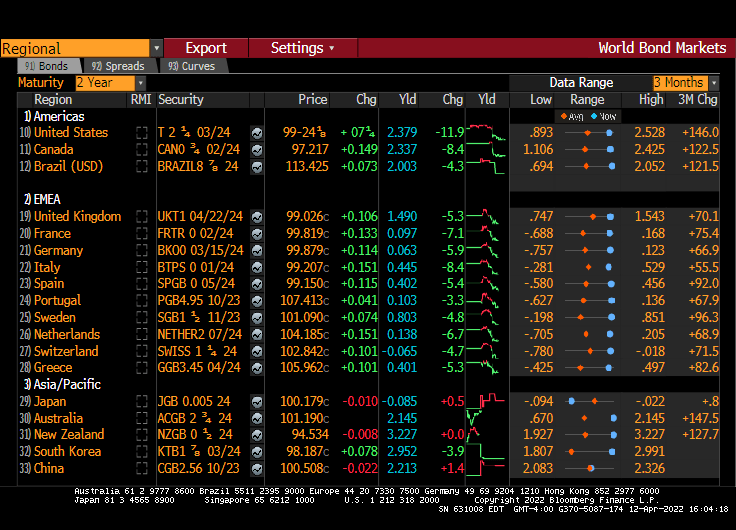
On the US Treasury front, this chart shows how steeply sloped the US Treasury actives curve has become. Steep until 3 years, then flat. I call this chart “T-Dazzle!” T-Dazzle because I can’t believe how badly the Biden Administration and The Federal Reserve are screwing up the country.
Crude oil? WTI Crude is back to almost $100 per barrel while Brent Crude is at $102.78 per barrel. Wheat is up 3.22% thanks largely to problems related to Russia invading Ukraine (Europe’s bread basket) and a dismal Chinese wheat harvest.
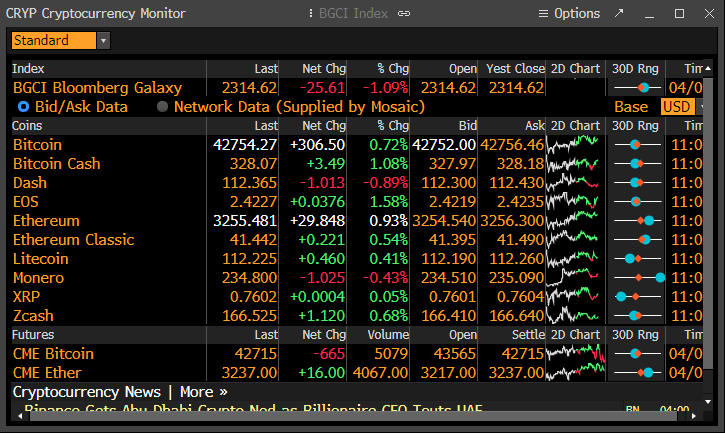
Cryptocurrencies, the alternatives to the US fiat dollar, are rising (in particular, Bitcoin and Ethereum).
Of course, I have to finish up with the soaring 30-year mortgage rate.
As the US Treasury 2-year yield hits 2.507% (up from 0.128% when Biden was installed as President) and the number of Fed rate hikes over by February 2023 hits 9.6, Bankrate’s 30-year mortgage rate breached the 5% mark at 5.04%.
The most recent data from on existing home sales show YoY sales in negative territory as The Fed begins in monetary fireball tightening.
St Louis Fed’s Bullard said The Fed is “behind the curve.” Ya think??
The Fed’s minutes from the most recent meeting indicates that The Fed will shedding $95 billion a month from it swollen balance sheet. At almost $9 trillion mostly populated by Treasuries will be the first asset to run-off the balance sheet (there is almost $1 trillion of Treasuries maturing in 2022 and $856 billion maturity in 2023, etc), The Fed plans to shrink the balance sheet while, at the same, raising The Fed Funds target rate from it near zero levels.
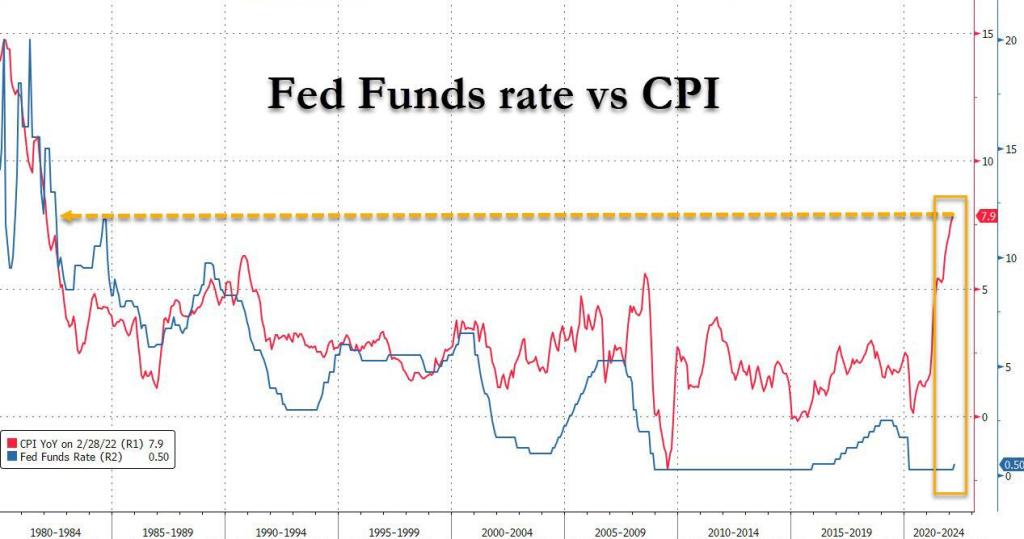
The Federal Reserve has ignoring rules like the Taylor Rule since the financial crisis of 2008-2009, but seemingly are paying attention to the Taylor Rule because of 7.9% inflation. The Taylor Rule is suggesting a 20.42% Fed Funds target while the current target rate is 0.50%. Now THAT would be a real shock to the economy.


You must be logged in to post a comment.