Well, it looks like Ukraine’s army is surrending in droves to Russian forces. Maybe this will end Biden’s obsession with doling billions of dollars to Ukraine. Nah, Biden will continue doling out billions to Ukraine, but this time it will be to rebuild Ukraine (while major US cities continue to rot). But in any case, Biden and Democrats refused to return to pre-Covid levels of spending.
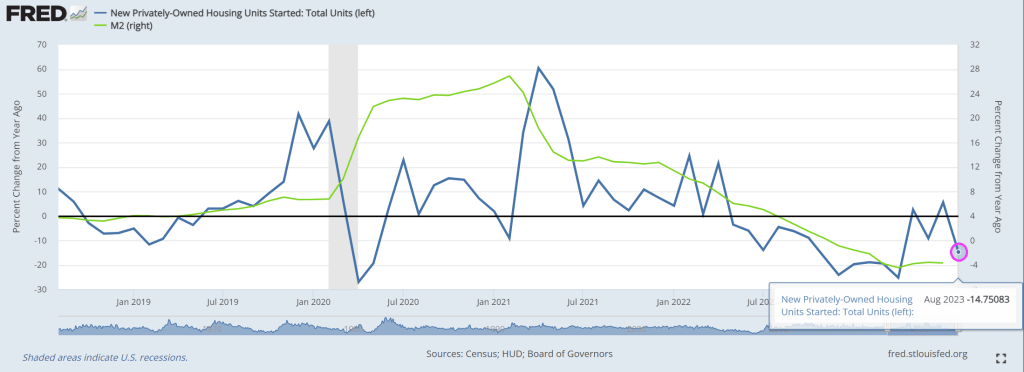
Federal outlays (spending) has increased by 30% from January 2020, just prior to Covid. Yet, Republicans are unable (or unwilling) to get the Biden Administration and Democrats to cut Federal spending back to pre-Covid spending levels. M2 Money is up a whopping 36%.
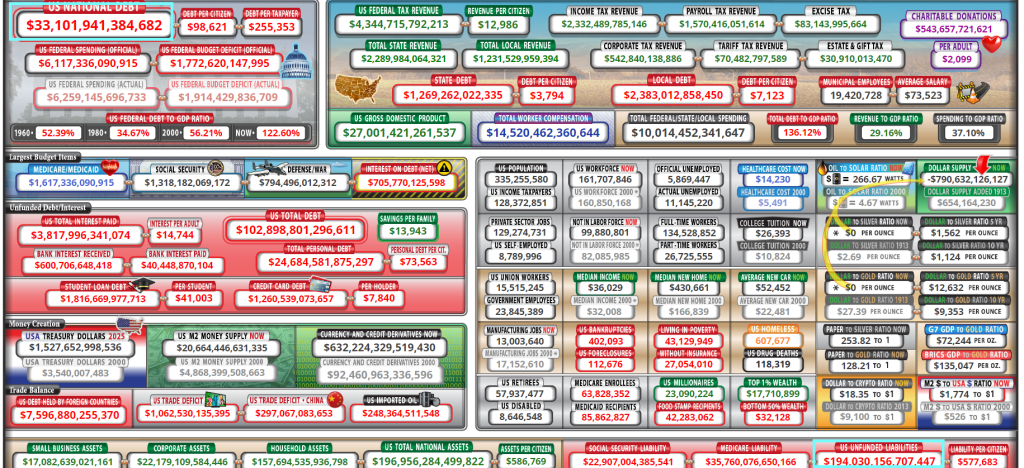
But never fear. US Federal debt is now above $33 trillion with $194+ TRILLION in unfunded liabilities. I feel dread after California governor “Gruesome” Newsom appointed The Fonz (a Democrat millionaire living in Maryland?) to replace Diane Feintstein in the US Senate.
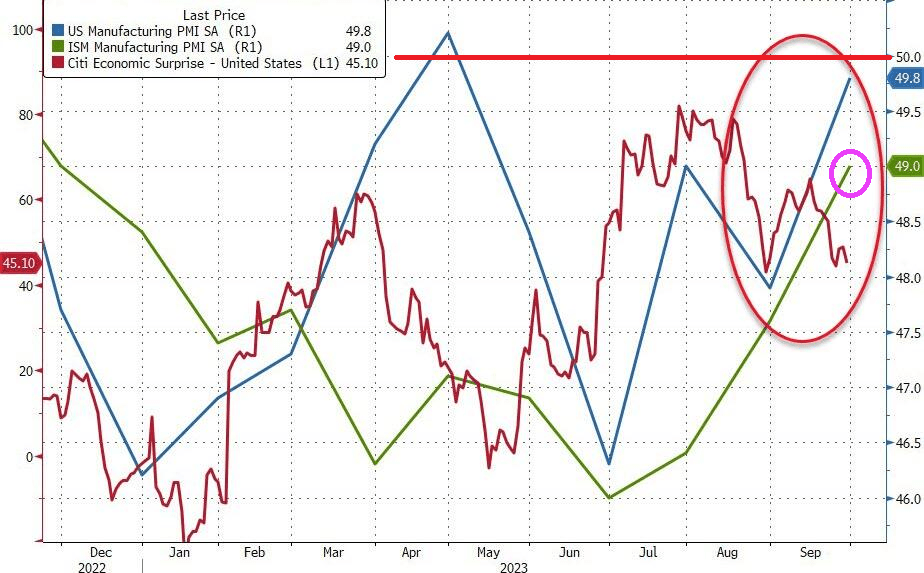
S&P Global’s PMI Manufacturing jumped from 47.9 in August to 49.8 in September (and up from 48.9 in the flash September print). That is the highest print for US manufacturing since April but remains in contraction (below 5). That is the 5th straight month in contraction and 10th month in the last 11 in contraction (sub 50).
The ISM Manufacturing print also rose (to 49.0), up from 47.6 and better than the 47.9 exp (but still below 50 for the 10th straight month).
No, not Henry Winkler. But Laphonza Butler, a friend of VP Kamala Harris and the CEO of Emily’s List. And lauughably a resident of Maryland representing California.
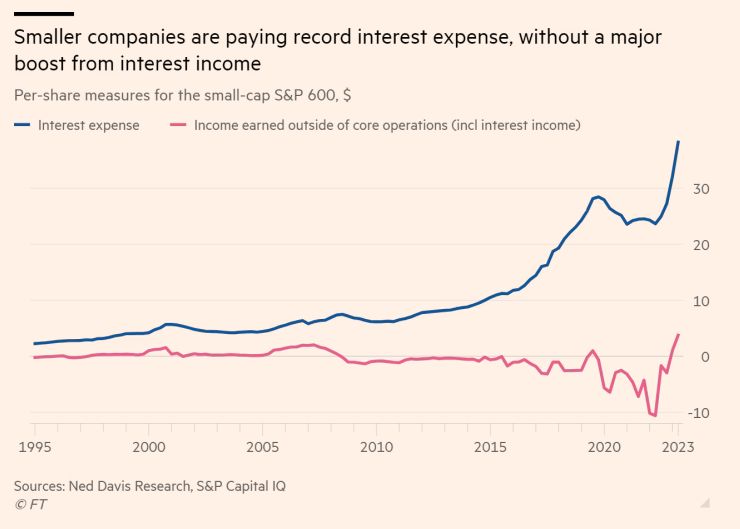
We know that the horribly-flawed Bidenomics doesn’t work, unless you are a large corporate donor in green energy. For the rest, particulary small companies, Bidenomics is a total bust.
Under Bidenomics (the Soviet-style command economy), small companies are paying reconrd interest expense WITHOUT a major boost from interest income. Well, ain’t that a kick in the head … to most companies.
Pension funds that invested in “safe” MBS are finding that MBS isn’t so safe under inflation.
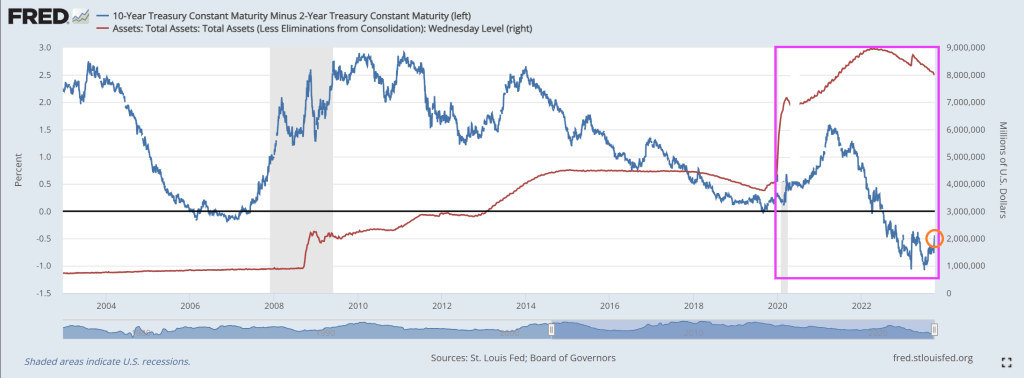
Look at the 10Y-2Y yield curve since Covid. I had a slight surge by March 2021, then has flattened then inverted as The Fed’s balance sheet still remains above $8 trillion.
Face it. The Biden Administration and Congress are owned by BIG corporate interests. BIG defense, BIG tech. BIG Pharma, BIG banking, BIG auto, BIG Union, BIG anything.
No wonder the Obamas were seen snorkeling in The Med with Tom Hanks and Steven Spielberg. BIG Hollywood!
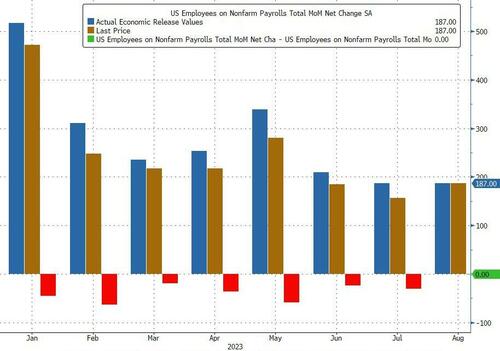
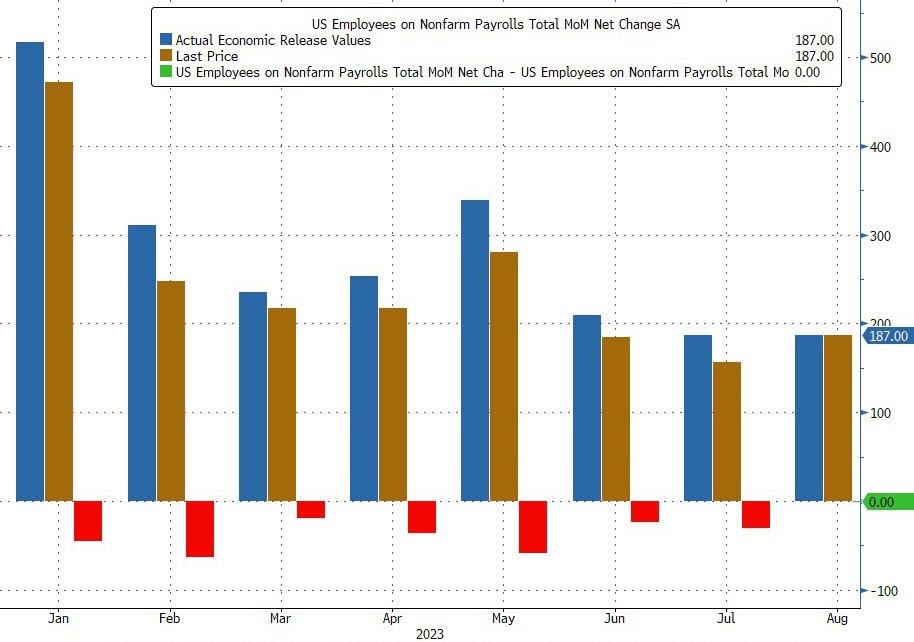
That has certainly been the case with US labor data, where as we first reported last month, every single monthly payrolls print in 2023 has been revised lower (see chart below), a 12-sigma probability and virtually impossible unless there was political pressure to massage the data higher initially and then revise it lower when nobody is looking.
But the BLS is not done: as we reported last week, besides the now traditional one-month lookback revisions the ridiculously high monthly payrolls prints accumulated over the past year will also be slowly but surely revised gradually lower at annual benchmark revisions for years to come. As Morgan Stanley chief US economist Ellen Zentner explained (full note available to pro subscribers)…
Payrolls get revised too, and we expect a downward revision. Payrolls have an annual benchmark revision that is published in February each year. The revision adjusts the level of payrolls through March of the prior year. For example, a new revision will be published in Feb-24, adjusting payroll levels from April-22 to Mar-23. And a preliminary estimation of the upcoming revision points to a decrease in payroll YoY% growth rates of -0.2pp.
But while downward payroll revisions under Bidenomics are as certain as death and taxes, what we wanted to discuss here are the just as striking downward revisions to US consumption which hit this morning alongside the comprehensive once every-five-years historical revisions to GDP. As a reminder:
Today’s release presents results from the comprehensive update of the National Economic Accounts (NEAs), which include the National Income and Product Accounts (NIPAs) and the Industry Economic Accounts (IEAs). The update includes revised statistics for GDP, GDP by industry, GDI, and their major components. Current-dollar measures of GDP and related components are revised from the first quarter of 2013 through the first quarter of 2023. GDI and selected income components are revised from the first quarter of 1979 through the first quarter of 2023.
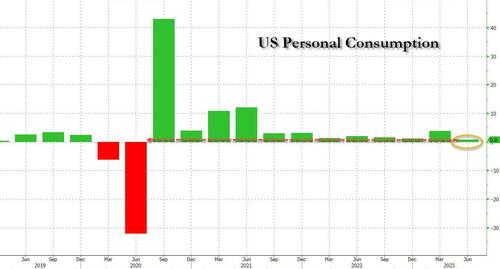
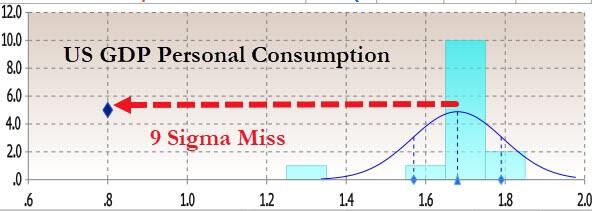
Earlier today we already noted the disaster that was Q2 Personal Consumption: instead of the 1.7% unchanged print from the second estimate of Q2 GDP, the final number was a dire 0.8%, a 9-sigma miss to estimates…
… and the worst quarterly increase since the Covid collapse in Q2 2020.
But what about other historical data? After all today’s revision impacted all data from Q1 2013? Therein, as the bard says, lies the rub.
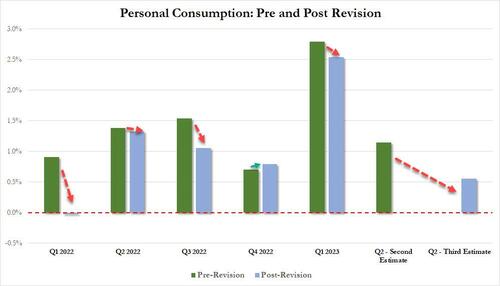
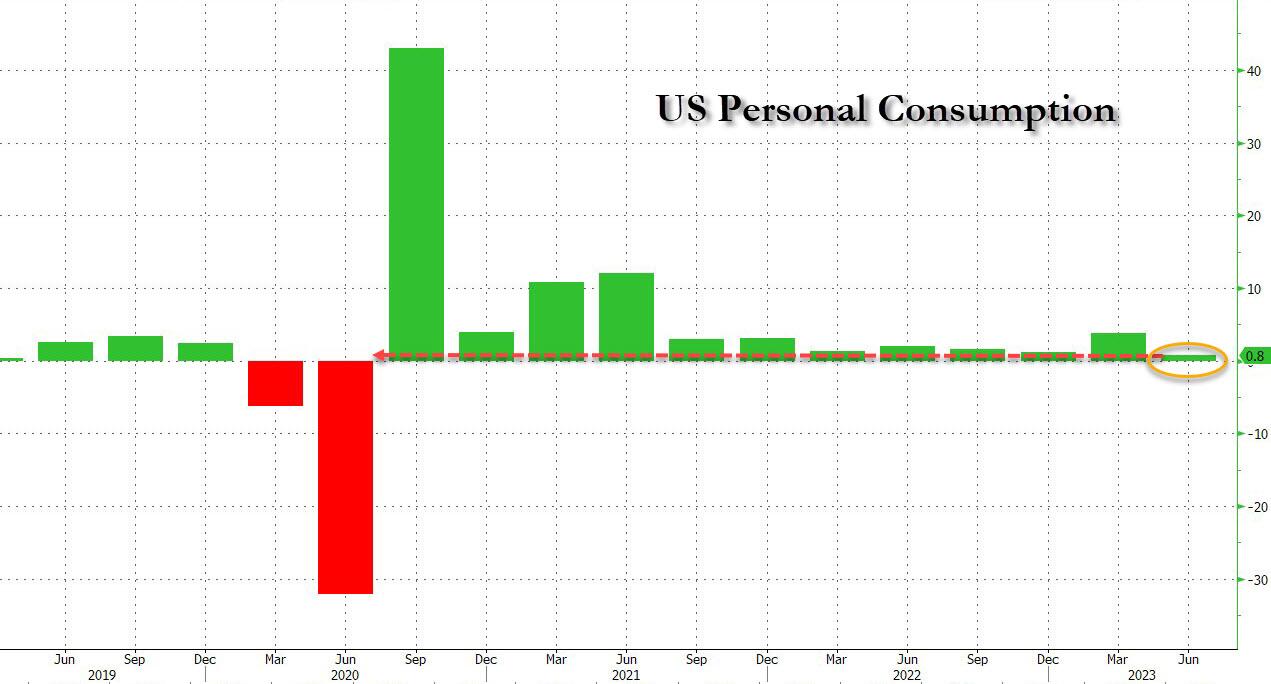
Let’s start with personal consumption, and compare the latest post-revision current data (link) with the most comprehensive pre-revision data as of last month (link). It should come as no surprise to anyone that with the (slight) exception of just Q4 2022, personal consumption in every single quarter since the start of 2022 – when the Fed aggressively started tightening and hiked rates by the most since Volcker – has been revised lower, and in some cases dramatically so.
Bloomberg also picks up on the GDP revision and looking at revisions to the historical data, writes that “the pandemic contraction is seen as being a bit less severe than previously thought: GDP is now reckoned to have dropped at a 28% annual clip in the second quarter of 2020, instead by 29.9%, as the government shut down swathes of the economy to fight the spread of the virus. But the recovery since then has been somewhat slower, according to the update. Growth last year was revised to 1.9% from 2.1%.” And of all GDP components, consumption was the weakest.
So not only was the Fed hiking at a time when personal consumption would grow much less period to period than previously expected, but the US economy was generally weaker than previously expected (as discussed here).
There’s more.
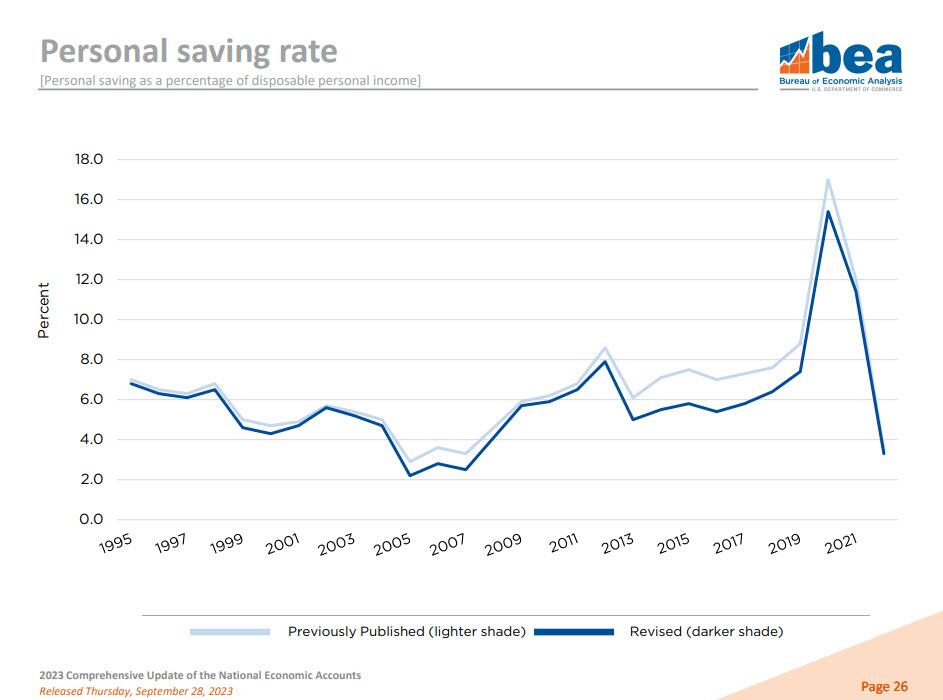
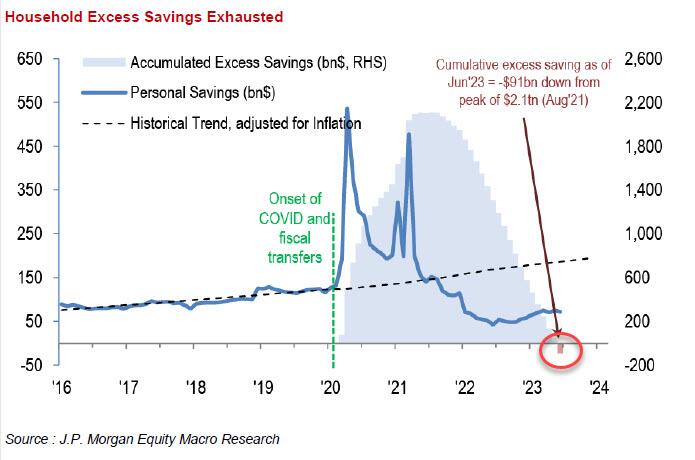
When looking at the composition of the US household’s income statement – the summary of economic accounts – we find just what we had expected: US savings were in fact far lower than previously expected.
… and indeed as the BEA chart below shows, Americans stashed away an average 8.3% of their disposable income annually from 2017 through 2022, down from a previously estimated 9.4%.
The reduction stems from an accounting adjustment that lowered personal income from mutual funds and real estate investment trusts. Additionally, as Bloomberg notes, much of the reduction in personal savings seen in the revised data occurred prior to the pandemic, so its implications for how much extra cash Americans may feel they still have now is not clear cut.
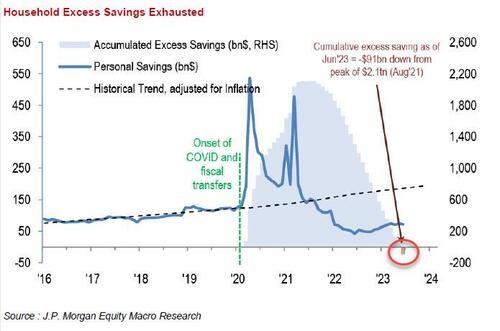
Whatever the reason for the statistical adjustment, however, one can say goodbye to even the faintest speculation that US households have any excess savings left… why they don’t, of course, because even when using the previous methodology which artificially inflated total savings, JPM calculated that excess savings had already run out…
… which means that if Q3 GDP was bad and consumption was “revised” sharply lower (odd how economic data is never revised higher under Joe BIden), Q4 – when savings are virtually non-existant – and where we also get the i) return of student loan payments; ii) the UAW strike; iii) the government shutdown and iv) oil at almost $100 and gasoline at one year highs, is about to fall off a cliff.
Yes, Bidenomics is a form of Brawdo, the economic mutilator!
With existing home sales at their lowest since 2010 and new home sales finally hitting the wall, pending home sales were expected to decline MoM in August after an uptick in July (amid soaring mortgage rates and plunging affordability) and they did…hugely.
Pending home sales plunged 7.1% MoM in August (dramatically worse than the -1.0% expected) dragging sales down 18.8% YoY.
Mortgage rates are now at a 20 year high. As existing home sales tank.
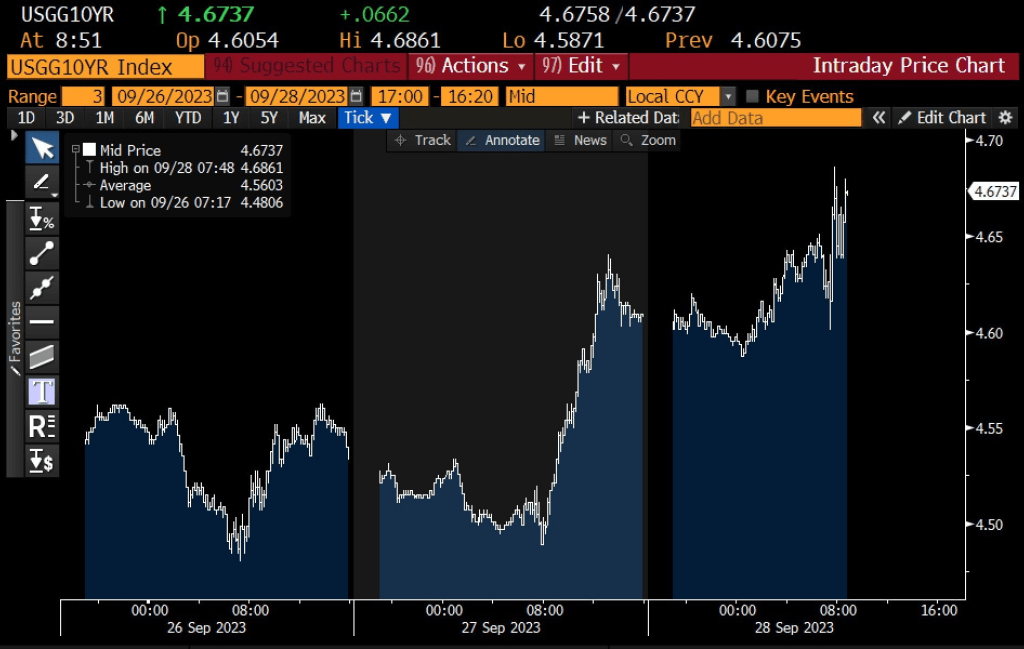
Alarm! US 10-year Treasury yields are soaring along with mortgage rates.
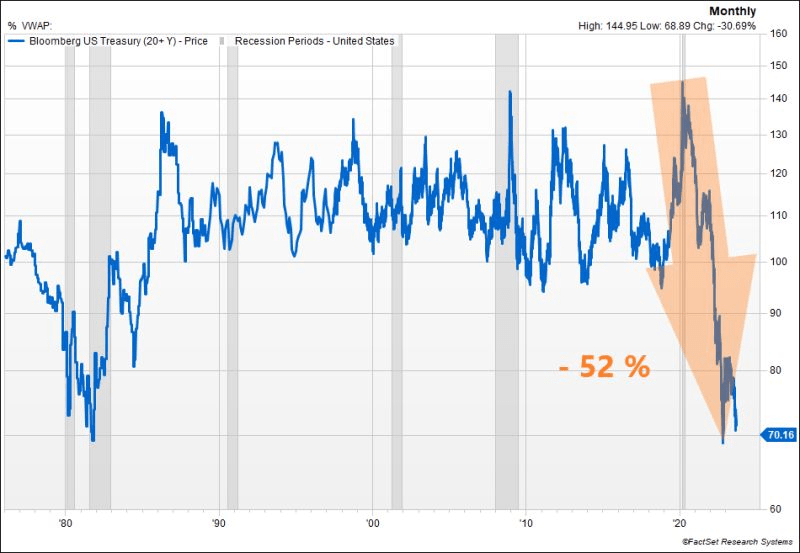
The US Treasury market is witnessing another significant selloff, pushing the 10y UST yield close to the 4.50% mark. The surge in real rates is remarkable, reaching 2.12% for the 10y, a level not seen since 08’. While this might appear attractive in real terms compared to historical benchmarks, could we be on the brink of a third consecutive year of negative performance for US Treasuries? To put this into perspective, such a scenario has never occurred in history.
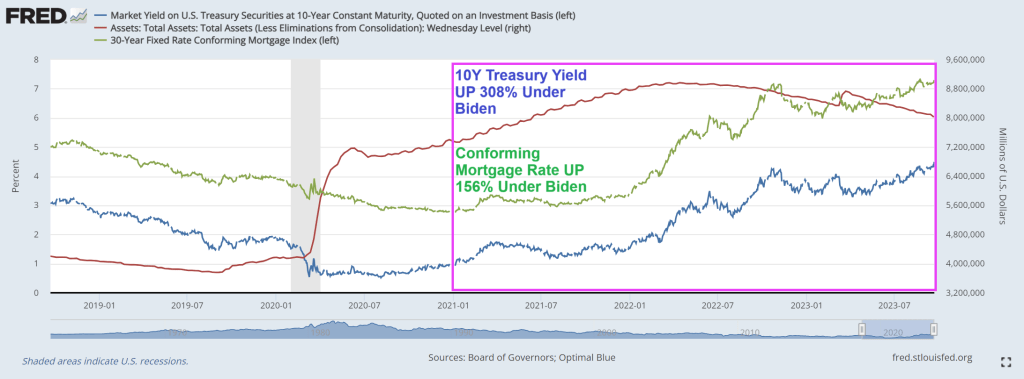
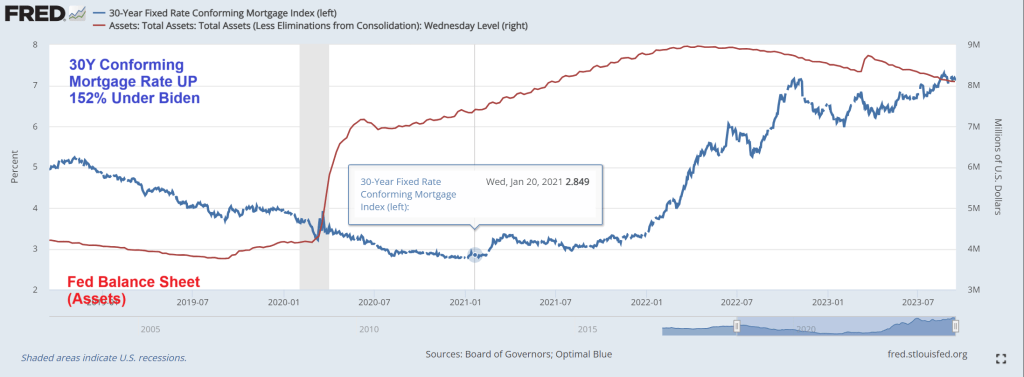
The conforming mortgage rate is at 7.3%, up 156% under since Biden’s coronation as El Presidente of the United Banana Republics of America. Where political opponents are indicted prior to elections.
In Biden’s Banana Republic economy, the US Treasury 10y-2y yield curve remains inverted.
And then we have Mish’s chart on debt as a percentage of GDP from CBO. Remember, we used to worry about the US breaking the 80% debt to GDP level. It is now projected to be 181%. Wow.
The most recent report on US exisiting home sales showed that sales decreased in 17 of the last 19 months as The Fed tightens monetary policy to combat inflation caused by … 1) The Fed and 2) Bidenomics spending on green energy.
The US housing market will be “back in black” once Biden and Congress stop their reckless spending and borrowing. Biden has added $5,352,202 to the national debt since being selected (not by me!). That is a 19% increase in The Federal debt in just 33 months!
Not to mention the ludicrous $194 TRILLION in unfunded liabilities that the geezers in the Biden Administration (Biden is 80 and slipping into dementia) and the Geriatric wing of Congress (the US Senate) is home to fossils like Mitch McConnell (not looking well) and Diane Feinstein (90 and looking poorly). I didn’t forget about Nancy Pelosi (Communist-California) who is 83 and running for re-election. Younger doesn’t necessarily mean better since Pelosi’s nephew California governor Gavin Newsom is 55 years old and helped destroy California’s economy. Of course, the DNC will probably selected Newsom to replace scandal-ridden Biden as the Democrat in order to finish the job Obama started.
Existing-home sales slipped again in August as rising mortgage rates make housing prices the least affordable ever. Despite denials in many corners, a crash is underway.
Existing-home sales retreated 0.7% in August to a seasonally adjusted annual rate of 4.04 million.
Sales dropped 15.3% from one year ago.
The median existing-home sales price climbed 3.9% from one year ago to $407,100, an increase of 3.9% from August 2022 ($391,700). It’s the third consecutive month the median sales price surpassed $400,000.
The inventory of unsold existing homes dipped 0.9% from the prior month to 1.1 million at the end of August, or the equivalent of 3.3 months’ supply at the current monthly sales pace.
First-time buyers were responsible for 29% of sales in August, down from 30% in July and identical to August 2022.
All-cash sales accounted for 27% of transactions in August, up from 26% in July and 24% in August 2022.
And mortgage rates are now up to 23 year highs!
If Biden bows out and Newsom runs for President … and loses, Newsom always has a career in Hollywood in vampire movies. “I will suck your (economic) blood!” – Count Newsom.
Is The Fed pushin’ too hard on rates to fight inflation? Or not hard enough??
Between the data and the overnight momentum in overseas markets, bonds are at their weakest levels in years. Mortgage-backed securities (the bonds that dictate mortgage rates) didn’t swoon quite as much as Treasuries, but as of today, it was just enough to push the average mortgage lender almost perfectly back in line with the highest 30yr fixed rate of the past 23 years. [30 year fixed 7.47%]
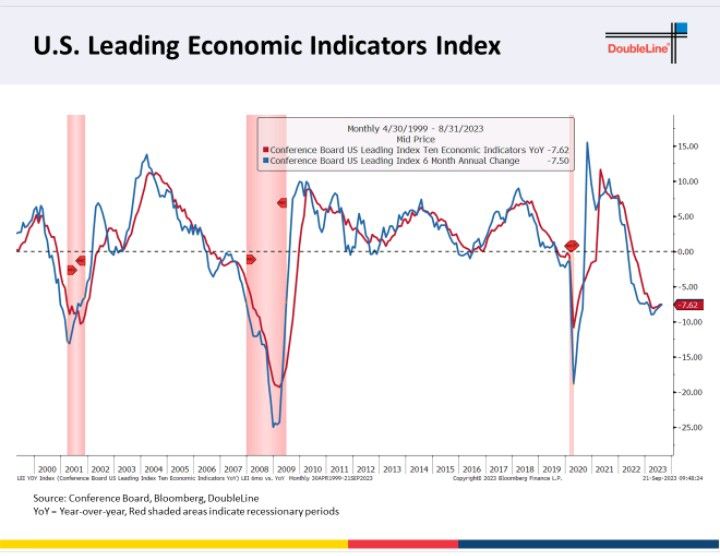
Conference Board Leading Economic Indicator declined -0.4%MoM in August, bringing the year-over-year change to -7.6%.
The Fed can’t seem to make inflation go away, despite what Janet Yellen says. The reason? While The Fed’s target rate has risen rapidly over the past year and a half, The Fed’s Balance Sheet is slowwwwwllyyyyyyyyyyyyyy unwinding.
This isn’t Barbara Tuchman’s class novel about the horrors of World War I, but the ongoing horrors of Bidenomics with its guns pointed at the American middle class.
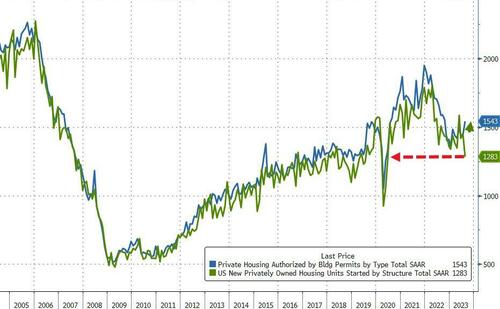
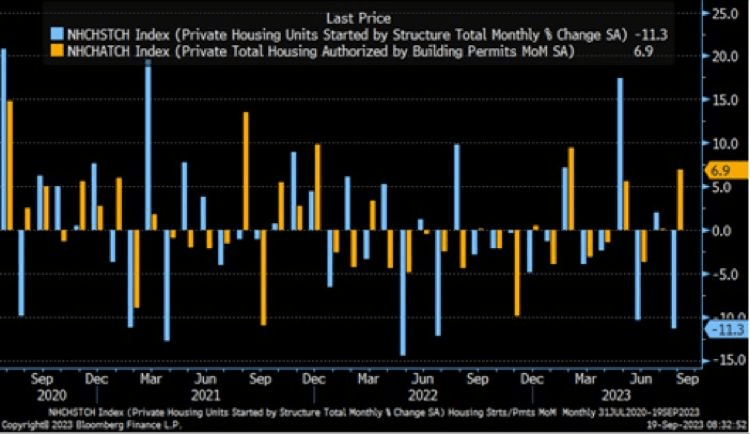
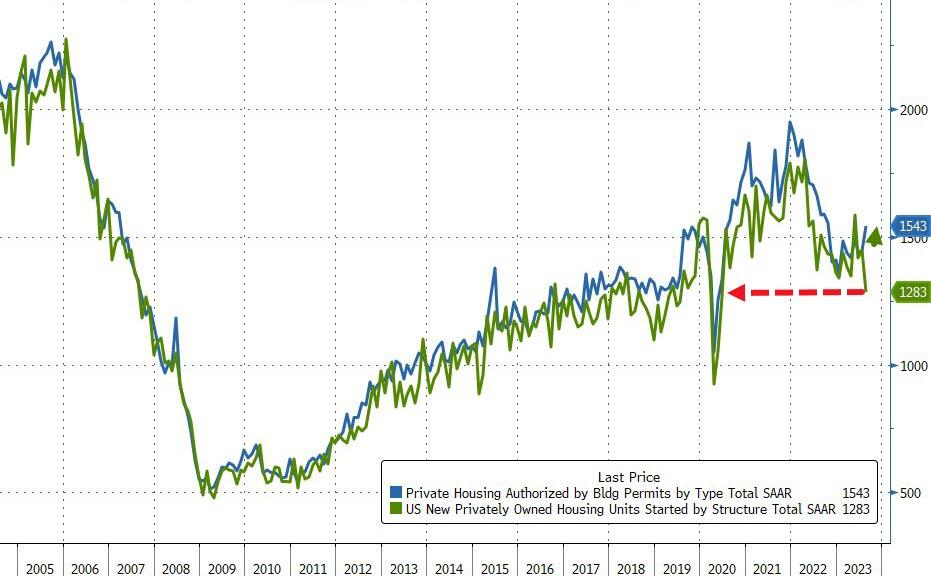
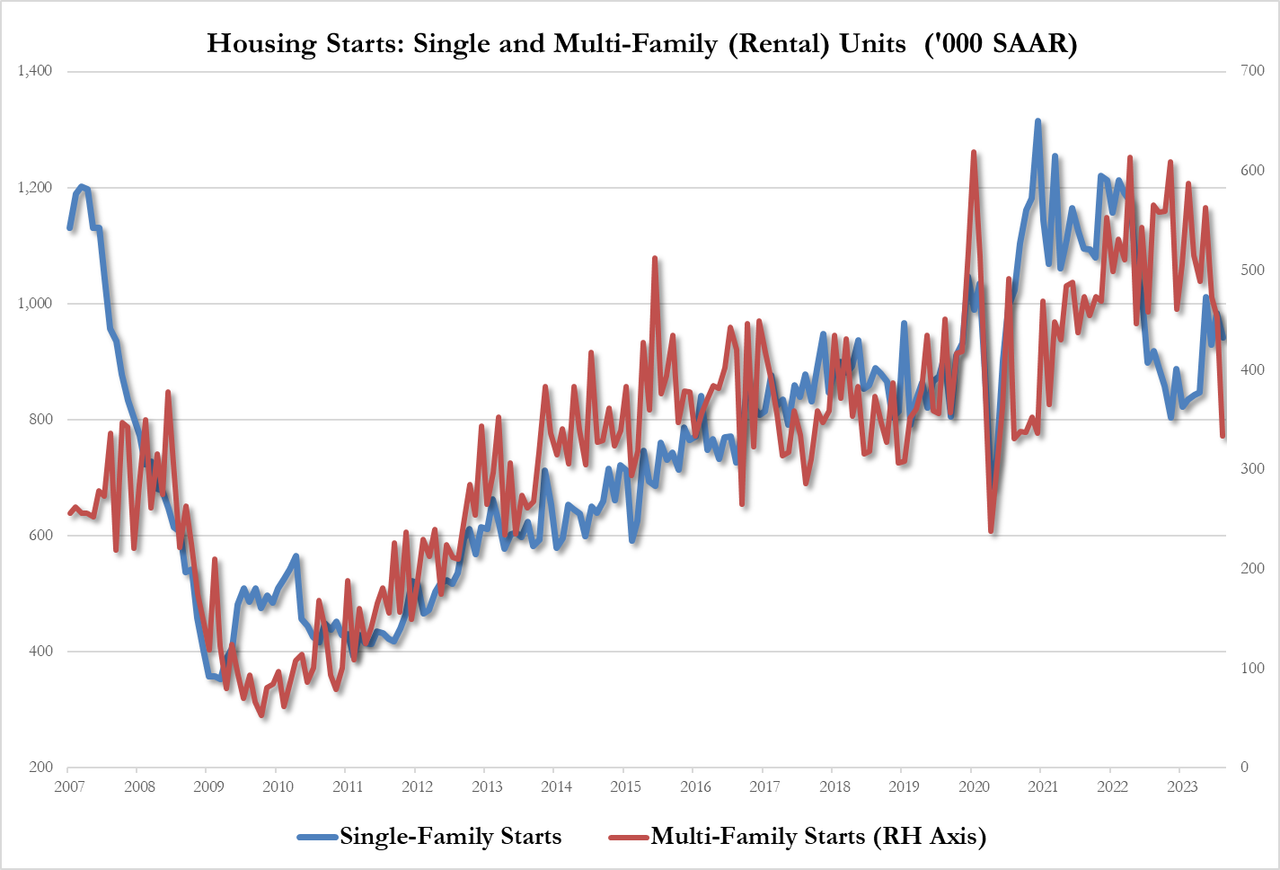
Privately‐owned housing starts in August were at a seasonally adjusted annual rate of 1,283,000. This is 11.3 percent below the revised July estimate of 1,447,000 and is 14.8 percent below the August 2022 rate of 1,505,000.
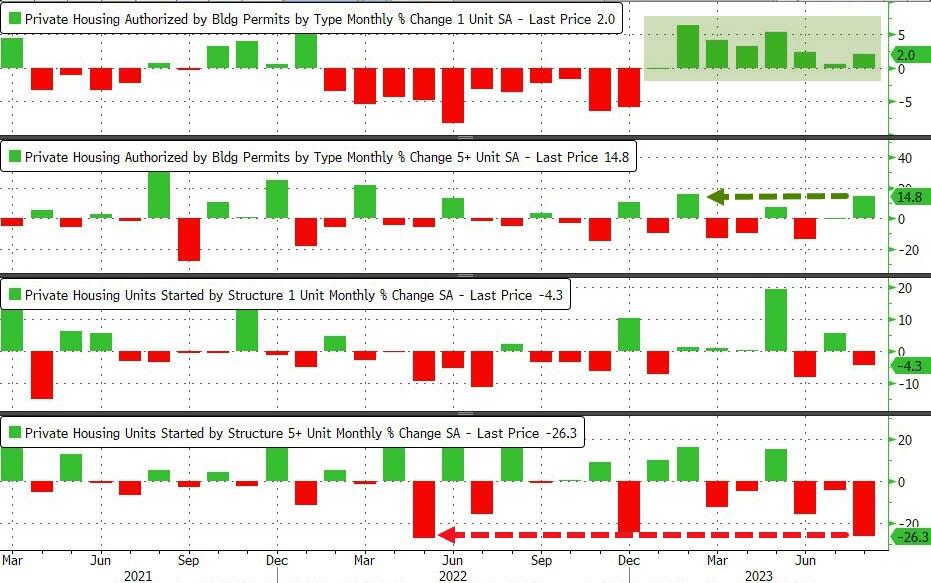
Single‐family housing starts in August were at a rate of 941,000; this is 4.3 percent below the revised July figure of 983,000. The August rate for units in buildings with five units or more was 334,000. This leaves Starts (SAAR) at their lowest since June 2020 and Permits (SAAR) at their highest since Oct 2022…
Source: Bloomberg
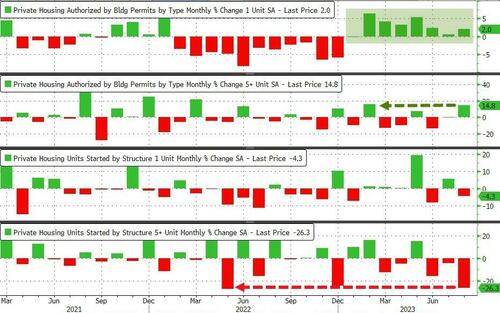
Under the hood, multi-family rental starts plunged by the most since June 2020 while single-family permits rose for the 8th straight month…
Source: Bloomberg
For context…
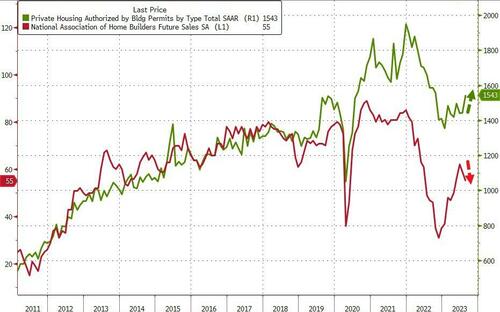
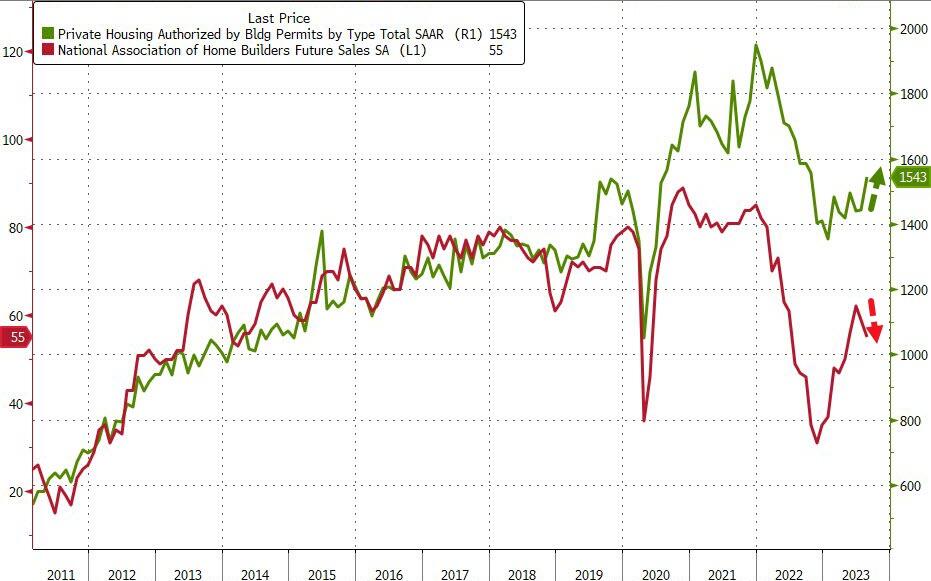
Finally, if sentiment among homebuilders is collapsing again, why are they loading up on permits?
Source: Bloomberg
Source: Bloomberg
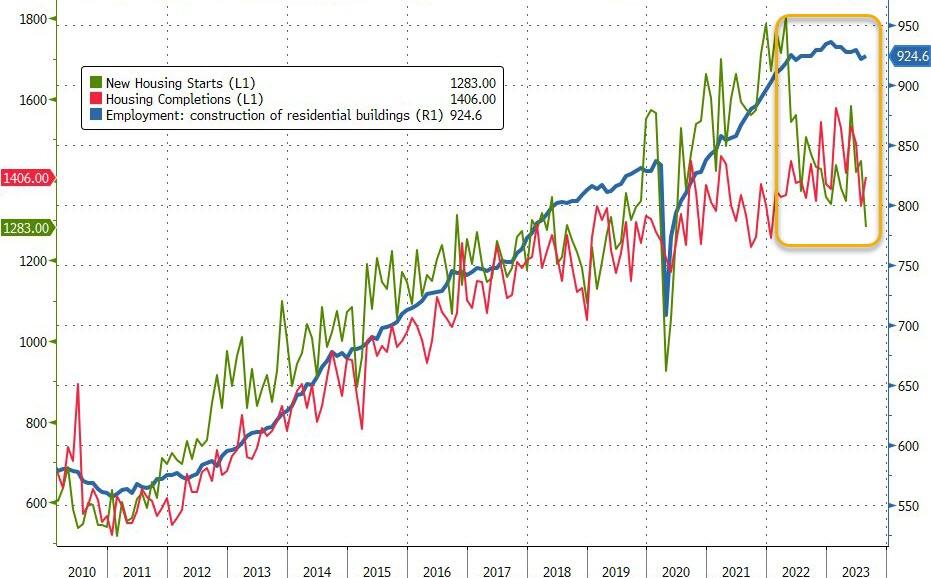
And why is construction employment still holding near its highs…
Source: Bloomberg
Will The Fed see permits soaring as homebuilders betting on their dovishness and step in tomorrow to curb-stop that optimism?
The Guns of August … Bidenomics’ guns pointed at the American middle class.
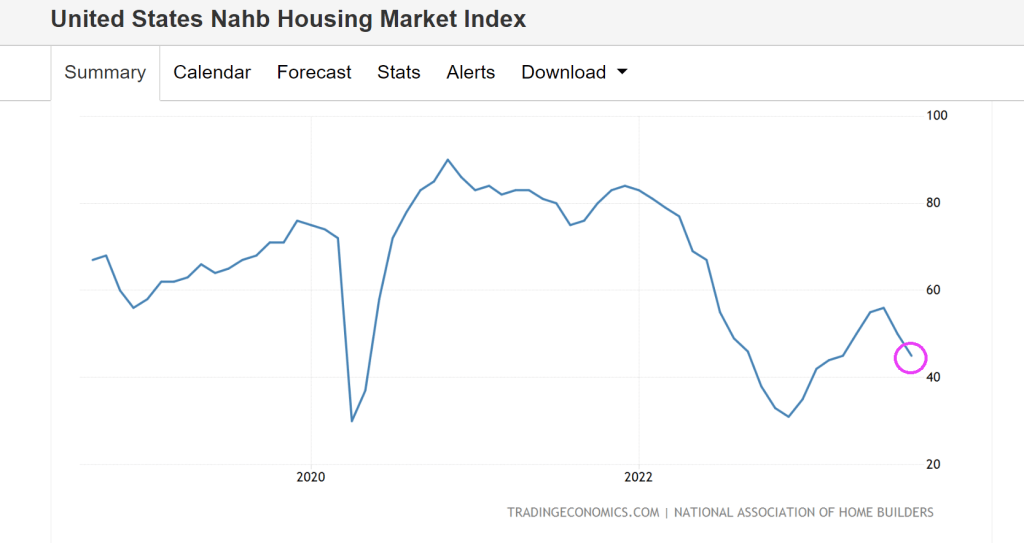
U.S. homebuilders are feeling pessimistic about their business for the first time in seven months, thanks to stubbornly high mortgage rates.
Builder confidence in the single-family housing market fell 5 points in September to 45 on the National Association of Home Builders/Wells Fargo Housing Market Index. The decrease follows a 6-point drop in August. Anything below 50 is considered negative.
Mortgage rates are up 152% under Biden’s Reign of Economic Error. Note the big assist the economy got from Covid-related Fed stimulus (red line). The Fed’s balance sheet is still over $8 trillion.


You must be logged in to post a comment.