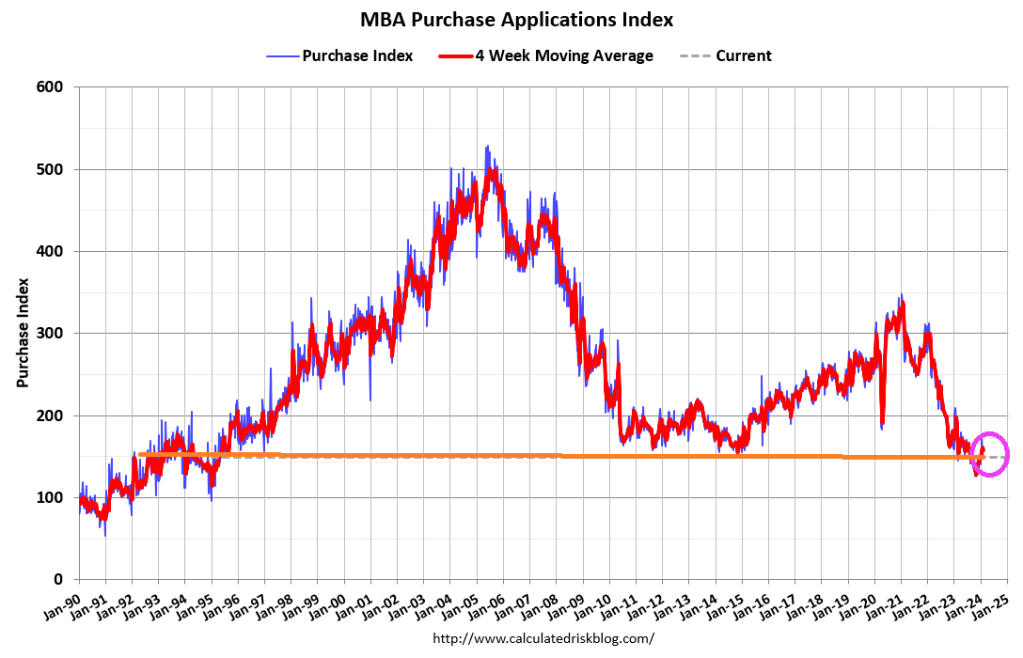
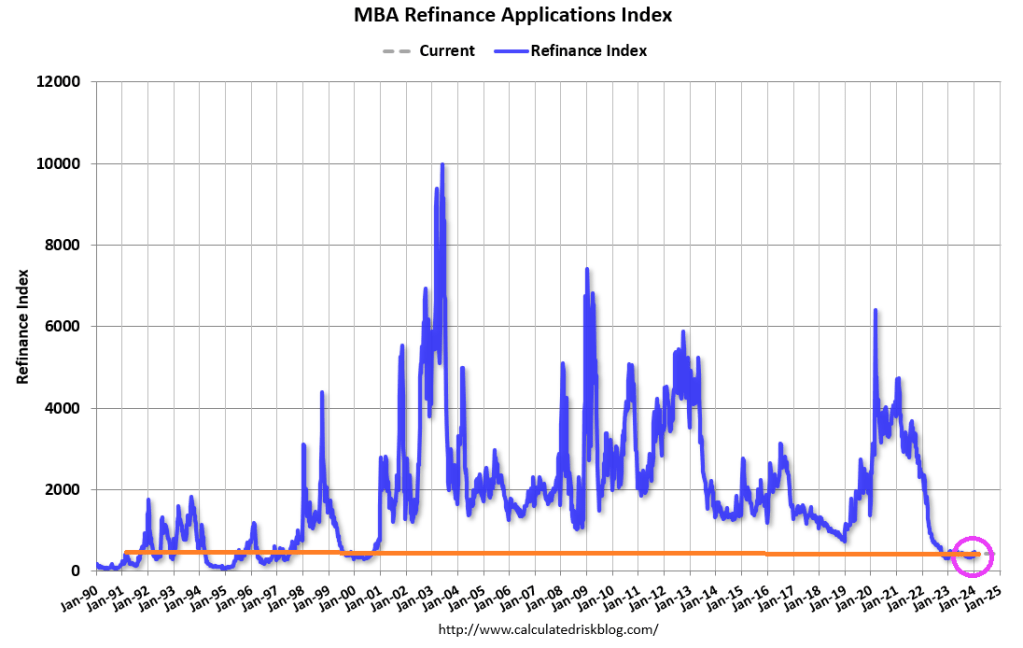
Mortgage applications decreased 2.3 percent from one week earlier, according to data from the Mortgage Bankers Association’s (MBA) Weekly Mortgage Applications Survey for the week ending February 9, 2024.
The Market Composite Index, a measure of mortgage loan application volume, decreased 2.3 percent on a seasonally adjusted basis from one week earlier. On an unadjusted basis, the Index increased 2 percent compared with the previous week. The seasonally adjusted Purchase Index decreased 3 percent from one week earlier. The unadjusted Purchase Index increased 4 percent compared with the previous week and was 12 percent lower than the same week one year ago.
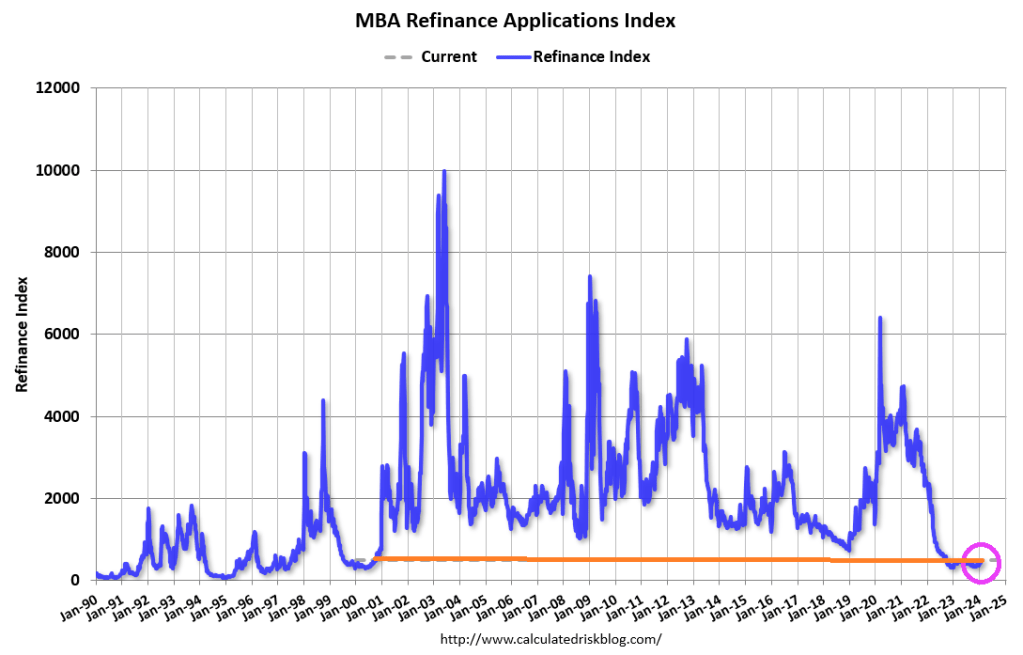
The Refinance Index decreased 2 percent from the previous week and was 12 percent higher than the same week one year ago.
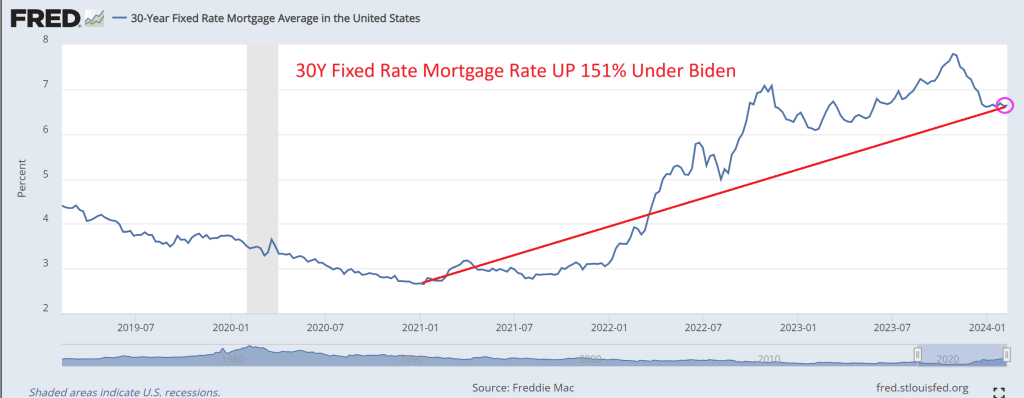
Mortgage rates (30Y fixed) are up 151% under Bidenomics.
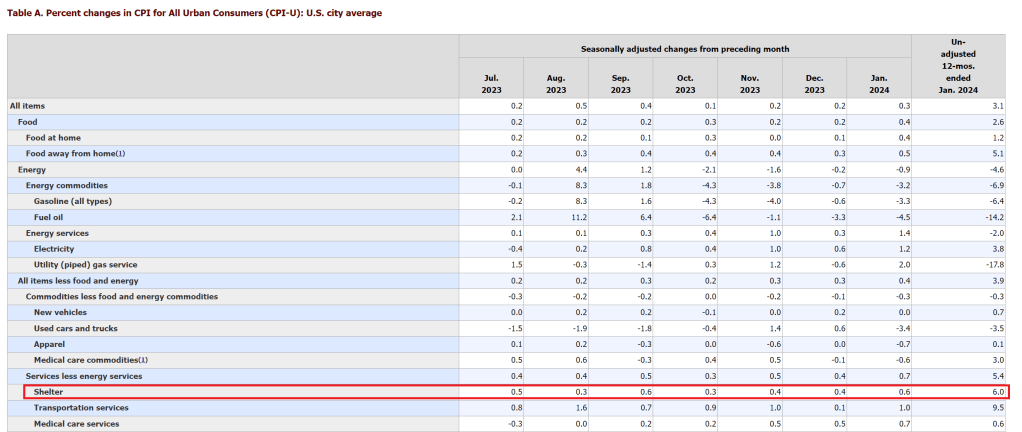
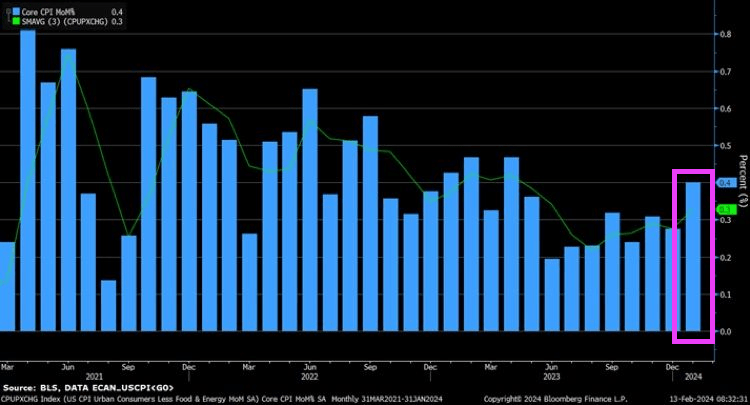
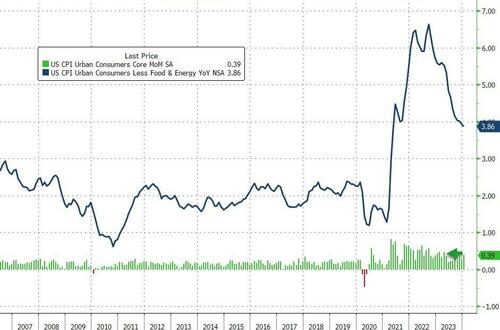
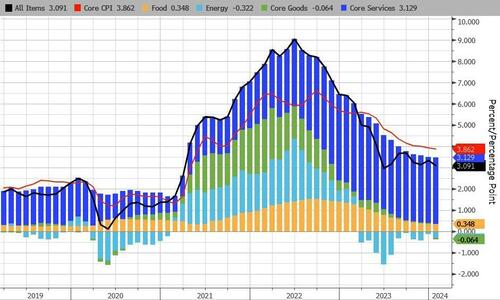
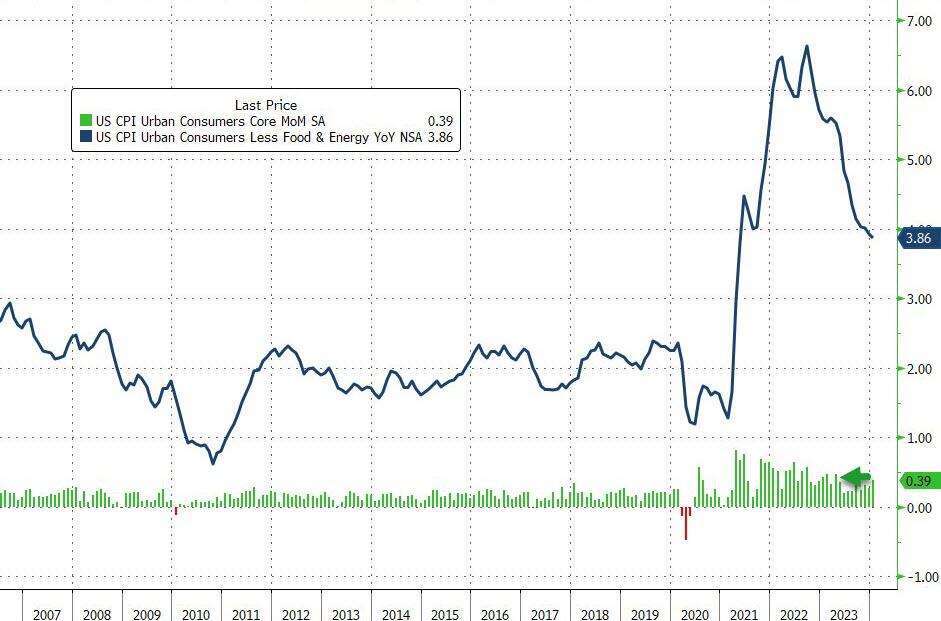
Core CPI fell below 4.00% YoY for the first time since May 2021, but the +3.86% YoY print was hitter than the 3.7% exp (with prices rising 0.4% MoM – the biggest jump since April 2023)…
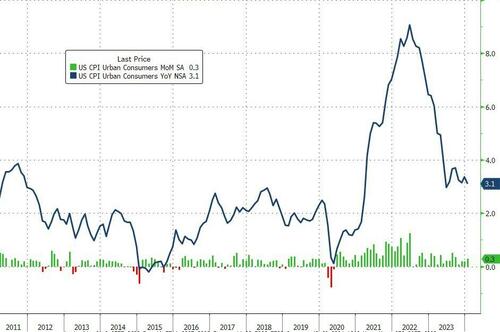
Source: Bloomberg
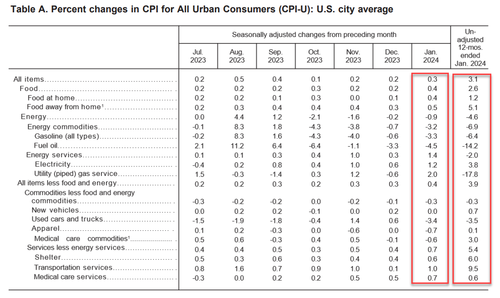
CPI Core: The index for all items less food and energy rose 0.4 percent in January.
The shelter index increased 0.6 percent in January, and was the largest factor in the monthly increase in the index for all items less food and energy.
The index for owners’ equivalent rent rose 0.6 percent over the month, while the index for rent increased 0.4 percent.
The lodging away from home index increased 1.8 percent in January. The motor vehicle insurance index increased 1.4 percent in January, and the recreation index rose 0.5 percent in January.
Among other indexes that rose in January were communication, personal care, airline fares, and education.
The medical care index rose 0.5 percent in January.
The index for hospital services increased 1.6 percent over the month and the index for physicians’ services increased 0.6 percent.
The prescription drugs index fell 0.8 percent in January.
The index for used cars and trucks fell 3.4 percent in January.
The index for new vehicles was unchanged in January.
The apparel index also decreased, falling 0.7 percent over the month.
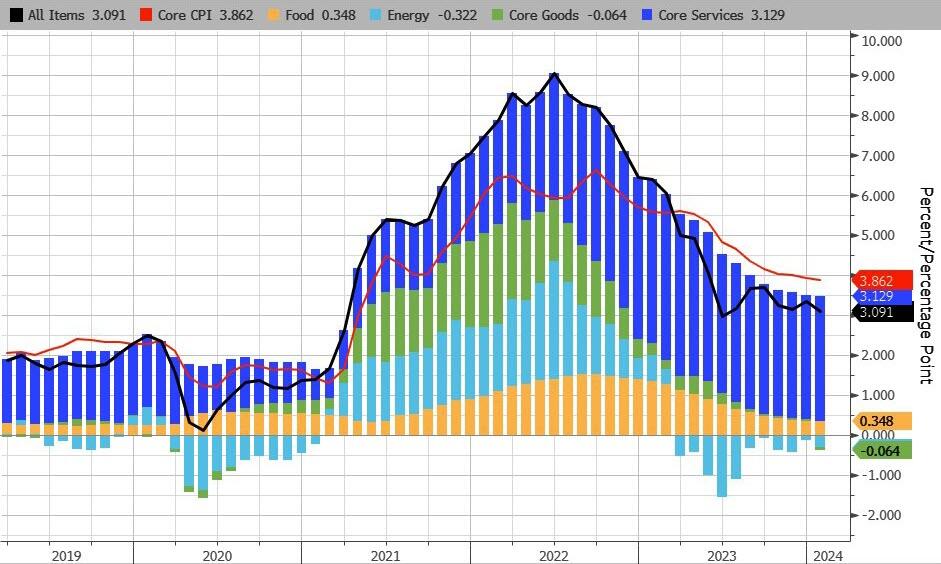
Core Service inflation picked up MoM…
..and accelerated YoY
Source: Bloomberg
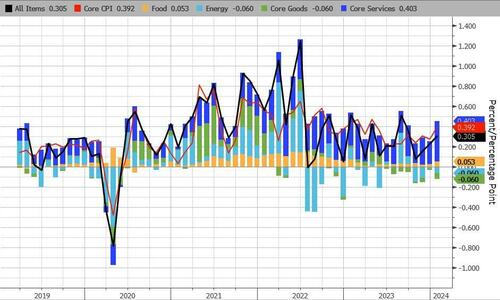
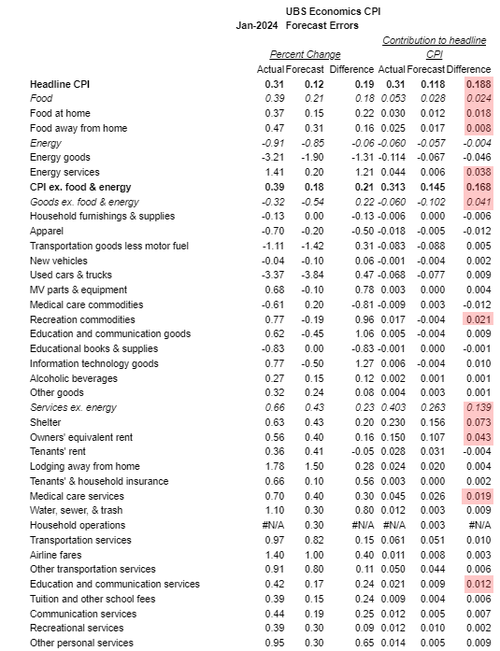
Under the hood, food and Energy services costs jumped MoM along with transportation services…
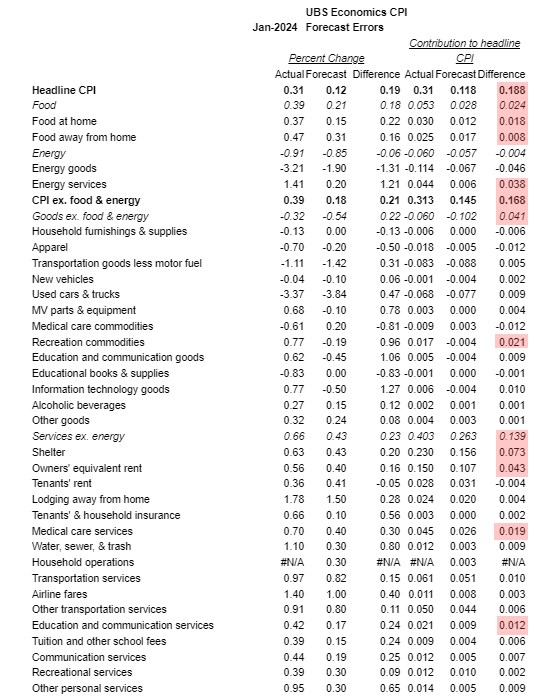
Here’s the biggest component upside surprises…
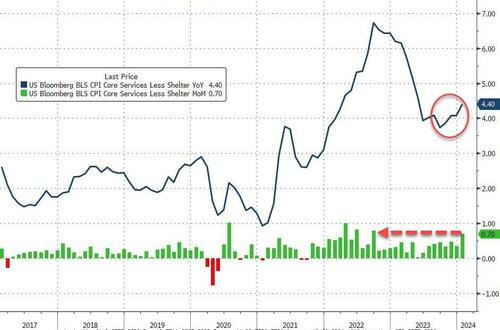
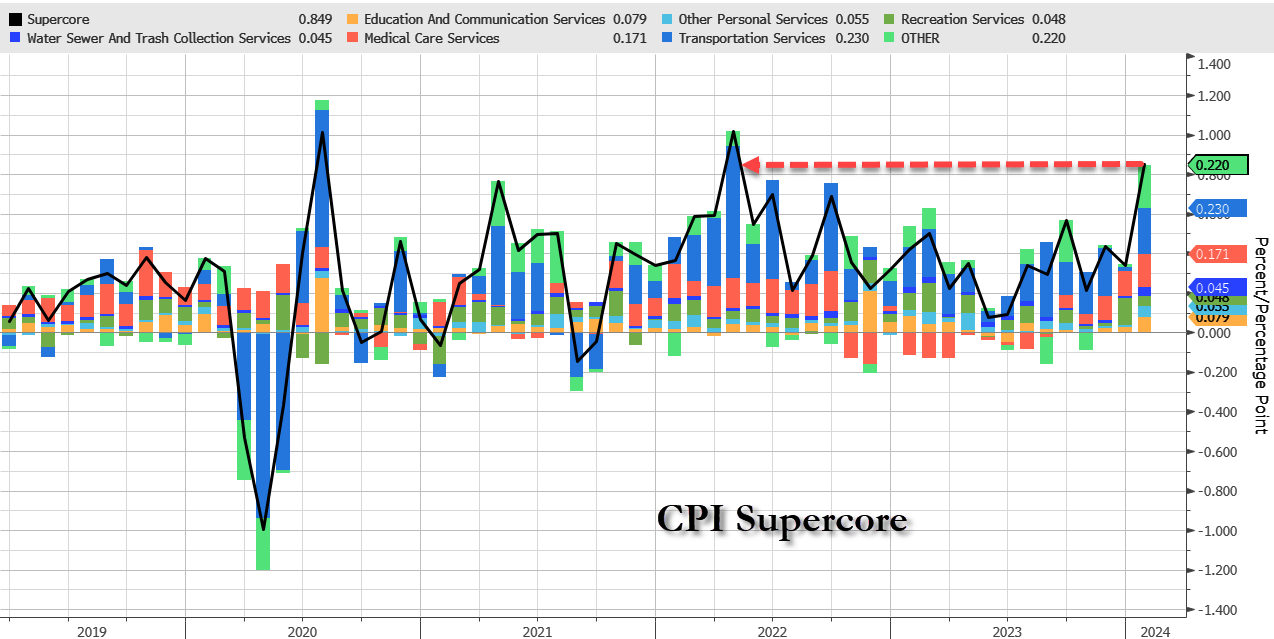
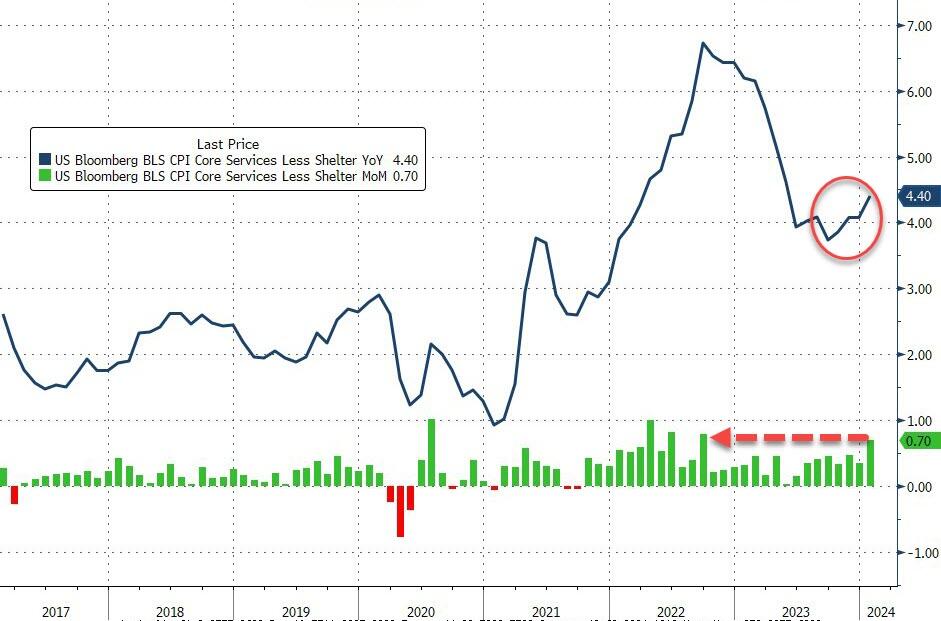
And one step deeper – the so-called SuperCore: Core CPI Services Ex-Shelter index – soared 0.7% MoM (the biggest jump since Sept 2022…
… driving the YoY change up to +4.4% – the hottest since May 2023….
Source: Bloomberg
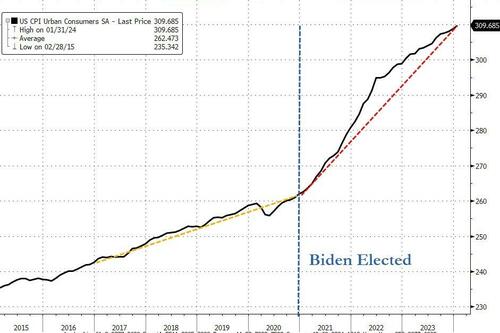
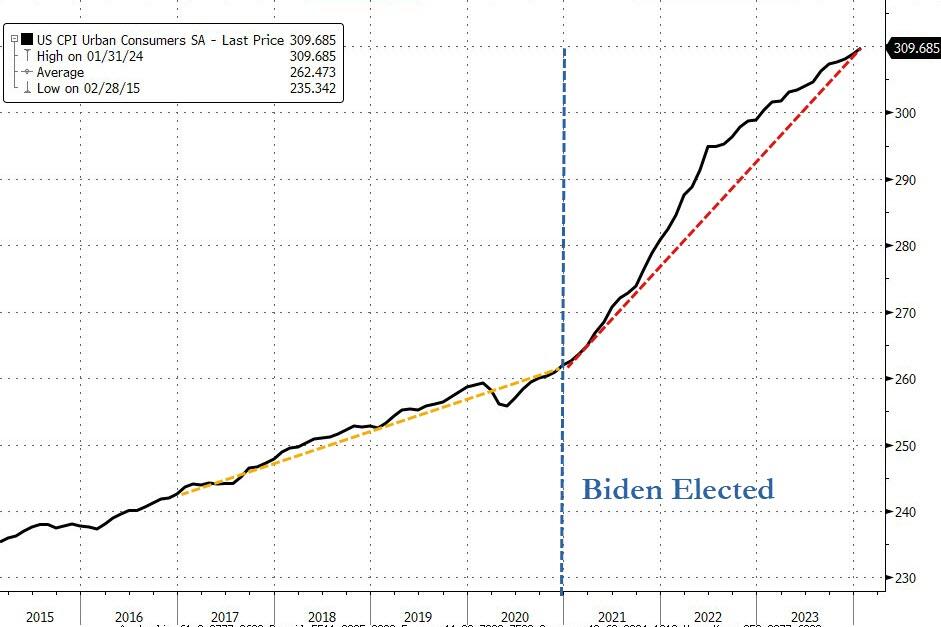
Finally, as a reminder, lower inflation does not mean lower prices.
Source: Bloomberg
The actual index of consumer prices hit a new record high this month – and is up over 18% since President Biden’s term began(it was up 8% over President Trump’s full four year term).
And it gets worse…
Source: Bloomberg
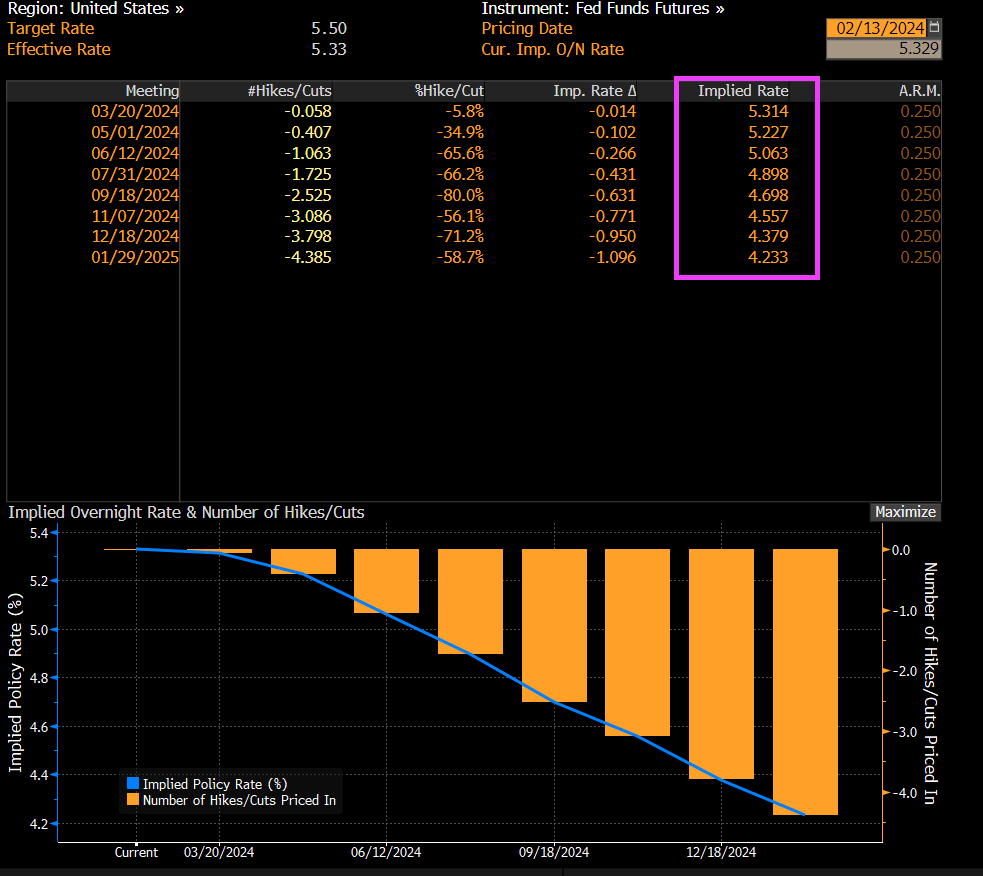
And on the higher than expected inflation report, we are still seeing bets on Fed Funds rate falling from 5.50% to 4.233% over the coming year.
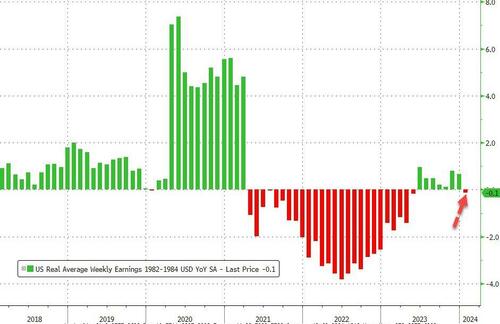
The re-accleration of inflation means wage growth is back in the red relative to prices.
“That doesn’t tend to happen in economies, except in very negative circumstances. What you will see, though, is inflation coming down,” explained the Fed Chairman, the average American neither understanding nor caring about the nuance.
Bitcoin raced upward, its market cap roughly half of Nvidia. The market now values this remarkable maker of the semiconductor chips necessary to create an artificial life form at roughly twice the value of the most secure network in human history.
Fidelity added Bitcoin to a model portfolio, spurring investors to consider what happens to the price of a digital asset, whose supply is fixed at 21mm for all eternity, once passive investment products start really stacking Satoshis.
You see, the supply of everything in the universe expands as its price increases, but no matter how high the price of Bitcoin goes, its pre-defined pace of production will only ever decrease.
Nvidia (or any other stock) can be created at the click of a new issuance, or an executive equity option grant for that matter. The average investor neither understands this yet, nor cares for the nuance.
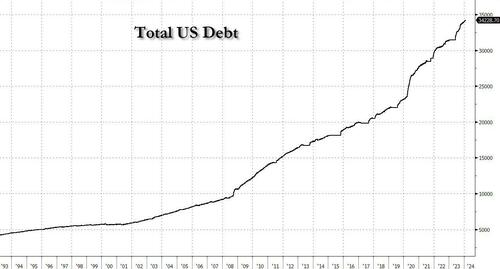
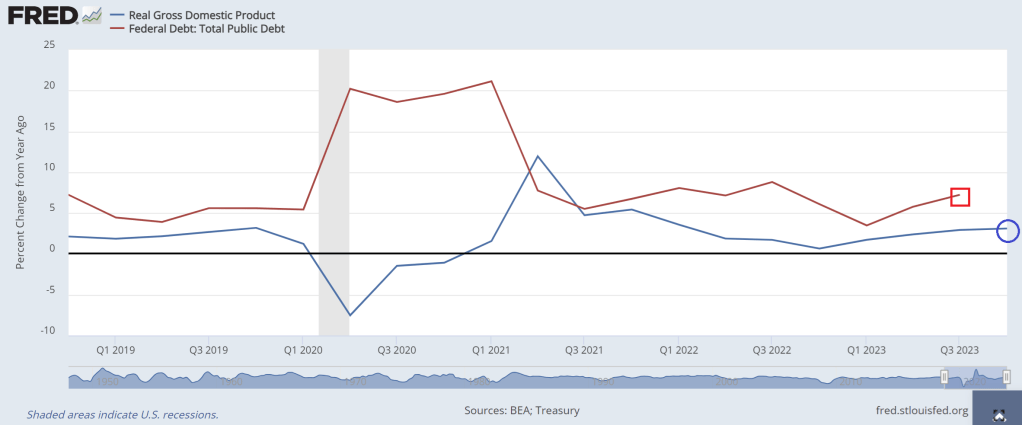
“I would say this. In the long run, the US federal government is on an unsustainable fiscal path,” said Powell, pointing out one of the most important top-down investment themes of the coming decade.
“And that just means that the debt is growing faster than the economy. So, it is unsustainable. I don’t think that’s at all controversial. And I think we know that we have to get back on a sustainable fiscal path. And I think you’re starting to hear now from people in the elected branches who can make that happen,” he added, without naming names, because there really aren’t any.
Under Brainless Joe and Dr. Janet Yellen, the US economy has experienced real GDP growth YoY only once (Q1 2021). Otherwise, debt growth YoY has always exceeded real GDP growth under Biden.
I admit I am rooting for the SF 49ers over the Kansas City Swifties. At least we won’t have to listen to Brainless Biden ramble on during the Super Bowl, unless they issue a pre-recorded propaganda piece for half time similar to the John Gill character from Star Trek.
Blank stares matter should be Biden’s new campaign slogan!
Biden is apparently too demented to be prosecuted for illegally sharing top-secret documents, but is able to be President?? And people wonder why Bitcoin is so popular??
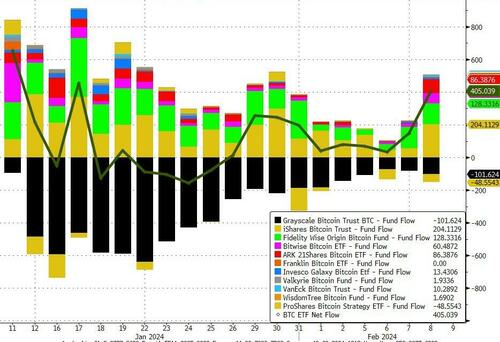
The net inflow yesterday meant that 8,698 BTC were taken off the market and put into cold storage.
“We think bitcoin could be one of the most talked about brands on Wall Street in the next decade,” Mike Willis, CEO and founder of ONEFUND, told CoinDesk.
“You’re at the beginning of the ‘bitcoin era’ on Wall Street.” Although remiss to offer a price prediction, Willis said he thinks bitcoin could easily catch up to gold’s market cap.
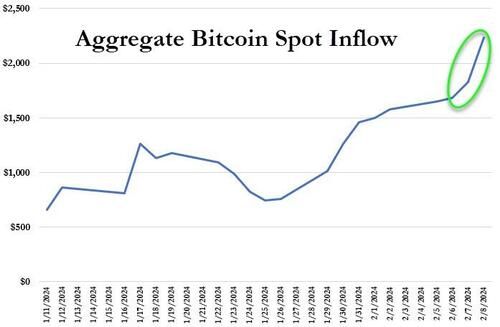
That has pushed the total net inflow into spot bitcoin ETFs up to $2.23 Billion…
Source: Bloomberg
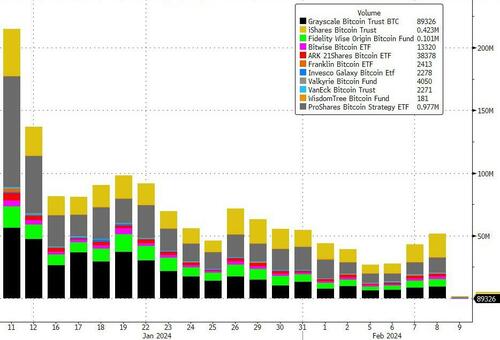
IBIT also became the first ETF to exceed GBTC’s daily trading volume. However, the total trading volume of all 11 spot Bitcoin ETFs fell below $1 billion for the first time since they launched.
Source: Bloomberg
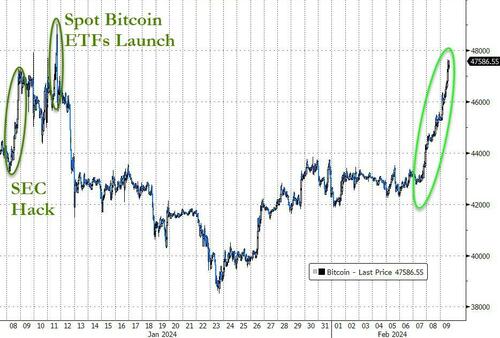
The result of all this is that bitcoin prices have soared back up near $48,000, erasing all the post-launch ‘sell the news’ losses…
Source: Bloomberg
Interestingly, this is a seasonally positive period for crypto:
“During the last 9 years, Bitcoin has been up every time traders would have bought bitcoin 3 days before and sold it ten days after the start of the Chinese New Year.”
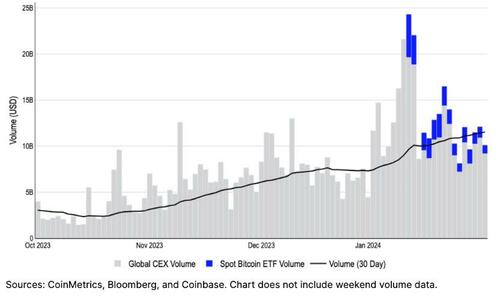
Coinbase just issued a report that suggests Bitcoin spot ETF activity accounts for around 10-15% of total bitcoin trading activity across centralized exchanges.
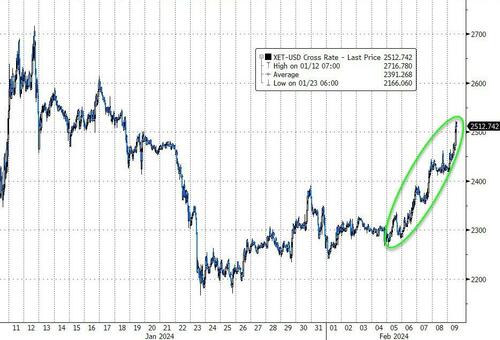
Smaller tokens such as Ether, Solana and Cardano also pushed upward…
Source: Bloomberg
As CoinTelegraph reports, Coinbase analysts say there have been more important crypto themes emerging in the aftermath of the spot Bitcoin ETF launches in the U.S., including the rising decentralized finance (DeFi) activity, which could “add meaningfully” to the value proposition for Ether.
Ethereum community member and investor Ryan Berckmans believes that Ethereum’s switch from a proof-of-work to a proof-of-stake consensus mechanism could drive ETH’s price to as high as $27,000 during the bull cycle.
“Bitcoin appears set to resume its march up after the Grayscale outflows finally tapered off,” said Caroline Mauron, co-founder of digital-asset derivatives liquidity provider Orbit Markets.
The “halving narrative” will gather momentum, potentially taking Bitcoin past $50,000 in the next few weeks, she said.
The quadrennial halving cuts the quantity of Bitcoin that miners receive for operating power-hungry computers that secure the network by solving complex puzzles.
Halving is key to capping the supply of Bitcoin at 21 million tokens. Rewards drop to 3.125 coins per block from 6.25 coins in the upcoming event.
Previous halving events “preceded strong bull runs,” a team including DBS Bank Ltd. Chief Economist Taimur Baig wrote in a note.
“There is a simple economic reason why prices should rise. As the reward for mining decreases, the price for mining output (namely Bitcoin) must increase to compensate and not trigger a withdrawal of computational resources by miners,” the team said.
With the growing demand from institutional investors, the diminishing supply could help BTC hit new market highs.
The US has gone full Kafka where no news is too insane. Maybe this should be Biden’s campaign slogan?
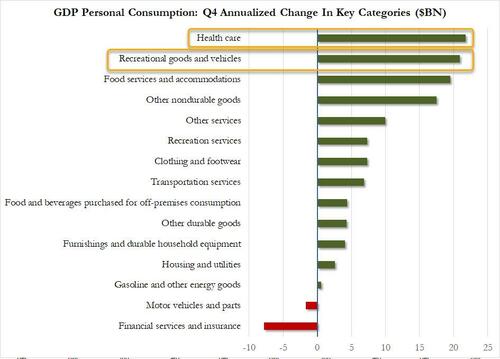
To quote Cousin Eddie from Christmas Vacation, “That there’s an RV.” Recreational goods and vehicles (aka, RVs) were second in Personal Consumption spending after America’s overpriced healthcare.
Spending on RVs makes sense since housing has become unaffordable for millions of households under Bidenomics.
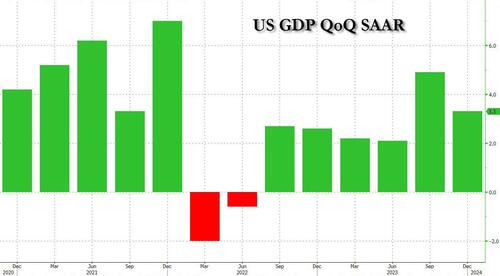
Note that GDP growth was better under Trump (pre-Covid).
The increase in consumer spending reflected increases in both services and goods. Within services, the leading contributors were food services and accommodations as well as health care. Within goods, the leading contributors to the increase were other nondurable goods (led by pharmaceutical products) and recreational goods and vehicles (led by computer software). Within exports, both goods (led by petroleum) and services (led by financial services) increased. The increase in state and local government spending primarily reflected increases in compensation of state and local government employees and investment in structures. The increase in nonresidential fixed investment reflected increases in intellectual property products, structures, and equipment. Within federal government spending, the increase was led by nondefense spending. The increase in inventory investment was led by wholesale trade industries. Within residential fixed investment, the increase reflected an increase in new residential structures that was partly offset by a decrease in brokers’ commissions. Within imports, the increase primarily reflected an increase in services (led by travel).
Compared to the third quarter of 2023, the deceleration in real GDP in the fourth quarter primarily reflected slowdowns in private inventory investment, federal government spending, residential fixed investment, and consumer spending. Imports decelerated.
Current‑dollar GDP increased 4.8 percent at an annual rate, or $328.7 billion, in the fourth quarter to a level of $27.94 trillion. In the third quarter, GDP increased 8.3 percent, or $547.1 billion (tables 1 and 3).
The price index for gross domestic purchases increased 1.9 percent in the fourth quarter, compared with an increase of 2.9 percent in the third quarter (table 4). The personal consumption expenditures (PCE) price index increased 1.7 percent, compared with an increase of 2.6 percent. Excluding food and energy prices, the PCE price index increased 2.0 percent, the same change as the third quarter.
Personal Income
Current-dollar personal income increased $224.8 billion in the fourth quarter, compared with an increase of $196.2 billion in the third quarter. The increase primarily reflected increases in compensation, personal income receipts on assets, and proprietors’ income that were partly offset by a decrease in personal current transfer receipts (table 8).
Disposable personal income increased $211.7 billion, or 4.2 percent, in the fourth quarter, compared with an increase of $143.5 billion, or 2.9 percent, in the third quarter. Real disposable personal income increased 2.5 percent, compared with an increase of 0.3 percent.
Personal saving was $818.9 billion in the fourth quarter, compared with $851.2 billion in the third quarter. The personal saving rate—personal saving as a percentage of disposable personal income—was 4.0 percent in the fourth quarter, compared with 4.2 percent in the third quarter.
GDP for 2023
Real GDP increased 2.5 percent in 2023 (from the 2022 annual level to the 2023 annual level), compared with an increase of 1.9 percent in 2022 (table 1). The increase in real GDP in 2023 primarily reflected increases in consumer spending, nonresidential fixed investment, state and local government spending, exports, and federal government spending that were partly offset by decreases in residential fixed investment and inventory investment. Imports decreased (table 2).
The increase in consumer spending reflected increases in services (led by health care) and goods (led by recreational goods and vehicles). The increase in nonresidential fixed investment reflected increases in structures and intellectual property products. The increase in state and local government spending reflected increases in gross investment in structures and in compensation of state and local government employees. The increase in exports reflected increases in both goods and services. The increase in federal government spending reflected increases in both nondefense and defense spending.
The decrease in residential fixed investment mainly reflected a decrease in new single-family construction as well as brokers’ commissions. The decrease in private inventory investment primarily reflected a decrease in wholesale trade industries. Within imports, the decrease primarily reflected a decrease in goods.
Current-dollar GDP increased 6.3 percent, or $1.61 trillion, in 2023 to a level of $27.36 trillion, compared with an increase of 9.1 percent, or $2.15 trillion, in 2022 (tables 1 and 3).
The price index for gross domestic purchases increased 3.4 percent in 2023, compared with an increase of 6.8 percent in 2022 (table 4). The PCE price index increased 3.7 percent, compared with an increase of 6.5 percent. Excluding food and energy prices, the PCE price index increased 4.1 percent, compared with an increase of 5.2 percent.
Measured from the fourth quarter of 2022 to the fourth quarter of 2023, real GDP increased 3.1 percent during the period (table 6), compared with an increase of 0.7 percent from the fourth quarter of 2021 to the fourth quarter of 2022.
The price index for gross domestic purchases, as measured from the fourth quarter of 2022 to the fourth quarter of 2023, increased 2.4 percent, compared with an increase of 6.2 percent from the fourth quarter of 2021 to the fourth quarter of 2022. The PCE price index increased 2.7 percent, compared with an increase of 5.9 percent. Excluding food and energy, the PCE price index increased 3.2 percent, compared with 5.1 percent.
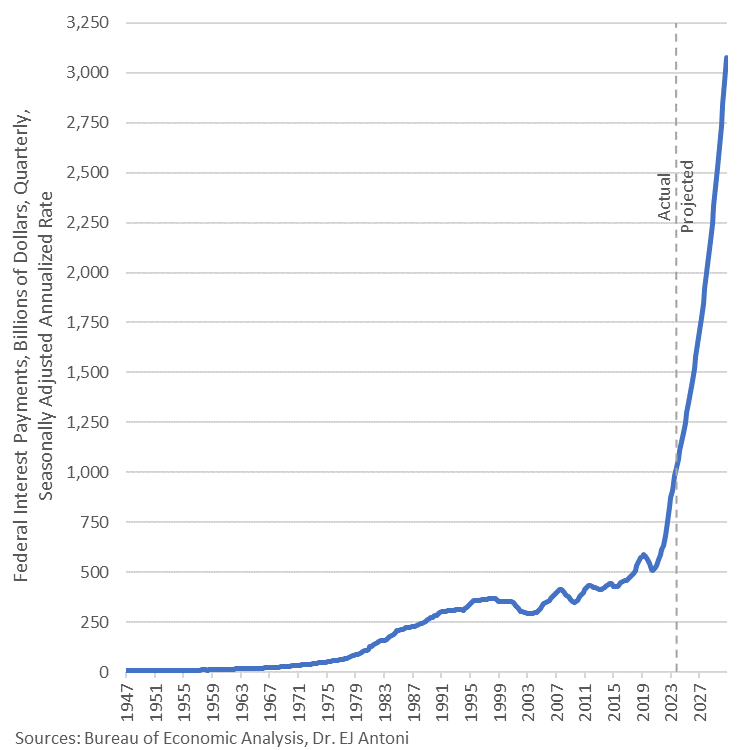
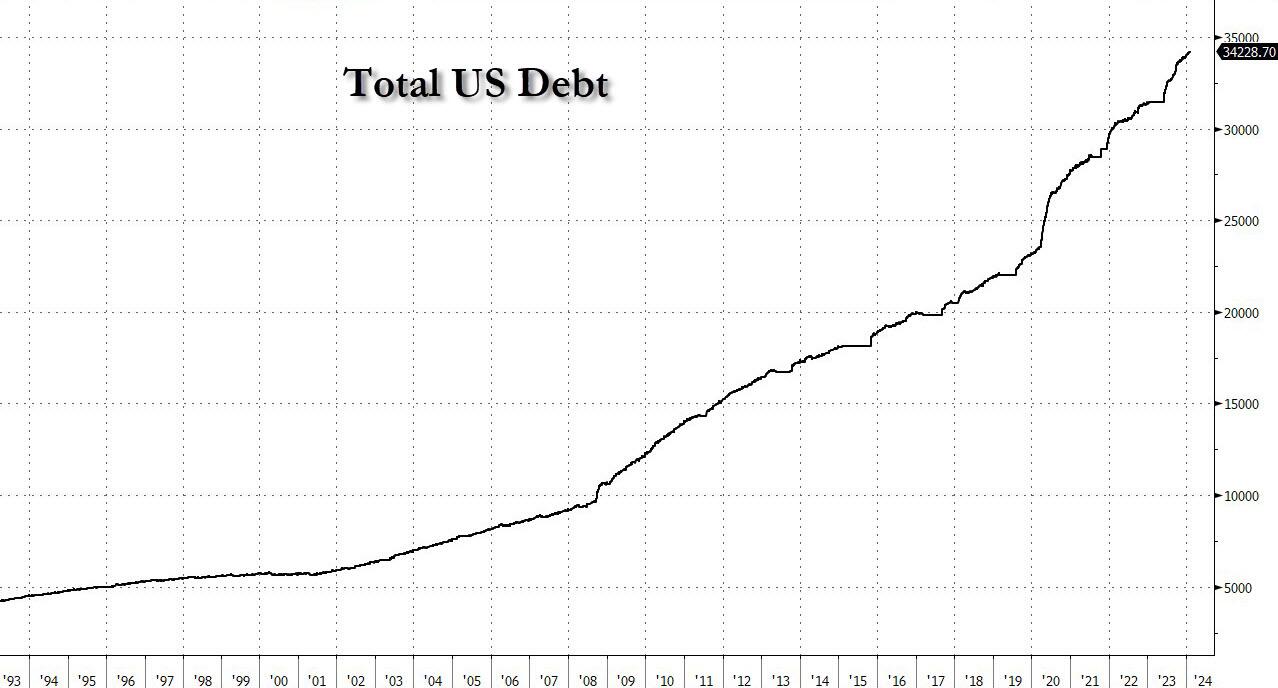
Annualized interest on the federal debt now exceeds $1 trillion and is projected to breach $3 trillion, annualized rate, by Q4 2030.
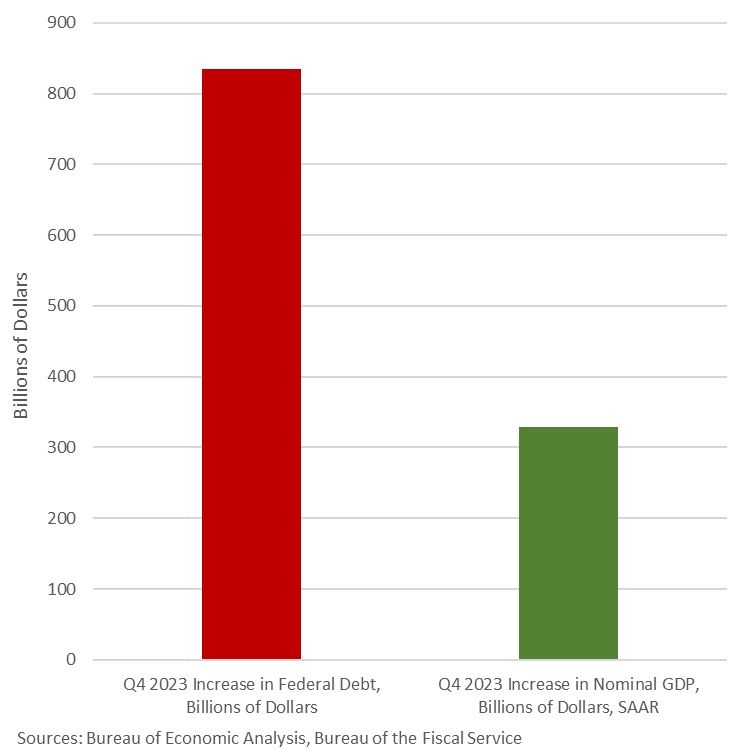
What can you get for an $834-billion increase in federal debt? Only a $328-billion increase in GDP. This economic “growth” in Q4 ’23 was fueled by gov’t expenditures and gov’t transfers, which in turn are fueled by deficits – sound sustainable?
This is Cousin Eddie’s RV. Cheaper than a house under Bidenomics!
Biden’s green energy mandates, a boondoggle for China and lodestone for Americans, is leaking over to the mortgage market. That’s Bidenomics!
Mortgage applications increased 3.7 percent from one week earlier, according to data from the Mortgage Bankers Association’s (MBA) Weekly Mortgage Applications Survey for the week ending January 19, 2024. The results include an adjustment to account for the MLK holiday.
The Market Composite Index, a measure of mortgage loan application volume, increased 3.7 percent on a seasonally adjusted basis from one week earlier. On an unadjusted basis, the Index decreased 4 percent compared with the previous week. The holiday adjusted Refinance Index decreased 7 percent from the previous week and was 8 percent lower than the same week one year ago. The seasonally adjusted Purchase Index increased 8 percent from one week earlier. The unadjusted Purchase Index increased 3 percent compared with the previous week and was 18 percent lower than the same week one year ago.
The unadjusted Refinance Index decreased 16 percent from the previous week and was 8 percent lower than the same week one year ago.
And, as Nomura’s Charlie McElligott highlights this morning, we are also seeing new upside being bot in SOFR Options for “dovish outcome”-hedging again, with Core PCE looming later this week.The market has had bunches of March SOFR Downside structures trading over the past few weeks to play for “Fed cut overshoot,” which has been the right trade YTD, as the implied probability distribution shows March Fed cuts now having been slashed by over half the the past week and a half (~80% priced to now just ~40%), and accordingly now we’ve witnessed some monetization of tactical Downside in recent days…
And we see the swaption surface getting mushed…
As he notes, the “dovish-trifecta” right-tail repricing has gotten us to ~4900… and, he says, the actual “realization” could then certainly push us through 5000:It’s my expectations that we could very well see:1) “March Fed cut” to pick-up Delta again after what is expected to be a “light” core PCE print this Friday…and taking back pricing following the past week’s Fed speak pushback and “too resilient” Labor- and Consumer- data, which has driven March Fed meeting “cut” probabilities being sliced in half over the past one week (~80% on 1/12/24 to today’s ~40%)The next potential dovish catalyst is 2) the QRA est / announcement end of Jan / start Feb, with “binary risk” implications on the direction of Duration and Risk-Assets, as the market generally anticipates resumption of larger Coupon issuance from the US Treasury ahead—but what if there is one final announcement where Bills stay high, Coupon increases but isn’t as large as most anticipate, AND Yellen signals that this is the final expected Coupon increase?!
While we’re at it and relate to the Treasury’s QRA discussion, let’s not forget the “other” market- and economic- backstop being applied by the Biden Administration (and aided by what looks to be Janet Yellen’s “politically activist” US Treasury with TBAC sign-off) – which is the continued willingness to run large fiscal deficits in an attempt to “run the economy hot” in this election year, with much of it being “paid for” via Bills (so to prevent long-end Rates from pushing higher, which would tighten US financial conditions)……this is Green build, CHIPS Act, and even fresh “election surprises” like Biden announcement Friday on “forgiveness” of a fresh $5B of student loans, now making the total loan forgiveness approved by the Biden admin $136.6B
And finally as a derivative of the above mention, another hypothetical Treasury QRA where we’d see “Bill issuance remaining high, yet with Coupon increases not as large as most anticipate” would then mechnically see MMF’s continuing pulling from RRP to buy Bills, which will further accelerate the RRP drain…and as outlined in recent weeks, “low” RRP levels will act as “a” key input to Fed reaction function on determining LCLoR……which will ultimately mean 3) a pulling-forward on the market’s expected timing on the “end of QT”
This “dovish-trifecta” is the macro catalyst behind the “right-tail” scenario which has appropriately been repriced higher by the market over the course of the past month, and we’ve seen clients allocate some protection spend to this “crash-UP” scenarioAnd again, IF the above were to realize… without negative catalysts (Earnings fine, no further Rates selloff / Fed repricing, continued disinflationary trajectory rebuilds “Fed cut” implied probability) around that upcoming Feb VIXpery with all that Dealer “short VIX Calls” positioning being hedged… there is absolutely potential for an Equities slingshot if there are no issues and those customer “Long VIX Calls” bleed-out, which will mean Dealers puke out their UX1 Longs (as hedges) back into the market for a potential “kicker” to goose Spot Equities even higher…For now, no-one is worried about downside based on VVIX being back near post-COVID lows…
So what then is the largest DOWNSIDE RISK to Equities?
Outside of “Mag 7” guidance disappointments, I believe the next worst-case scenario for current positioning in Stocks would be an “Animal Spirits” US data reacceleration which forces the above “dovish trifecta” off-course and blows-out the recently calming “Fed Rates path” distribution again:Why would resumption of better US growth data negatively impact US Equities consensus thematic / singles positioning?Because after the 4Q23 de-grossing of short books and forced “Net-up” to stop the bleed and chase (massive squeeze & cover in low quality / cyclical value / leveraged balance sheet / high short interest “junk”)….2024 YTD has instead seen the market reset the prior “Momentum” regime of “Long Quality / Size / Secular Growth” i.e. MegaCap Tech, while re-shorting that economically-sensitive “low quality / junk” stuff againIn a world of slowing but positive growth to 2% GDP and now with 3m inflation annualizing sub 2% target…you go back to that “QE of old” 2010s -decade playbook of “long stuff that can grow earnings and profits without needing a hot economic cycle”…i.e. long quality, size (liquid) & secular growth / short leverage & cyclical valueBut IF we see the “animal spirits” data reacceleration off the back of the massive FCI easing that the Fed and Treasury have facilitated, plus the persistent wage growth and still too strong labor meaning consumption remains robust, along with ongoing govt fiscal stim / spending…
.
..we risk a chance of inflation pivoting away from the current disinflationary trajectory(God-forbid actual “reflation”) which would could see that “long secular growth / short econ sensitive / cyclical value’ trade get a shock reversal…
…as long-end Yields and accordingly then, financial conditions, re-tighten and smash the “high valuation” Quality / Secular Growth stuff, while the heavily hated / shorted Cyclicals would painfully squeeze higher.Don’t forget, we’ve seen that happen before (yes we know the magnitudes of the inflationary impulse are different, but the timing of the human-emotion/monetary-policy-over-confidence double-rip in inflation is unquestionable)…
So, be careful what you wish for from higher and higher all-time-highs for stocks – the stronger they look (on the back of dovish expectations), the more likely The Fed is to hold back the actual dovish actions so much hope is founded on.
Remember the massive bank bailout of “subprime” mortgage securities back that resulted in the Dodd-Frank banking legislation of 2010? Yes know, where they promised NO MORE BANK BAILOUTS EVER??? Particularly if Disease X is unleashed and we start shutting down economies and schools again. Will we see ANOTHER bank bailout??
Cantor Fitzgerald CEO Howard Lutnick spoke with Fox Business host Maria Bartiromo on the sidelines at the World Economic Forum in Davos, Switzerland, last week. He offered a bleak outlook on the commercial real estate sector, warning a “very ugly” two years is ahead.
“Coming due in the next two and a half years at these higher rates – you’re not going to get proceeds, meaning when you have a $120 million loan on a building, and someone says I’ll give you 90 million at a much higher rate – than it throws the keys back to the lenders – and there’s going to be a lot of them that are going to get wiped out,” Lutnick told Bartiromo.
“I think $700 billion could default … The lenders are going to have to do things with them. They’re going to be selling. It’s going to be a generational change in real estate coming at the end of 2024 and all of 2025. We will be talking about real estate being just a massive change,” Lutnick said.
He warned: “I think it’s going to be a very, very ugly market in owning real estate over the next, you know, 18 months, two years.”
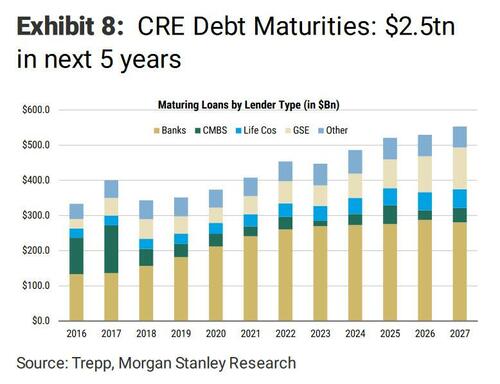
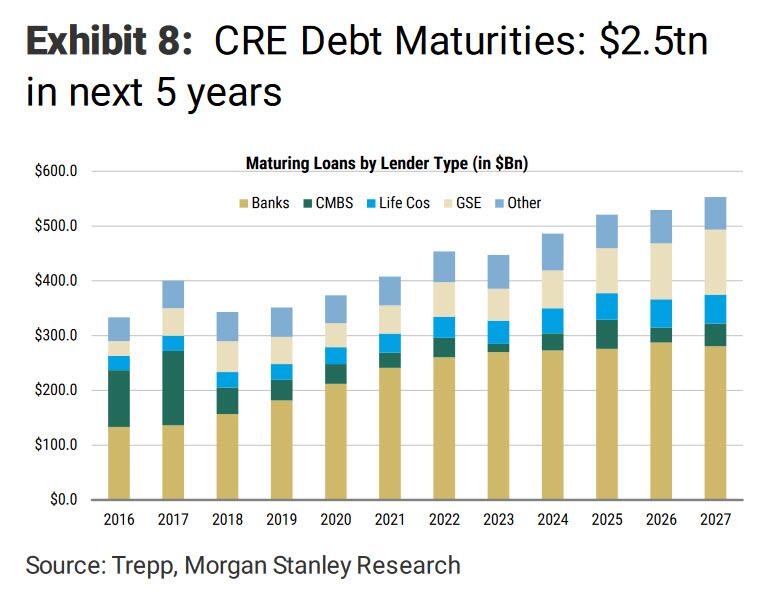
Lutnick noted that loan sales are set to become a major business opportunity with the upcoming maturity of CRE mortgages. He highlighted that an estimated trillion dollars of CRE debt is coming due over the next 2.5 years.
Shortly after the regional bank implosion in March 2023, Morgan Stanley penned a note to clients about a $2.5 trillion wall of CRE debt coming due over five years.
A recent survey of Terminal users by Bloomberg’s Markets Live found most respondents believe the office tower market needs a deeper correction before a rebound materializes.
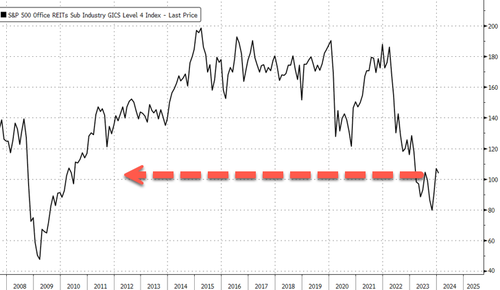
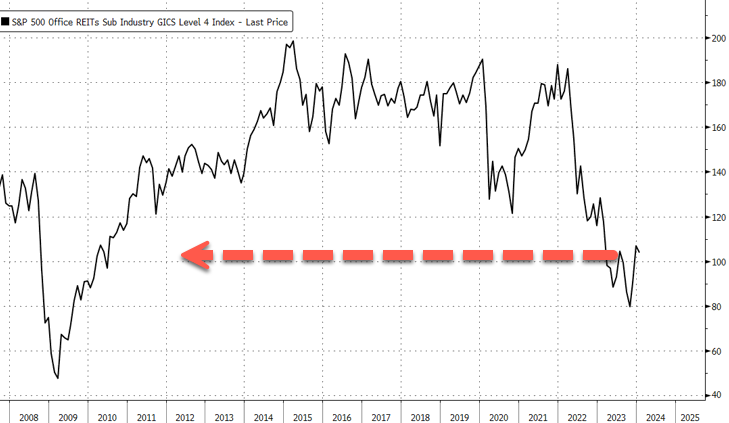
Lutnick pointed out, “Real estate equity, REITS, are going to be in trouble … a lot of them are going to be wiped out, so many defaults, I think.”
Bloomberg office REITs have been plunging since early 2022 when the Federal Reserve embarked on the most aggressive interest rate hiking cycle in a generation to tame inflation.
“Commercial real estate is experiencing a meaningful repricing as cap rates correlate to long-term to interest rates,” Morgan Stanley told clients in a recent report, adding, “Patience is required while refinancing to higher debt costs gradually triggers valuation adjustments.”
Lutnick’s not the only one with a dismal outlook on CRE.
In a recent interview, Scott Rechler, Chairman and CEO of RXR Realty, told Goldman’s Allison Nathan that the CRE downturn is still in the early innings.
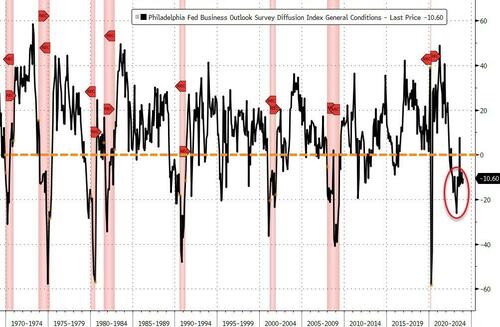
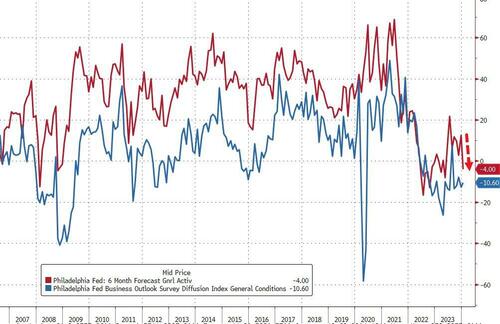
More worrying is the fact that hope appears to be dwindling fast as the six-month-forecast for the survey plunged back into contraction (from +12.6 to -4.00)…
Source: Bloomberg
Philly Fed’s demise is consistent with the collapse of hope as ‘soft’ survey data has slumped in the last month, back to its weakest since July (as ‘hard’ data improves relative to expectations)…
Source: Bloomberg
On the bright side for the doves, the dis-inflationary trend remains in tact as priced paid and prices received both plunged in January. However, we highlight the fact that Philly businesses expect price pressure to return in the next six months…
Source: Bloomberg
Overall, the ‘bad news’ in this report should buoy stocks and bonds (lower inflation and lower growth enables sooner and faster cuts)… But will it.
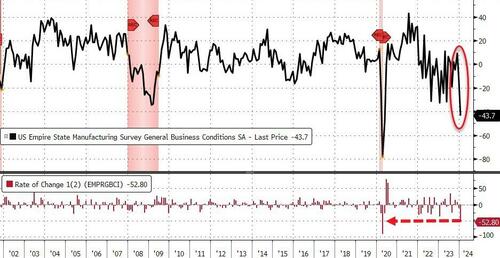
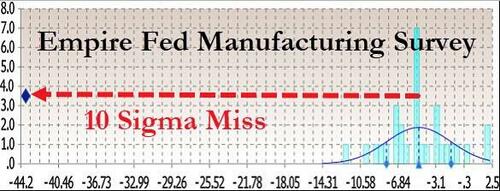
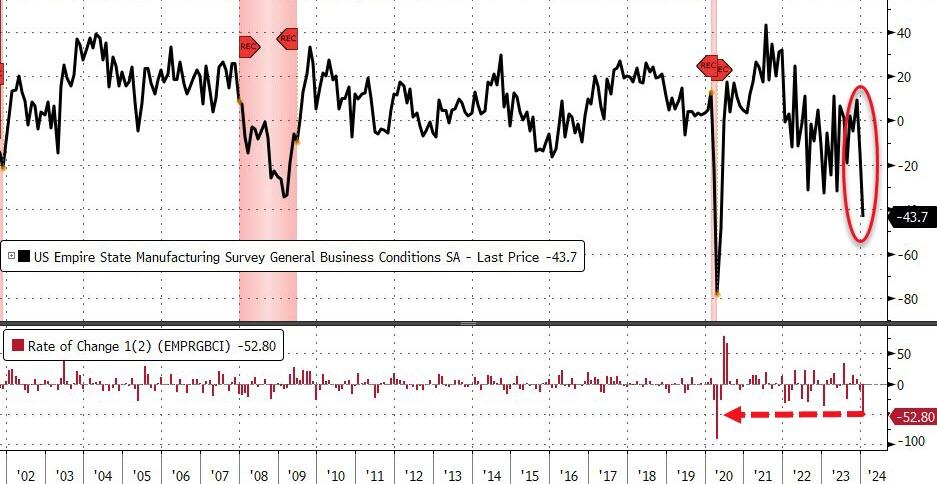
The -43.7 print was a stunning 10 standard deviations below expectations of a bounce to -5.0…
Source: Bloomberg
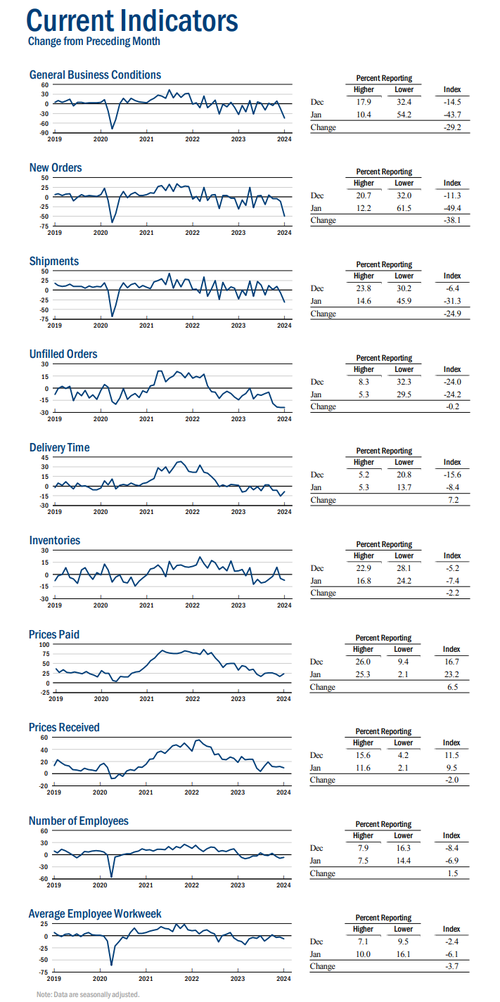
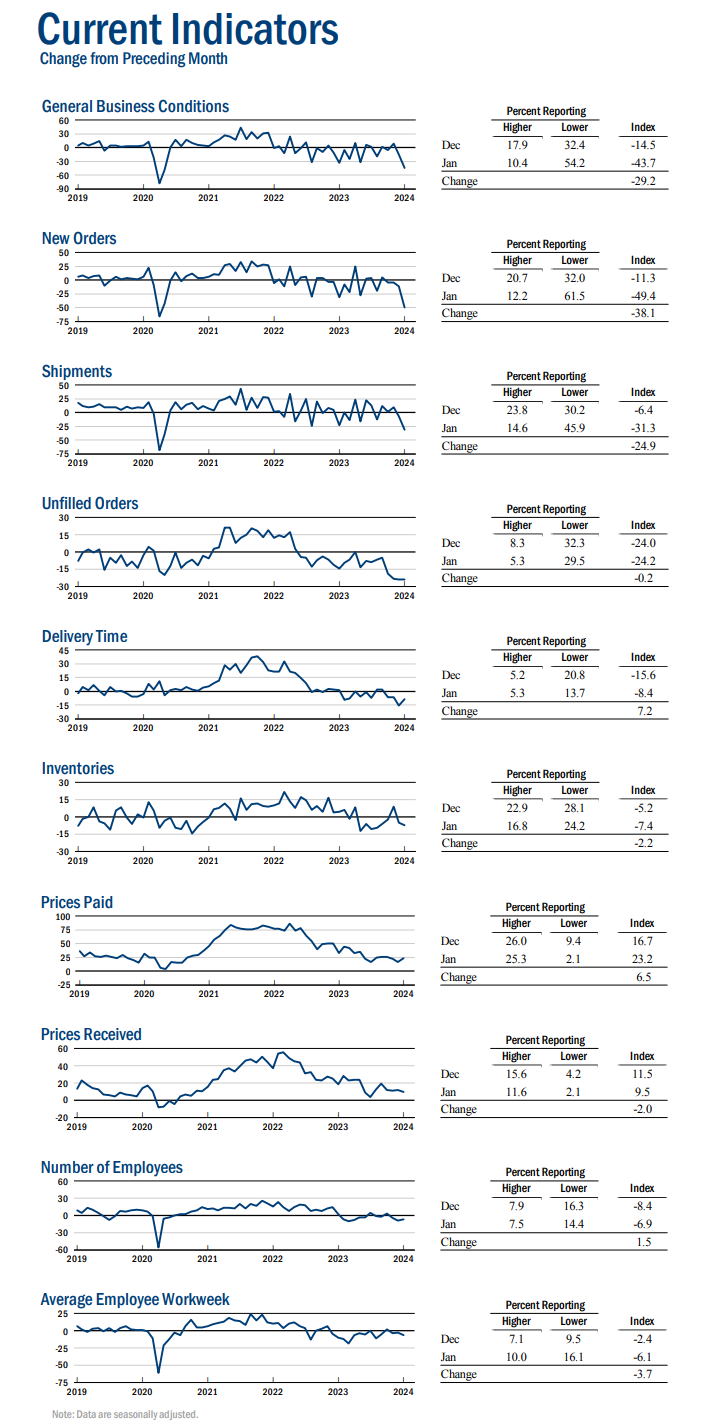
Under the hood, it was a bloodbath. New orders slumped more than 38 points to minus 49.4, the weakest since April 2020, while shipments dropped by the most since August. Worse still, the index of prices paid for materials increased to a three-month high.
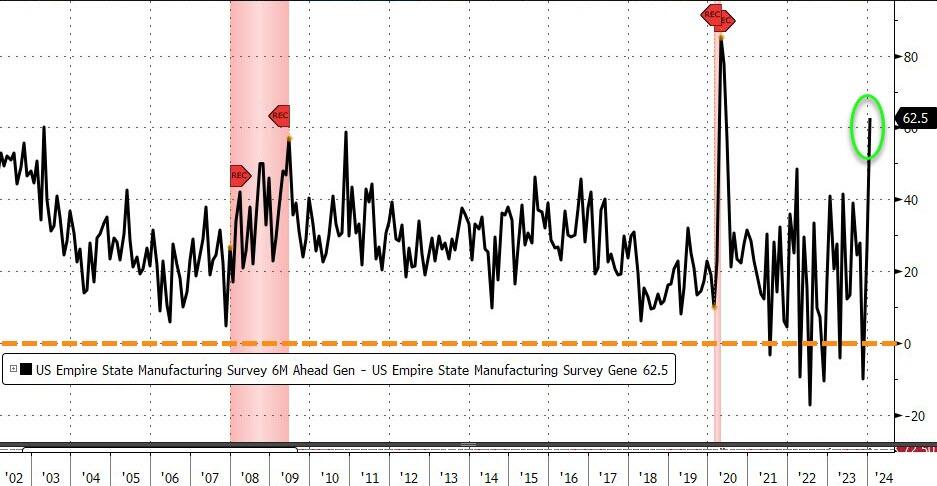
But hope remains high as the six-month outlook for overall activity improved to a three-month high, suggesting manufacturing will stabilize at a weak level. The measure of the outlook for capital expenditures increased to the highest since April 2023, suggesting a pickup in investment.
However, the spread between current reality and a hopeful future is at near record highs (record Ex-COVID-lockdowns)…


You must be logged in to post a comment.