Here we sit with core inflation rate BELOW the current Fed Funds Target Rate (upper bound). So is it time to start withdrawing its more than ample monetary stimulus. Like the Bank Term Funding Program.
The Federal Reserve is likely to retire the Bank Term Funding Program in March. This would entail an additional ongoing headwind for reserves, and thus liquidity, through 2024. At the margin, this adds weight to the case for the Fed cutting interest rates sooner in the year.
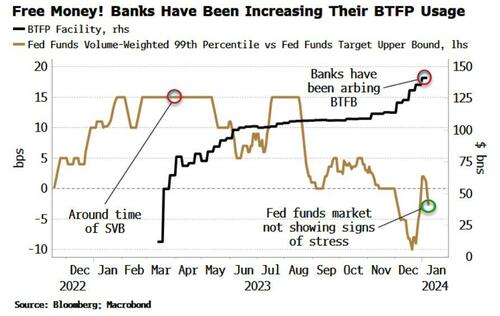
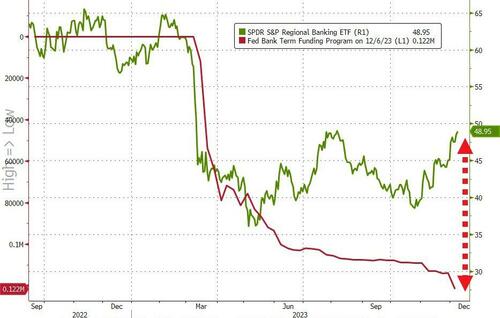
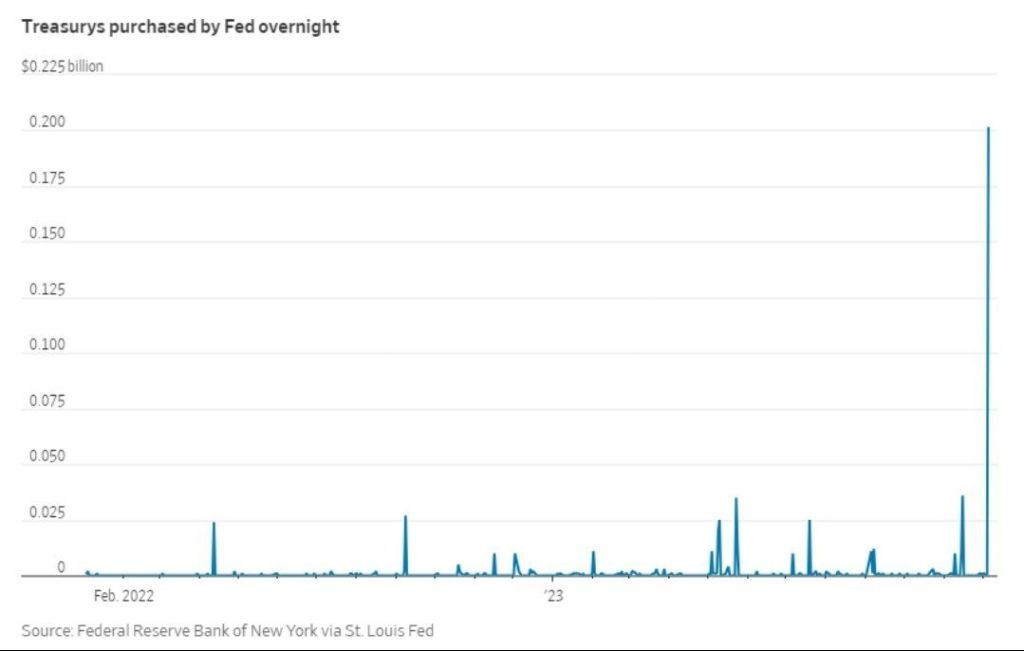
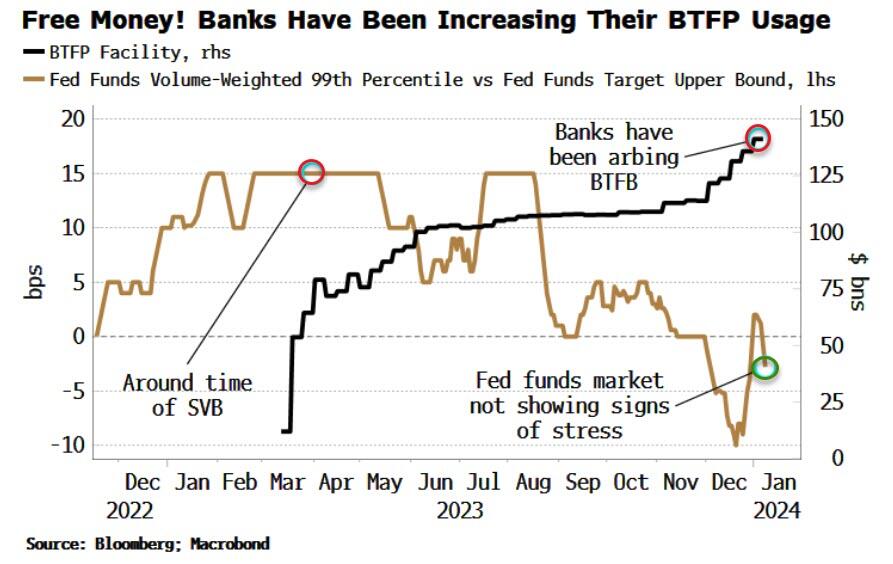
The BTFP was created in the wake of the SVB crisis to help struggling banks get access to liquidity when bond prices were dropping. However, its use in recent months has jumped to over $140 billion. That is not, however, a sign of banking stress.
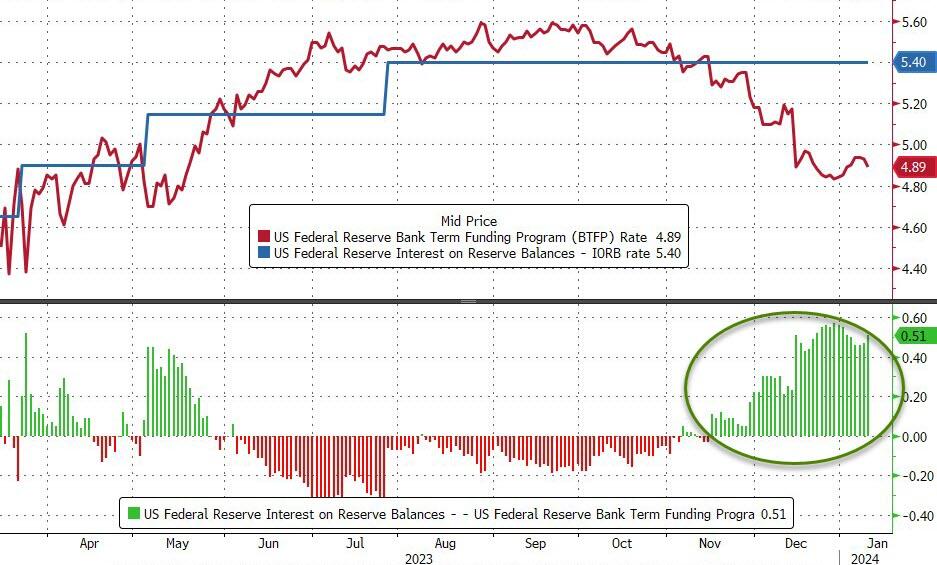
The chart below shows the usage of the BTFP along with the rate paid at the 99th percentile in the fed funds market relative to the upper bound of the range for fed funds.
As can be seen, this is under zero, i.e. banks are not having to pay up to get liquidity.
This is in stark contrast to last March at the time of SVB’s fall when some banks were having to pay 15 bps above the fed funds upper bound for liquidity.
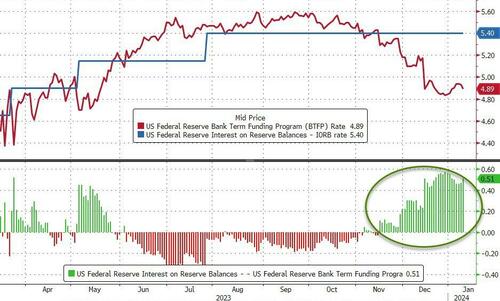
This time the rise in BTFP usage is good old-fashioned arbitrage. After the Fed’s pivot, term rates have come down relative to the policy rate. The cost to use the BTFP is 1y OIS + 10 bps, which is ~4.90%. Banks can post USTs at par as collateral, borrow at this rate, then deposit the funds back at the Fed at the IORB rate (interest on reserve balances), i.e. 5.40%, for a juicy risk-free profit.
This is not good optics, so it is unlikely the program will be renewed when it is due to expire on March 11. Michael Barr, the Fed’s vice chair for supervision, hinted as much on Tuesday when he emphasized the BTFP is an “emergency program.”
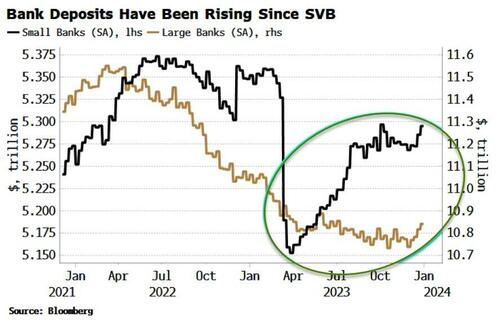
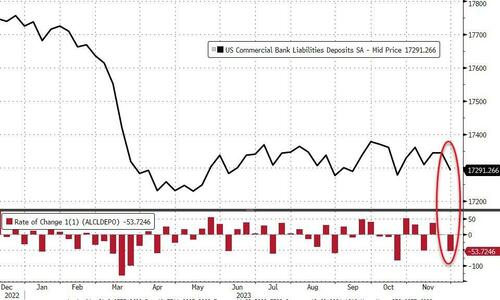
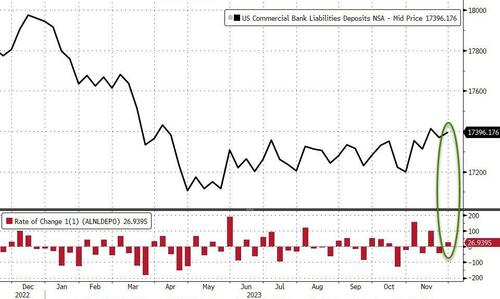
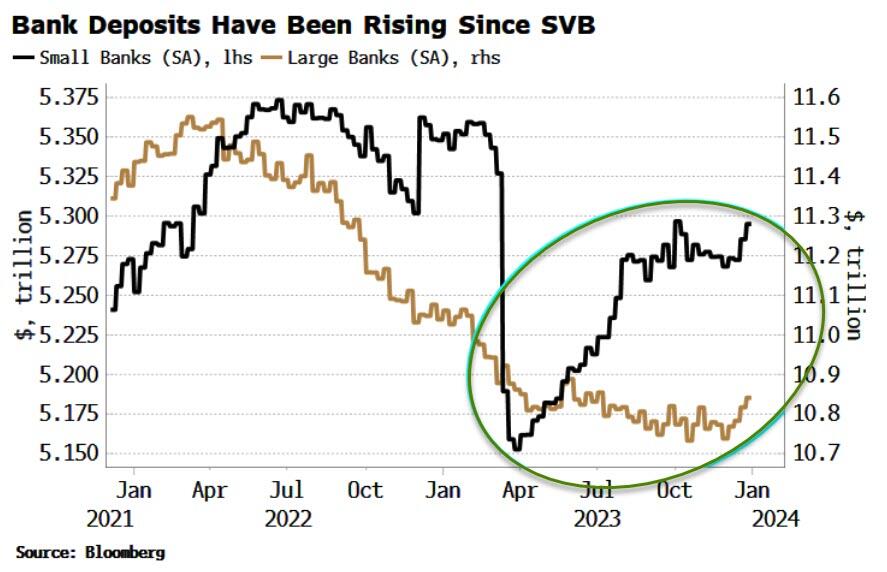
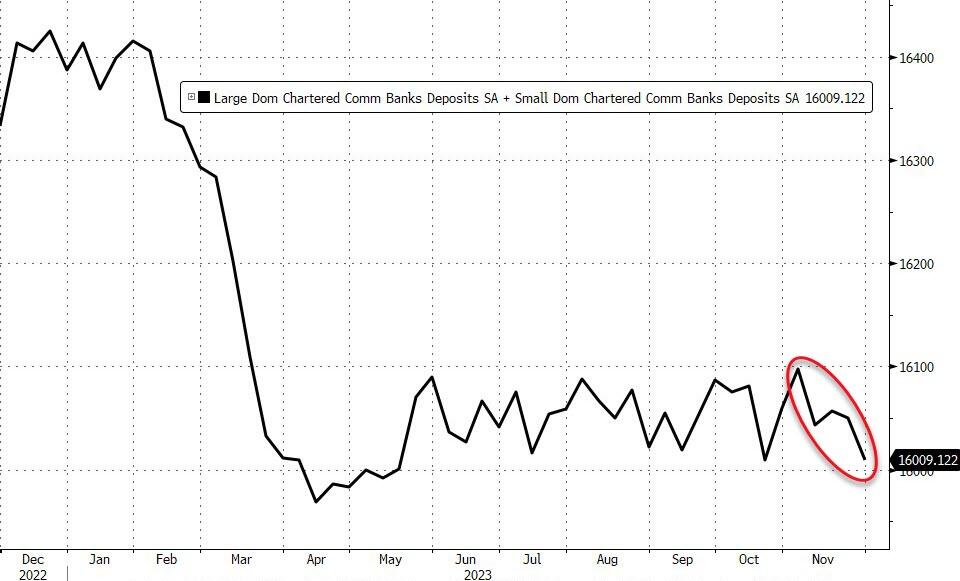
And it seems clear the emergency is over. Deposits of small banks (for whom the program was aimed at) have been rising since their drop after SVB’s collapse (both on a seasonally and non-seasonally adjusted basis). That, along with the quiescent fed funds market, suggests banks are not facing stress. Furthermore, the Fed’s pivot has also increased collateral values, making banks’ hold-to-maturity portfolios less underwater.
The BTFP’s expiry would mean another ongoing drain on reserves as the loans expire over the year.
With the Fed now seemingly focused on liquidity in this new paradigm, this adds to reasons why the central bank may cut earlier in the year.
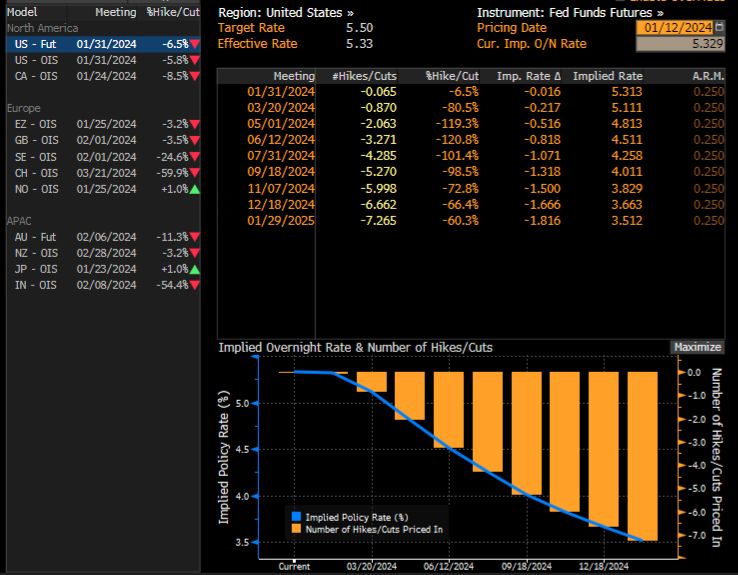
The market is currently pricing 17 bps of cuts for the March 20 meeting, so that’s not an attractive risk-reward, but at under ~7 bps or so that proposition changes – more so if the BTFP is no more.
Meanwhile, the futures market is forecasting rate cuts of over 200 basis points!
The Federal Reserve is a private enterprise that works with The Federal government like in the film “Prometheus” or “Chariots of the Clods.”
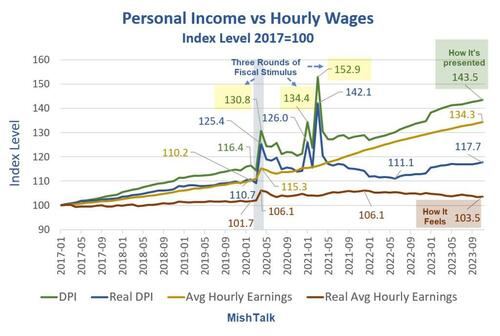
Income is rising and so are wages. Even real income is up. But real wages are another matter.
Personal income data from the BEA, hourly wages from the BLS, real hourly earnings and chart by Mish.
Personal Income vs Hourly Wages Notes
DPI means Disposable Personal Income. Disposable means after taxes.
Real DPI means inflation adjusted using the Personal Consumption Expenditures (PCE) deflator. Real DPI is a BEA calculation.
Average hourly earning are for production and nonsupervisory workers.
Real wages are deflated by the Consumer Price Index (CPI) not the PCE.
The BLS does not report a real hourly wage. I used the CPI-W index for production and nonsupervisory workers, produced by the BLS, as the deflator.
Personal Income Definition
The BEA defines personal income as “Income that people get from wages and salaries, Social Security and other government benefits, dividends and interest, business ownership, and other sources.”
Rental income is a part of other sources.
Three Rounds of Fiscal Stimulus
Round 1, March 2020: $1,200 per income tax filer, $500 per child(CARES Act) – Trump
Round 2, December 2020: $600 per income tax filer, $600 per child (Consolidated Appropriations Act, 2021) – Trump
Round 3, March 2021: $1,400 per income tax filer, $1,400 per child (American Rescue Plan Act) – Biden
The three rounds of free money fiscal stimulus (literally a helicopter drop), plus eviction moratoriums put an unprecedented amount of money in people’s hands. In addition, unemployment insurance paid people more to not work than they received working.
The third round of stimulus under Biden was totally unwarranted. However, it is also worth noting that Trump wanted a much bigger second stimulus package than the Republican Congress gave him. Trump is no fiscal hero.
The three stimulus packages, on top of supply chain disruptions, energy disruptions due to the war in Ukraine, and Bidenomics in general, set in motion the biggest wave of inflation in over 30 years.
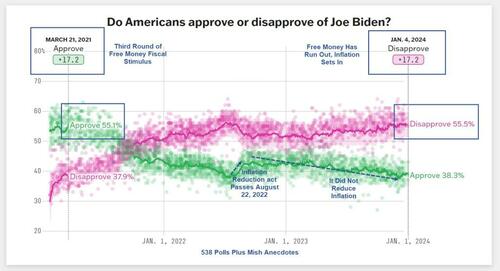
Biden went from an approval rating of 17.2 percent to a disapproval rating of 17.2 percent.
Peak Free Money
In addition to declining real wages, perhaps Biden’s big problem is the free money has run out.
Biden’s popularity peaked in March of 2021 along with stimulus. Was that a honeymoon impact or peak free money?
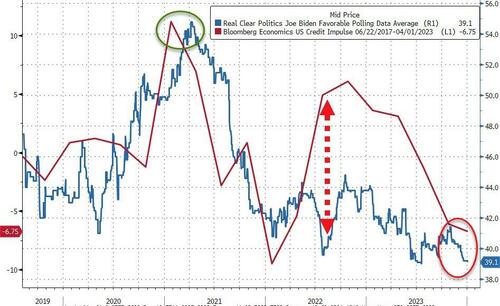
[ZH: While not a perfect indicator, the lagged US credit impulse perhaps provides a proxy for US fiscal excess and when overlaid with Biden’s approval rating, it is clear that 2022’s re-acceleration did nothing for people’s faith in him… and it’s only got worse…]
I suspect a bit of each coupled with hope of more free money, especially student loan forgiveness.
Sending free money to Israel and Ukraine does not help perceptions of how Biden is doing. And neither does the border or ridiculous energy regulations that cost people money.
Biden keeps telling people what a great job he has done.
I don’t believe it and most don’t either. And that shows up in the polls no matter what reason you assign.
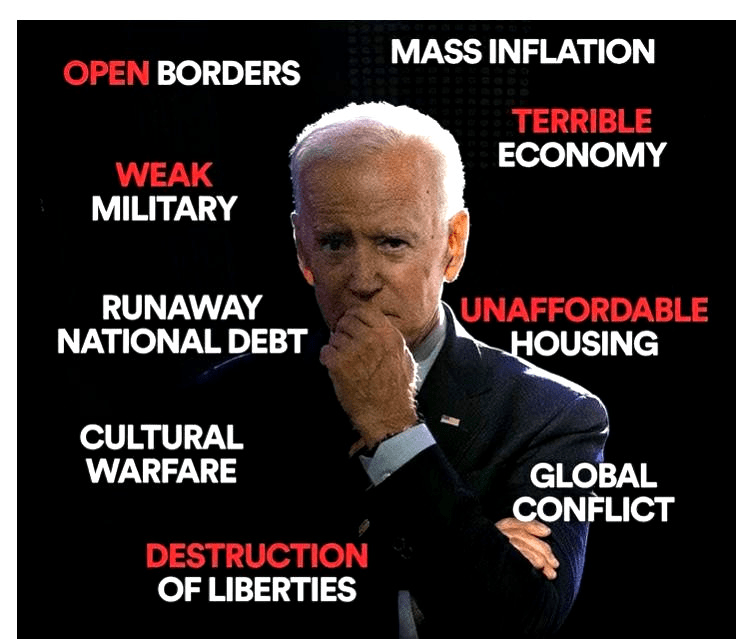
Can Biden scrounge up some more stimulus? Because the private sector is not doing well under “Open Borders Biden.”
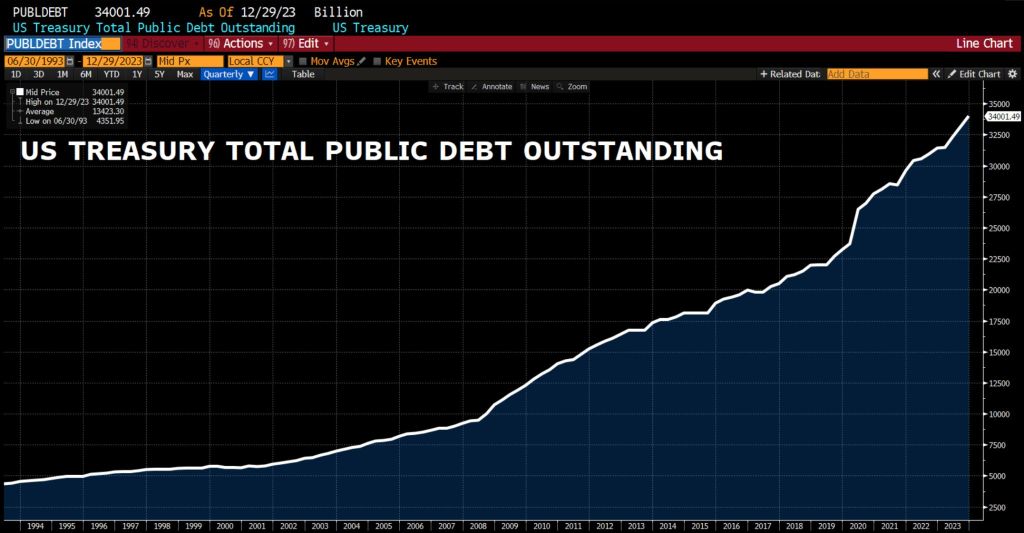
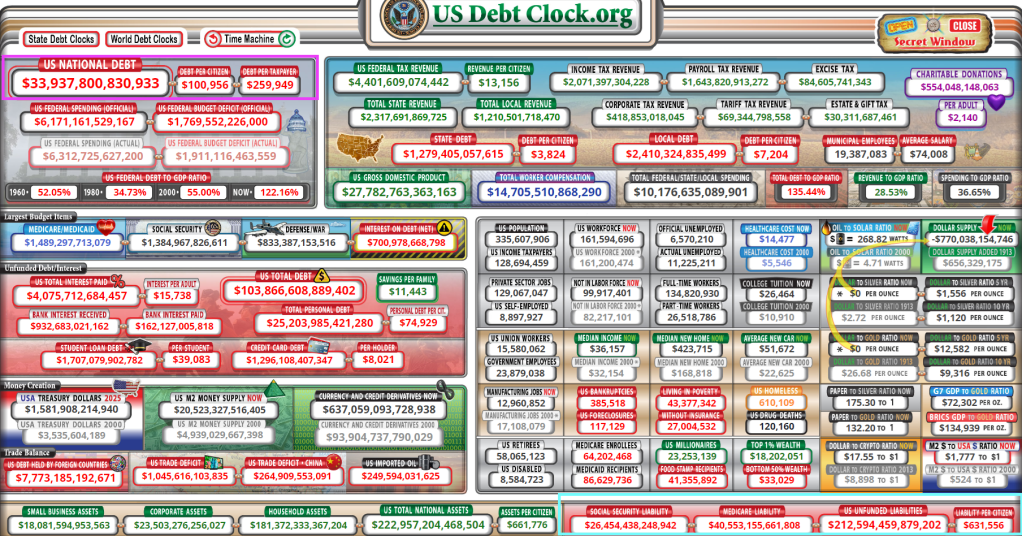
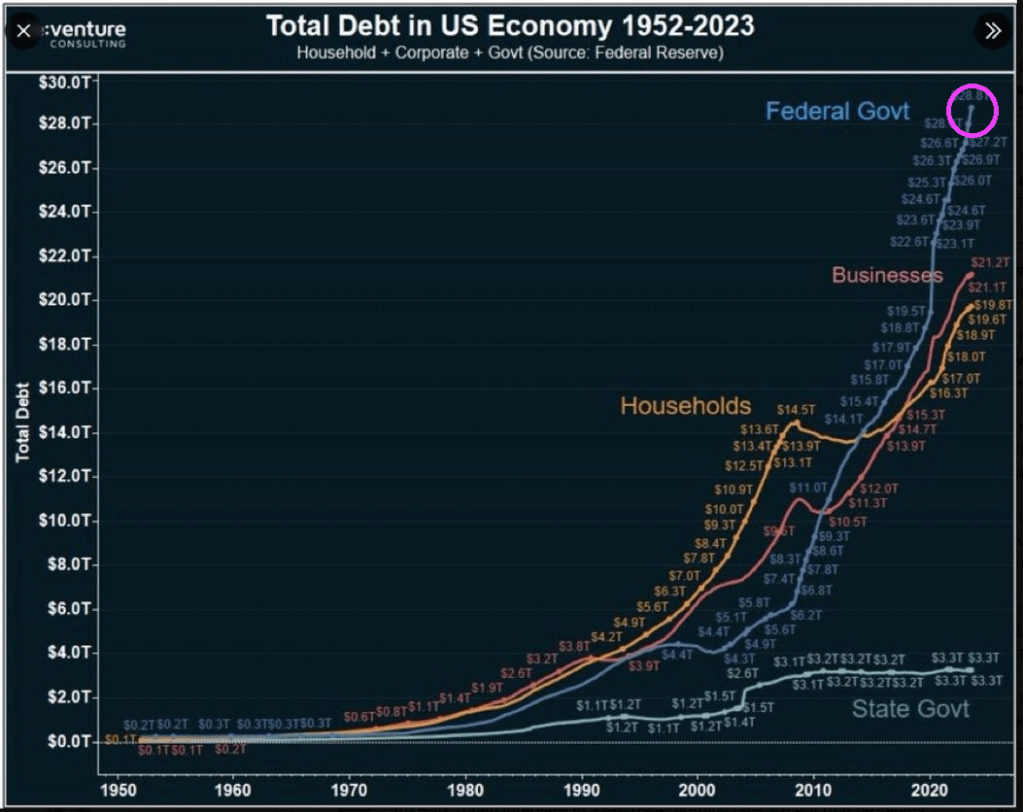
In another episode of “Government Gone Wild” we see that total Federal debt just broke through the $34 trillion mark.
Some context: US debt increased by…
$1 trillion in the past 3 months
$2 trillion in the past 6 months
$4 trillion in the past 2 years
$11 trillion in the past 4 years
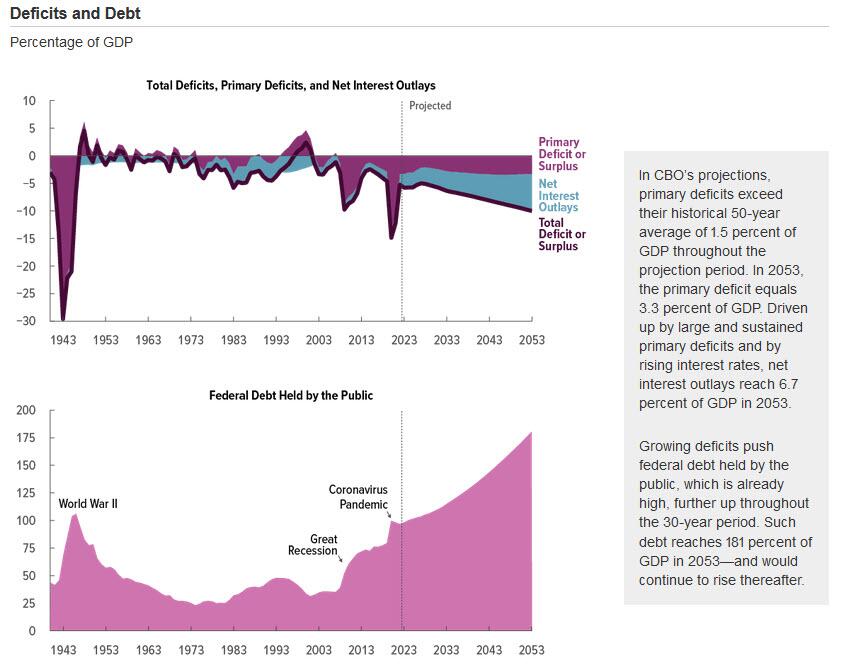
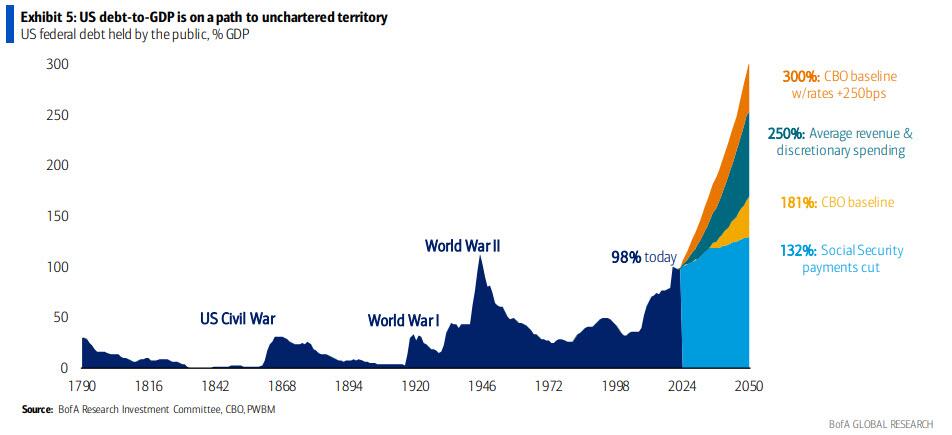
The Congressional Budget Office (CBO) is flashing the alarm.
Reckless spending in Washington DC by the administration and Congress is projected to drive US Debt to GDP to rise like the nuclear reactor in the film K-19: The Widowmaker.
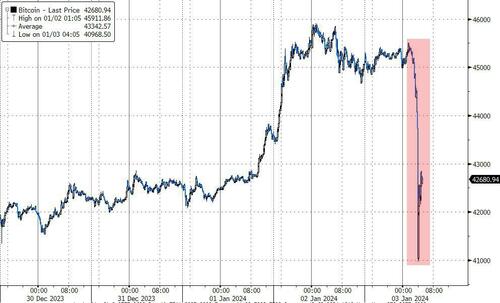
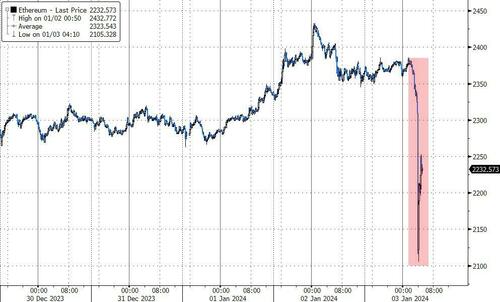
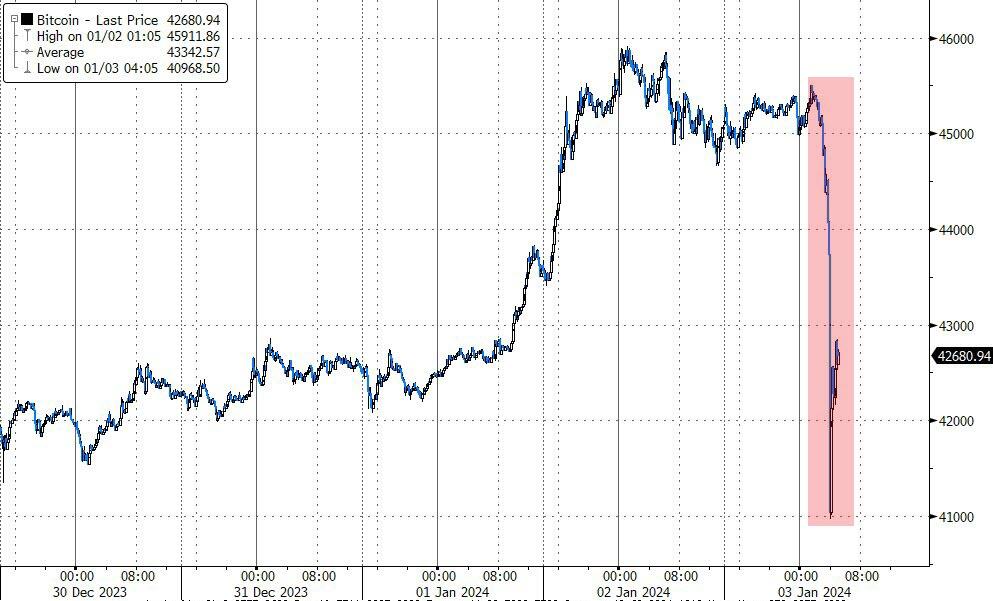
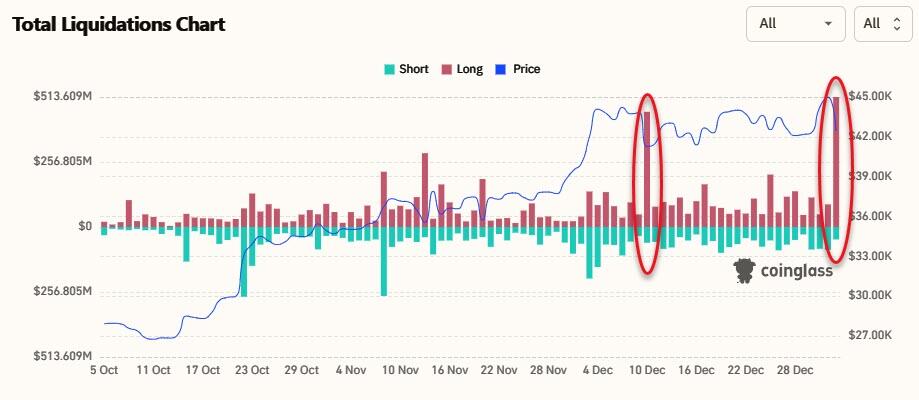
Today the crypto market flash-crashed this morning with Bitcoin instantaneously puking from $45,500 to $41,000…
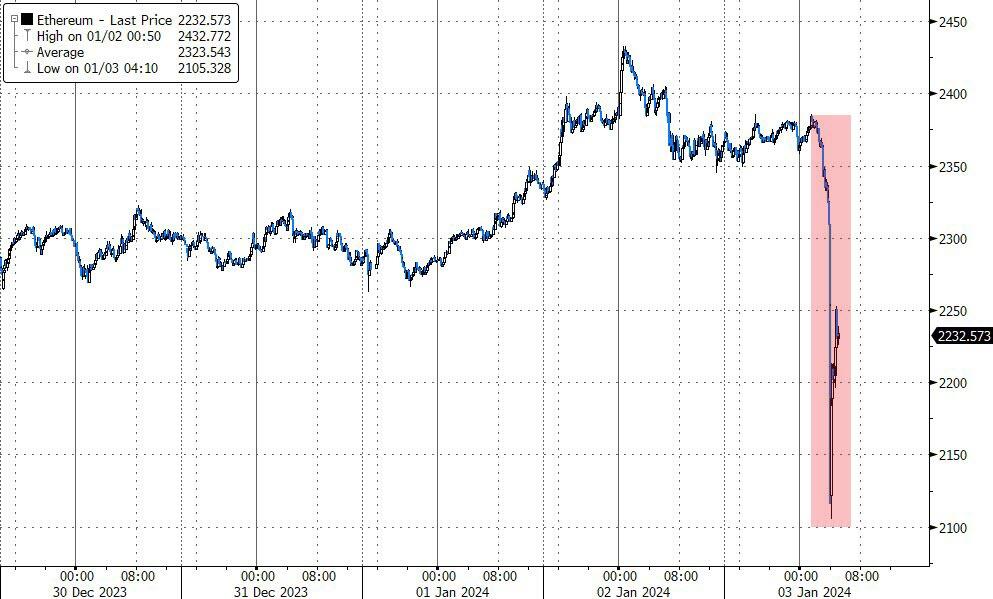
And Ethereum followed suite…
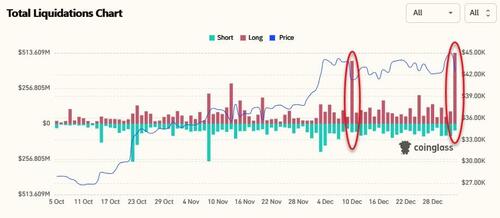
Over $550 million in crypto long positions were liquidated in the past 24 hours, per data from CoinGlass, including $104 million in Bitcoin longs in the past hour alone.
The extremely volatile cryptos are rallying. But still down on the day.
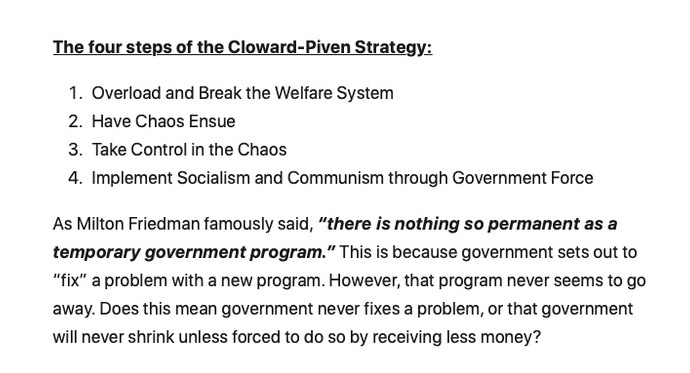
Biden is lucky in that many portray him as a senile, dumb US Senator who happens to be President. Perhaps Biden is actually insidious allowing for open borders in the hopes of crashing the US economy by overloading the welfare system and driving national debt through the roof?
Biden, like Clinton and Obama before him, has been a Cloward-Piven discipile. Who are Cloward and Piven you ask? Two sociologists at Columbia University. (Cloward pass away in 2001, while Piven is still living). Here are Cloward and Piven attending the Voter Registration (aka, Motor Voter Law) Act signing by President “Willie Slick” Clinton.
The Cloward-Piven strategy is to overload the welfare system to the point of chaos, take control and implement Marxism through government force. To that extent, Biden and his incoherent sidekick, Kamala Harris, have been wildly successful. Sociology and Political Science are two of the most worthless college degrees (with Management in the Business School being a close third). Taking advice from Sociologists or Political Science majors or faculty is insane.
Biden should be familiar to Latin American, African and Chinese immigrants who are used to Marxist dictators who try to have their political opponents taken of the ballots and prosecucted.
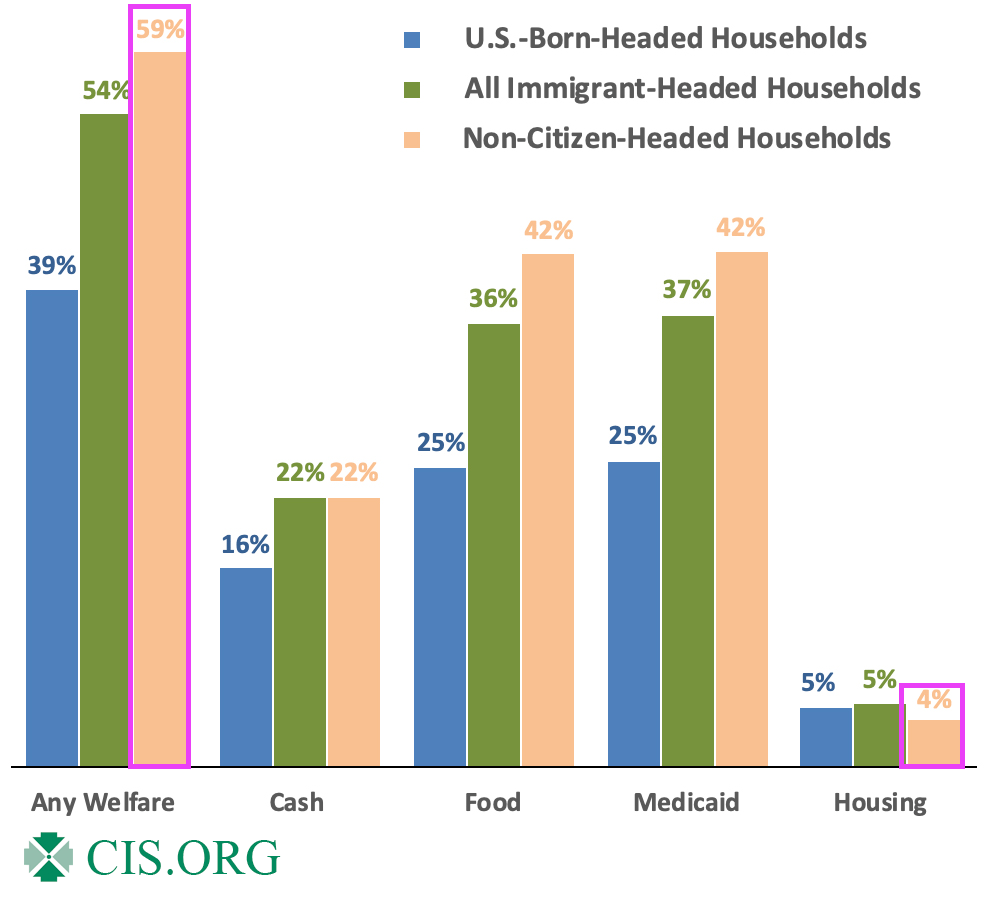
Yes, the US welfare rolls are overflowing with illegal immigrants and unfunded liabilities are out of control. Perhaps Biden and Harris should be replaced with Cloward and Piven (even though Cloward is dead). But Newsom, Hillary Clinton and Michelle Obama share the idiocy of the Columbia sociology faculty members. Hillary even teaches a course at Columbia!
What about compassion for immigrants? Great! Let’s close the borders and return to LEGAL immigration to halt human trafficking, Fentanyl imports, and cartels controlling the border. But Cloward-Piven’s strategy is best accomplished with open borders and weak-willed politicians.
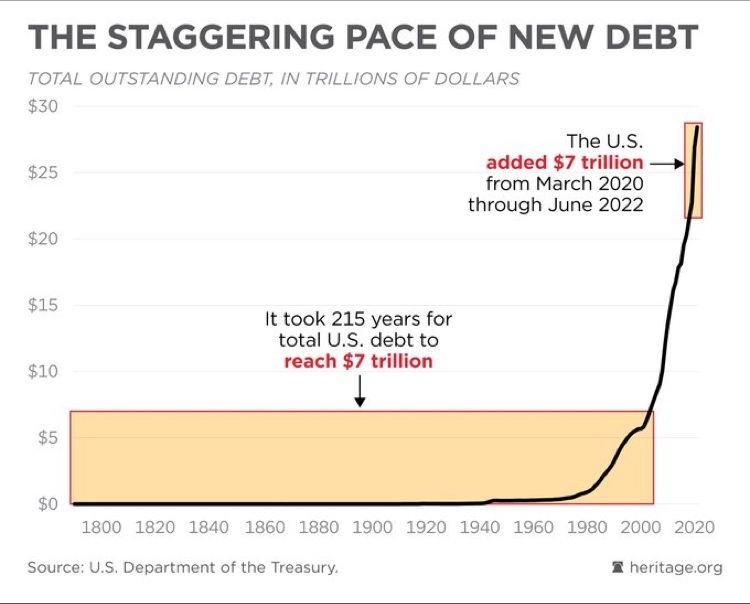
The Federal government added $7 trillion in debt since 2020 while it took 215 years to get to $7 trillion before Covid and Bidenomics.
In what can simply be called fiscal insanity, The Federal government is borrowing like there is no tomorrow (given that Biden is 81 years old, this isn’t far off) displacing businesses and households. Heaven help us if the Federal government has to borrow more money to fight a real war like World War II.
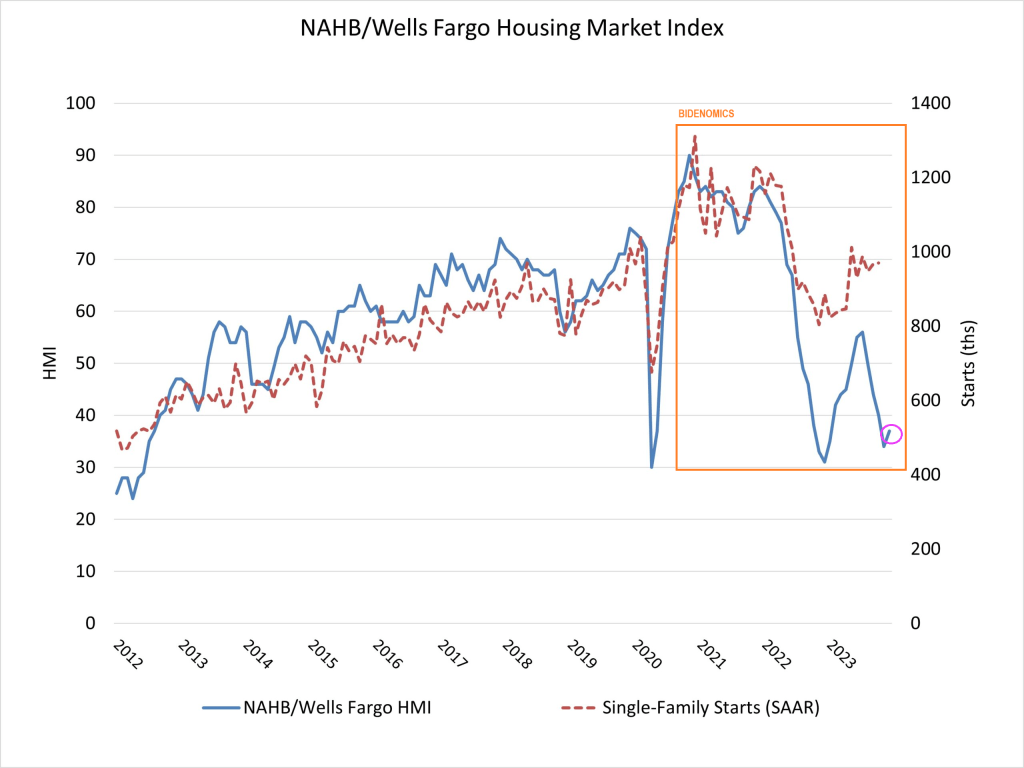
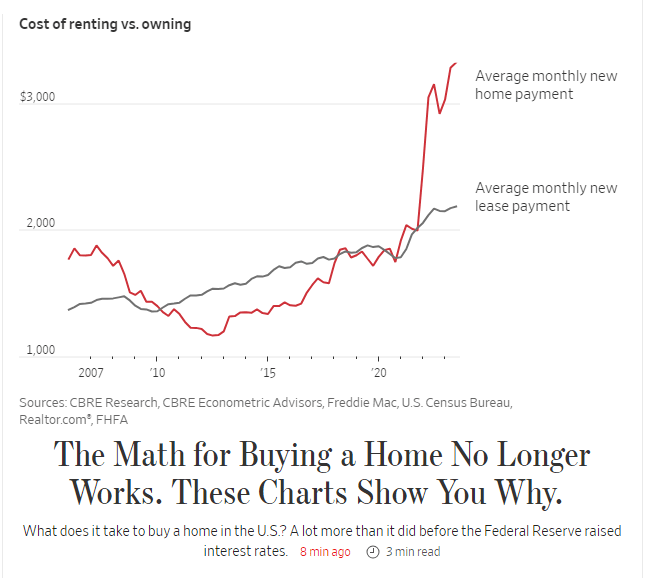
So, the massive Federal debt gorging isn’t helping the housing market.
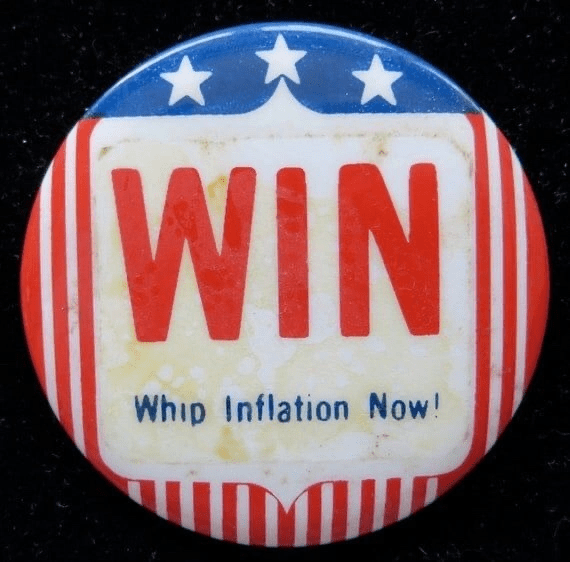
President Gerald For (R-MI) might be best known for his silly attempt at “whip inflation NOW” by having “Music Man” Meredith Wilson write a song: “Whip Inflation Now!” But the second line has been forgotten: “Eat crow instead of cow.” That second line is appropriate for Bidenomics which has left America’s middle class eating crow in the housing market.
The Wall Street Journal had an interesting piece showing the rise of 30-year fixed rate mortgage payments under Biden where the average monthly new mortgage payment is now $3,222, up from $1,787, up 86%!
The 86% rise in mortgage payments is two fold. First, home prices are up 33.2% under Biden and the 30-year mortgage rate is up 181%.
Yes, Americans are eating crow under the utter failure known as Bidenomics: top down government mandates for massive green energy and other nonsense.
The song “Running on Empty” by Jackson Browne comes to mind when analyzing the state of American banking, especially regional banks.
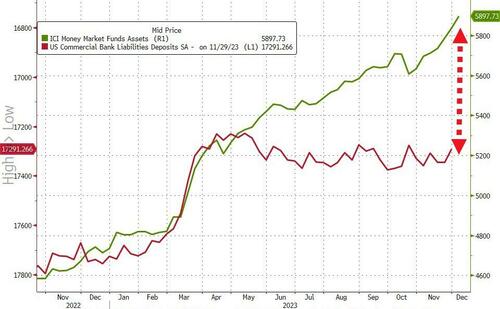
Yesterday we found out that inflows to money-market funds continue to be huge ($290BN in six weeks), and more importantly, regional banks’ usage of The Fed’s BTFP bailout facility surged to a new record high (even as regional banks surged…
Source: Bloomberg
And so, with that shitshow in mind, we await the glorious manipulation of The Fed’s bank deposits data to reinforce that equity confidence.
On a seasonally-adjusted basis, banks saw a $53.7BN deposit outflow…
Source: Bloomberg
However, on a non-seasonally-adjusted basis, deposits rose by $27BN…
Source: Bloomberg
And even with the outflows (SA), the divergence between soaring money-market funds and bank deposits continues to widen…
Source: Bloomberg
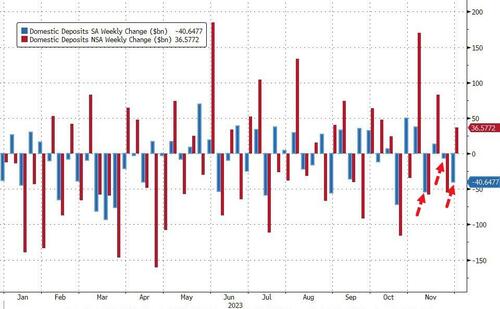
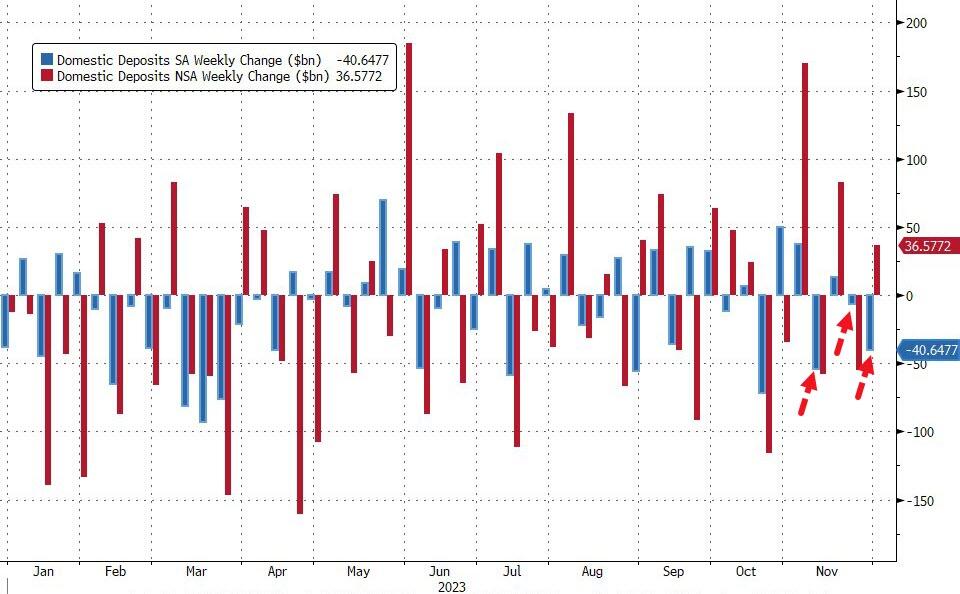
Excluding foreign bank deposits, domestic banks saw the third week of the last four of deposit outflows (-$40.6BN SA) with Large banks -$35BN (SA) and Small banks losing $5.7BN (SA). On an NSA basis, domestic banks saw inflows of $36.5BN last week with Large banks adding $32BN and Small banks adding $4BN…
Source: Bloomberg
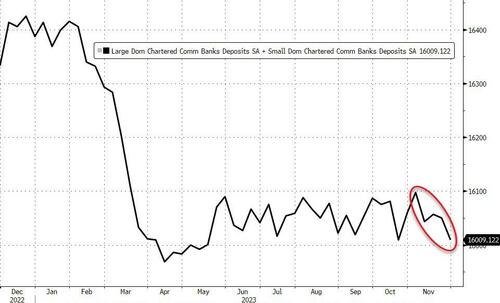
That adds up to $88BN (SA) of deposit outflows in the last four weeks (bank to its lowest total since May…
Source: Bloomberg
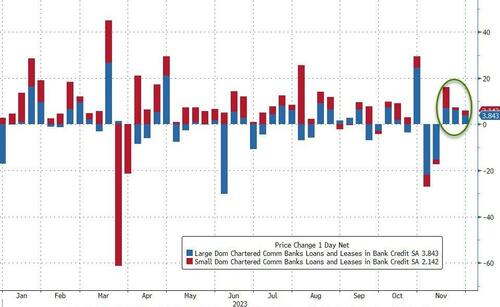
And on the other side of the ledger, despite deposits declining SA, loan volumes increased (SA) for the third week in a row with Small banks adding $2.1BN and Large banks adding $3.8BN…
Source: Bloomberg
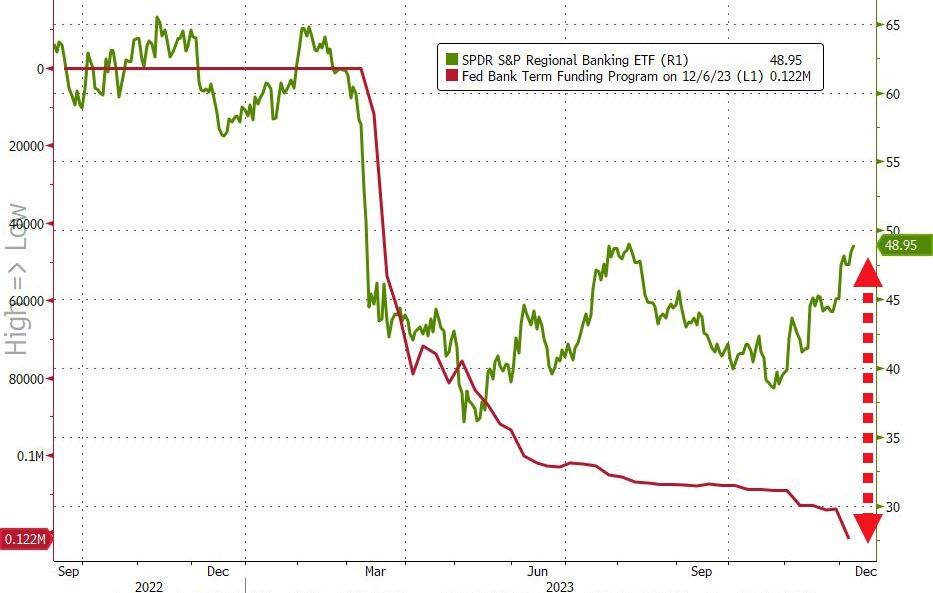
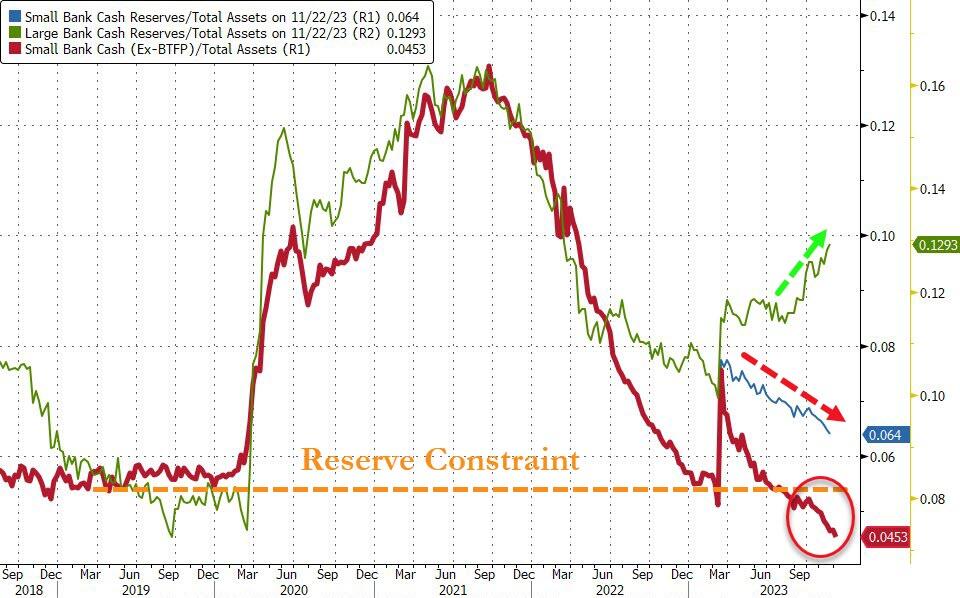
Finally, the key warning sign continues to trend ominously lower (Small Banks’ reserve constraint), supported above the critical level by The Fed’s emergency funds (for now)…
Source: Bloomberg
As the red line shows, without The Fed’s help, the crisis is back (and large bank cash needs a home – green line – like picking up a small bank from the FDIC).
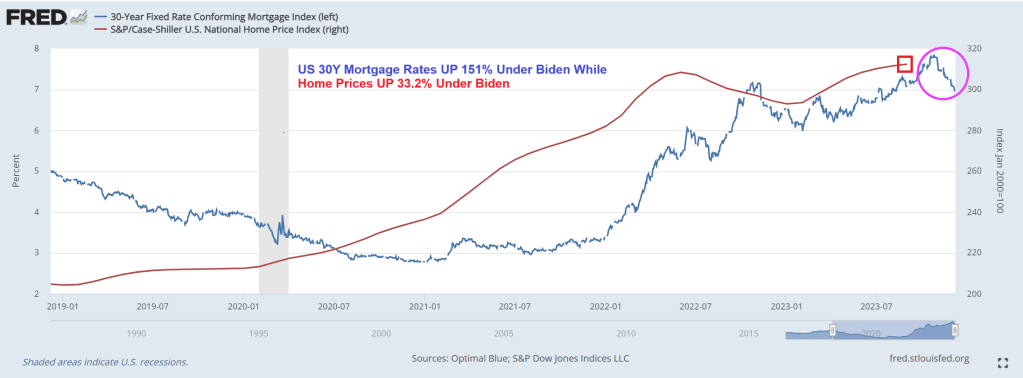
Mortgage rates, despite coming down recently, are still up 151% under Biden. And home prices are up 33.2%. So much for affordable housing for those renting.
So, “Running on Empty” applies to middle class and their ability to afford housing.
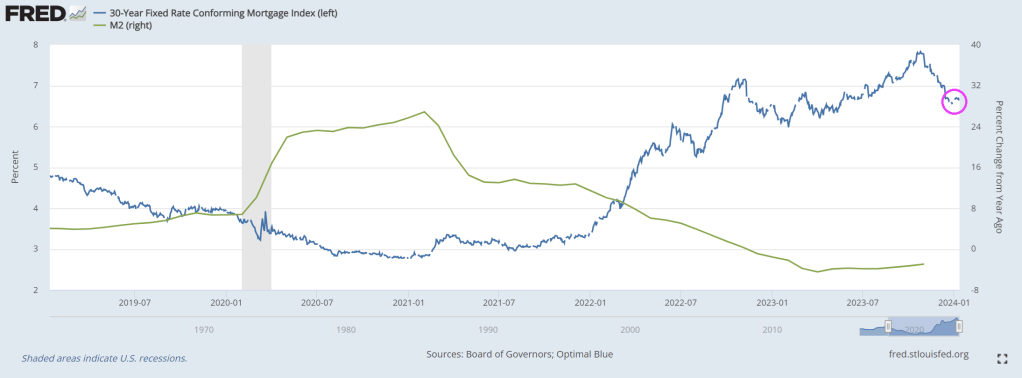
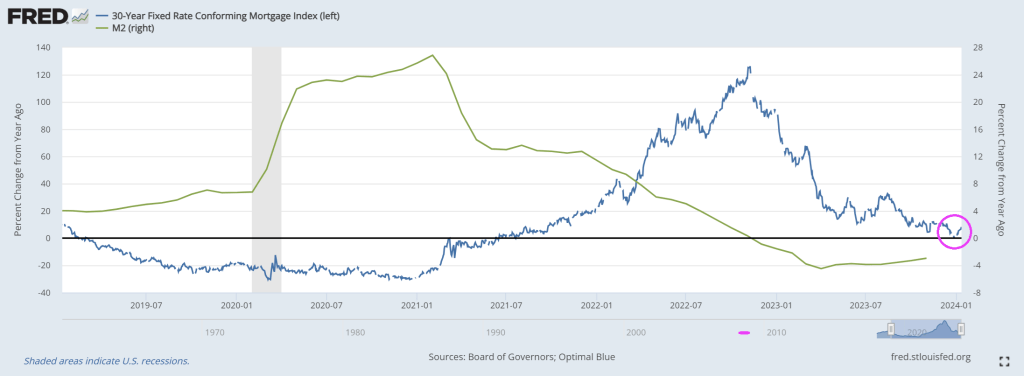
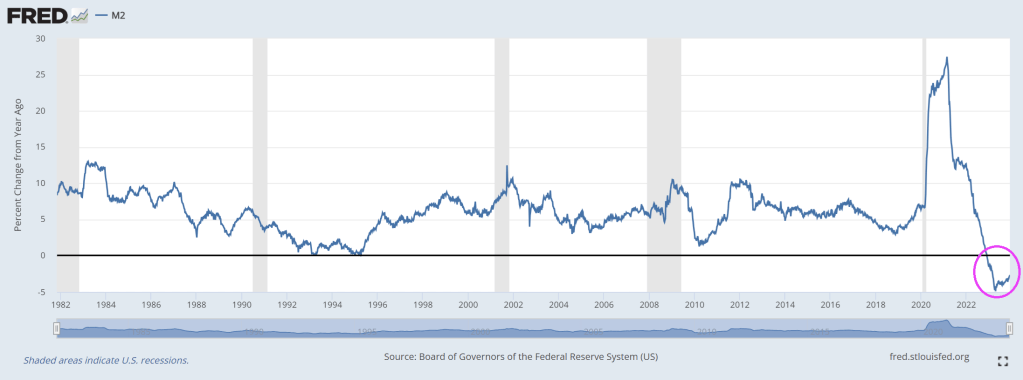
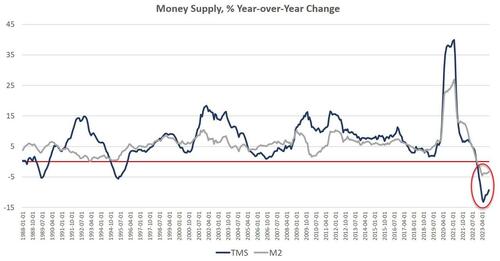
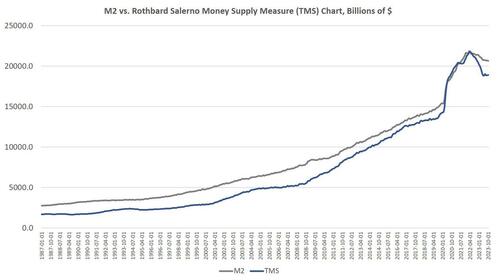
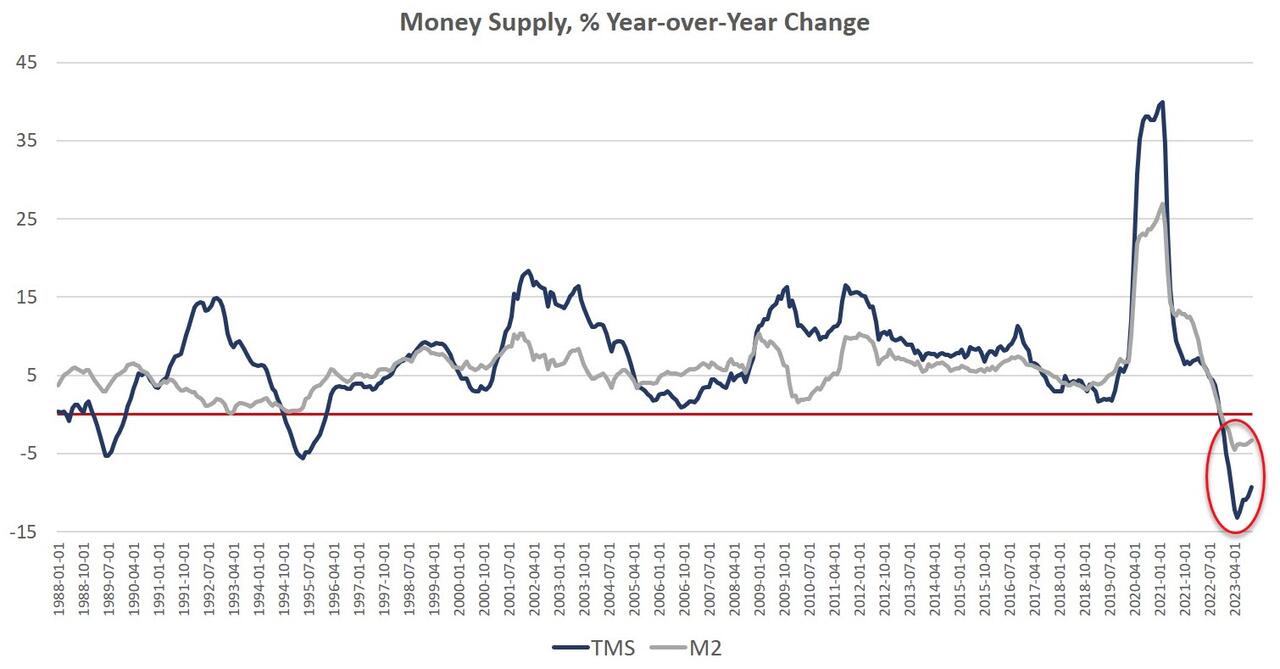
Since April 2021, money supply growth has slowed quickly, and since November, we’ve been seeing the money supply repeatedly contract year over year. The last time the year-over-year (YOY) change in the money supply slipped into negative territory was in November 1994. At that time, negative growth continued for fifteen months, finally turning positive again in January 1996.
Money-supply growth has now been negative for twelve months in a row. During October 2023, the downturn continued as YOY growth in the money supply was at –9.33 percent. That’s up slightly from September’s rate decline which was of –10.49 percent, and was far below October 2022’s rate of 2.14 percent. With negative growth now falling near or below –10 percent for the eighth month in a row, money-supply contraction is the largest we’ve seen since the Great Depression. Prior to this year, at no other point for at least sixty years has the money supply fallen by more than 6 percent (YoY) in any month.
The money supply metric used here—the “true,” or Rothbard-Salerno, money supply measure (TMS)—is the metric developed by Murray Rothbard and Joseph Salerno, and is designed to provide a better measure of money supply fluctuations than M2. (The Mises Institute now offers regular updates on this metric and its growth.)
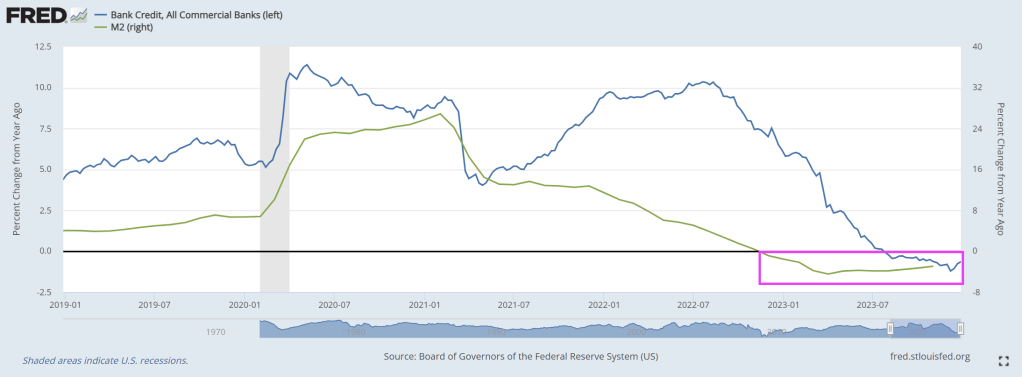
In recent months, M2 growth rates have followed a similar course to TMS growth rates, although TMS has fallen faster than M2. In October 2023, the M2 growth rate was –3.35 percent. That’s down from September’s growth rate of –3.35 percent. October 2023’s growth rate was also well down from October 2022’s rate of 1.42 percent.
Money supply growth can often be a helpful measure of economic activity and an indicator of coming recessions. During periods of economic boom, money supply tends to grow quickly as commercial banks make more loans. Recessions, on the other hand, tend to be preceded by slowing rates of money supply growth.
It should be noted that the money supply does not need to actually contract to signal a recession and the boom-bust cycle. As shown by Ludwig von Mises, recessions are often preceded by a mere slowing in money supply growth. But the drop into negative territory we’ve seen in recent months does help illustrate just how far and how rapidly money supply growth has fallen. That is generally a red flag for economic growth and employment.
The fact that the money supply is shrinking at all is remarkable because the money supply in modern times almost never gets smaller. The money supply has now fallen by $2.8 trillion (or 13.1 percent) since the peak in April 2022. Proportionally, the drop in money supply since 2022 is the largest fall we’ve seen since the Depression. (Rothbard estimates that in the lead-up to the Great Depression, the money supply fell by 12 percent from its peak of $73 billion in mid-1929 to $64 billion at the end of 1932.)
In spite of this recent drop in total money supply, the trend in money-supply remains well above what existed during the twenty-year period from 1989 to 2009. To return to this trend, the money supply would have to drop at least another $3 trillion or so—or 15 percent—down to a total below $15 trillion. Moreover, as of October, total money supply was still up 32 percent (or $4.6 trillion) since January 2020.
Since 2009, the TMS money supply is now up by nearly 186 percent. (M2 has grown by 141 percent in that period.) Out of the current money supply of $18.9 trillion, $4.6 trillion—or 24 percent—of that has been created since January 2020. Since 2009, $12.2 trillion of the current money supply has been created. In other words, nearly two-thirds of the total existing money supply have been created just in the past thirteen years.
With these kinds of totals, a ten-percent drop only puts a small dent in the huge edifice of newly created money. The US economy still faces a very large monetary overhang from the past several years, and this is partly why after eighteen months of slowing money-supply growth, we are only now starting to see a slowdown in the labor market. (For example, job openings have fallen 22 percent over the past year, but have not yet returned to pre-covid levels.) The inflationary boom has not yet ended.
Nonetheless, the monetary slowdown has been sufficient to considerably weaken the economy. The Philadelphia Fed’s manufacturing index is in recession territory. The Leading Indicators index keeps looking worse. The yield curve points to recession. Temp jobs were down, year-over-year, which often indicates approaching recession. Default rates are rising.
Money Supply and Rising Interest Rates
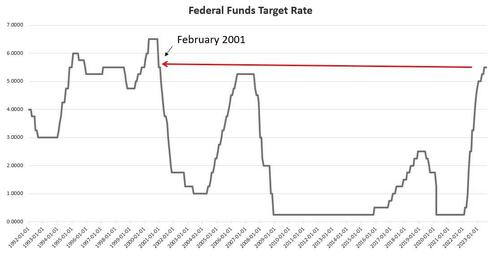
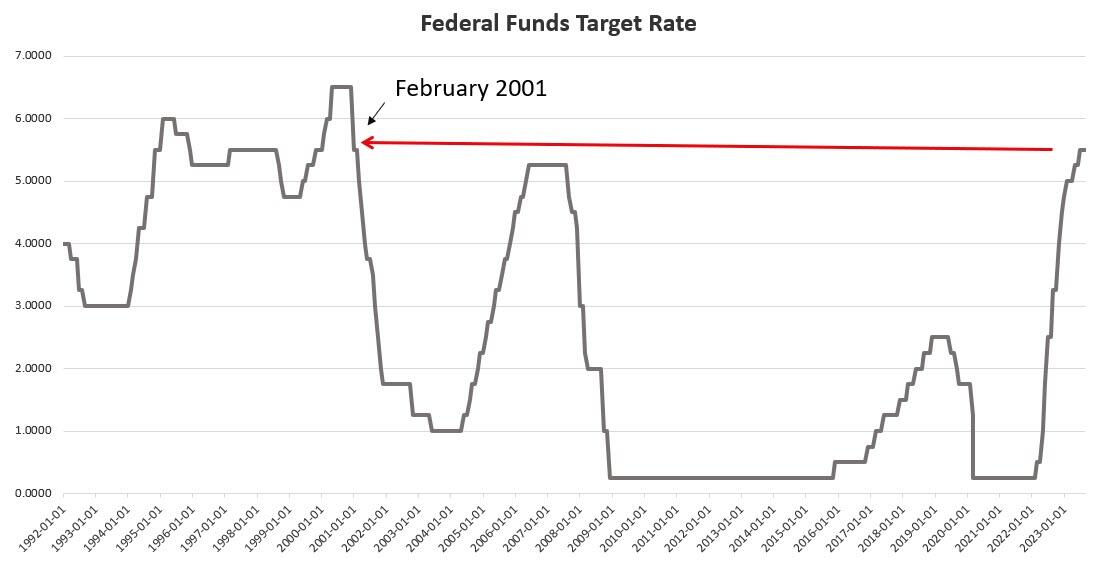
An inflationary boom begins to turn to bust once new injections of money subside, and we are seeing this now. Not surprisingly, the current signs of malaise come after the Federal Reserve finally pulled its foot slightly off the money-creation accelerator after more than a decade of quantitative easing, financial repression, and a general devotion to easy money. As of early December, the Fed has allowed the federal funds rate to rise to 5.50 percent, the highest since 2001. This has meant short-term interest rates overall have risen as well. In October, for example, the yield on 3-month Treasurys reached 5.6 percent, the highest level measured since December 2000.
Without ongoing access to easy money at near-zero rates, banks are less enthusiastic about making loans, and many marginal companies will no longer be able to stave off financial trouble by refinancing or taking out new loans. Commercial bankruptcy filings increased sizably during 2023, and continue to surge into the last quarter of the year. As reported by Monitor Daily:
The bankruptcy filing by WeWork in November propelled November commercial Chapter 11 filings to 842, an increase of 141% compared with the 349 filings registered in November 2022, according to data provided by Epiq Bankruptcy.
The case filed by WeWork on Nov. 6 included 517 related filings, according to analysis from the American Bankruptcy Institute, representing the third-most related filings in a case since the U.S. Bankruptcy Code became effective in 1979.
Overall commercial filings increased 21% to 2,252 in November, up from the 1,864 commercial filings registered in November 2022. Small business filings, captured as Subchapter V elections within Chapter 11, increased 79% to 181 in November, up from 101 in November 2022.
There were 37,860 total bankruptcy filings in November, a 21% increase from the November 2022 total of 31,187. Individual bankruptcy filings also registered a 21% year-over-year increase, as the 35,608 in November represented an increase over the 29,323 filings in November 2022. There were 20,250 individual Chapter 7 filings in November, a 23% increase compared with the 16,421 filings recorded in November 2022, and there were 15,280 individual Chapter 13 filings in November, a 19% increase compared with the 12,862 filings last November.
Lending for private consumption is getting more expensive also. In October, the average 30-year mortgage rate rose to 7.62 percent, the highest point reached since November 2000.
These factors all point toward a bubble that is in the process of popping. The situation is unsustainable, yet the Fed cannot change course without reigniting a new surge in price inflation. Although some professional economists insist that price inflation has all but disappeared, the sentiment on the ground is clearly one in which most workers believe their wages are not keeping up with rising prices. Any surge in prices would be especially problematic given the rising cost of living. Ordinary Americans face a similar problem with home prices. According to the Atlanta Fed, the housing affordability index is now the worst it’s been since 2006, in the midst of the Housing Bubble.
If the Fed reverses course now, and embraces a new flood of new money, prices will only spiral upward. It didn’t have to be this way, but ordinary people are now paying the price for a decade of easy money cheered by Wall Street and the profligates in Washington. The only way to put the economy on a more stable long-term path is for the Fed to stop pumping new money into the economy. That means a falling money supply and popping economic bubbles.
But it also lays the groundwork for a real economy – i.e., an economy not built on endless bubbles – built by saving and investment rather than spending made possible by artificially low interest rates and easy money.
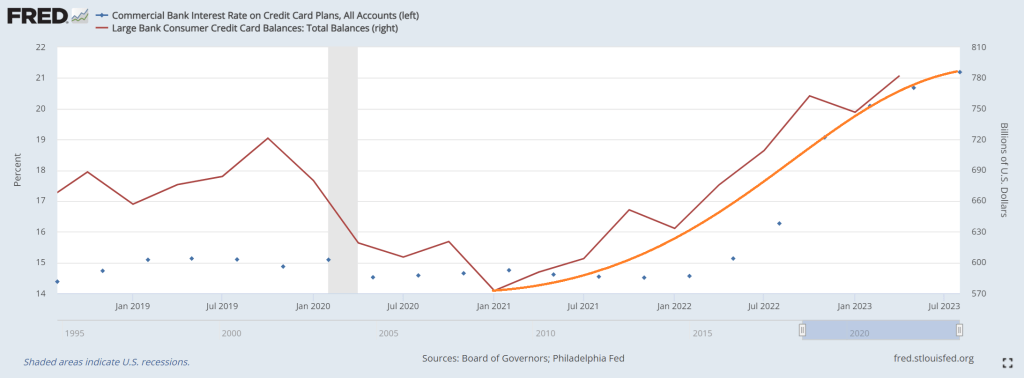
Then we have US consumers, attempting to cope with Biden’s inflation, by paying all-time highs on credit cards while trying to service ever-growing credit card balances.


You must be logged in to post a comment.