And much of the debt burden falls on the middle class.
Serious auto delinquencies are on the rise.
And lowest earners saw the biggest increase in credit card delinquenices.
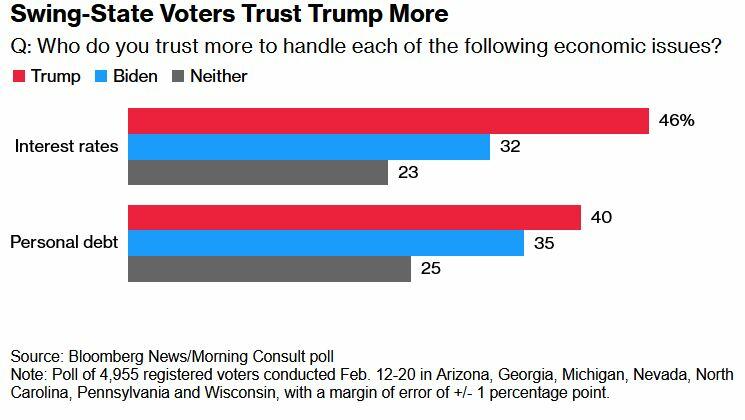
And who voters prefer as of today? Trump on interest rates and personal debt.
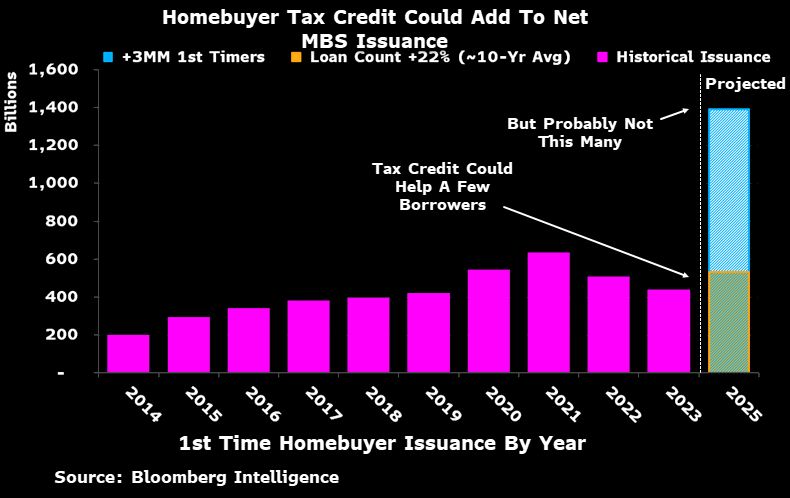
In addition to the absurd idea of removing title searches for government-guaranteed mortgages (now rely on attorney opinions), the Biden Administration is considering a homebuyer tax credit … that likely won’t help much.
And if you want to see which lenders have the largest concentrations of commercial real estate (CRE) loans, BankOZK takes the cake as the most concentrated lender.
The more the Biden Administration tries to “help” make housing more affordable, paradoxically makes housing even MORE unaffordable.
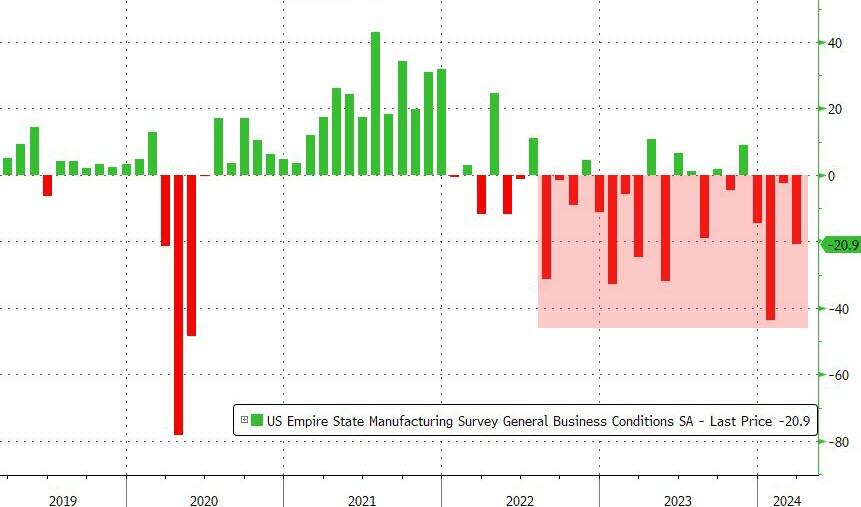
The NY Fed’s Empire State Manufacturing crashed and burned in March. NYFRB’s general business conditions index plunged 18.5pts in March to -20.9. A reading below zero indicates contraction, and the measure was weaker than all estimates in a Bloomberg survey of economists. Hey, I though illegal immigrantion was good for the economy!!!
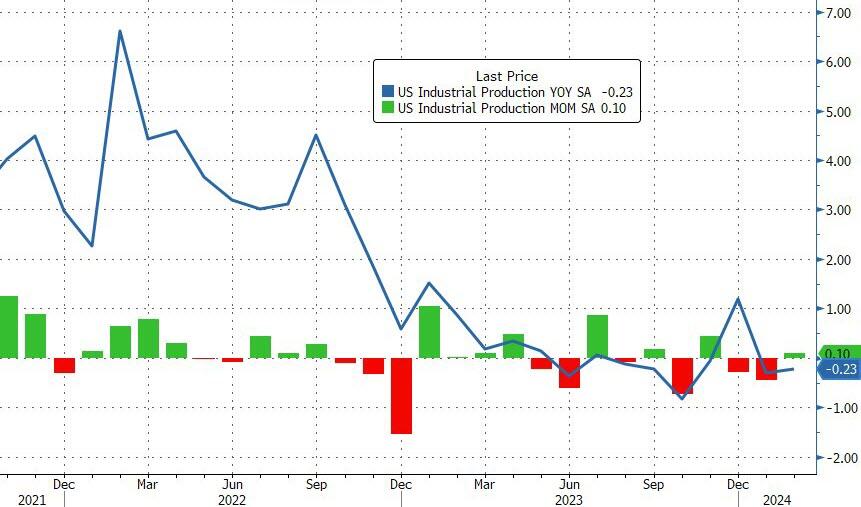
Industrial production fell tp -0.23 YoY in February, not a stellar sign for the economy.
1. Everybuddy: 100% of workforce 2. Wisense: 100% of workforce 3. CodeSee: 100% of workforce 4. Twig: 100% of workforce 5. Twitch: 35% of workforce 6. Roomba: 31% of workforce 7. Bumble: 30% of workforce 8. Farfetch: 25% of workforce 9. Away: 25% of workforce 10. Hasbro: 20% of workforce 11. LA Times: 20% of workforce 12. Wint Wealth: 20% of workforce 13. Finder: 17% of workforce 14. Spotify: 17% of workforce 15. Buzzfeed: 16% of workforce 16. Levi’s: 15% of workforce 17. Xerox: 15% of workforce 18. Qualtrics: 14% of workforce 19. Wayfair: 13% of workforce 20. Duolingo: 10% of workforce 21. Rivian: 10% of workforce 22. Washington Post: 10% of workforce 23. Snap: 10% of workforce 24. eBay: 9% of workforce 25. Sony Interactive: 8% of workforce 26. Expedia: 8% of workforce 27. Business Insider: 8% of workforce 28. Instacart: 7% of workforce 29. Paypal: 7% of workforce 30. Okta: 7% of workforce 31. Charles Schwab: 6% of workforce 32. Docusign: 6% of workforce 33. Riskified: 6% of workforce 34. EA: 5% of workforce 35. Motional: 5% of workforce 36. Mozilla: 5% of workforce 37. Vacasa: 5% of workforce 38. CISCO: 5% of workforce 39. UPS: 2% of workforce 40. Nike: 2% of workforce 41. Blackrock: 3% of workforce 42. Paramount: 3% of workforce 43. Citigroup: 20,000 employees 44. ThyssenKrupp: 5,000 employees 45. Best Buy: 3,500 employees 46. Barry Callebaut: 2,500 employees 47. Outback Steakhouse: 1,000 48. Northrop Grumman: 1,000 employees 49. Pixar: 1,300 employees 50. Perrigo: 500 employees
But, according to the government-supplied data…
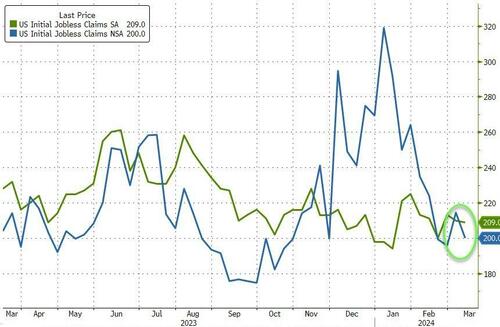
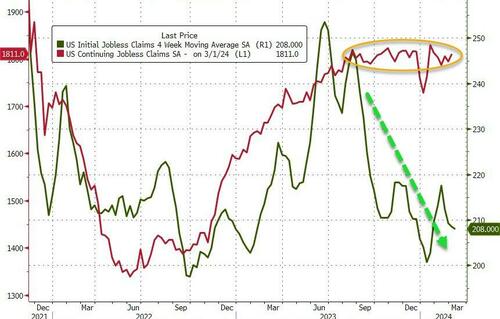
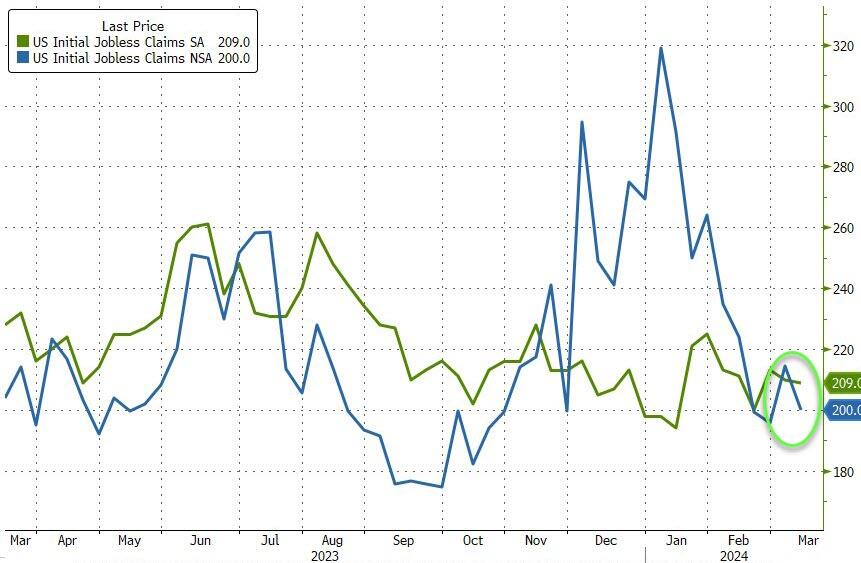
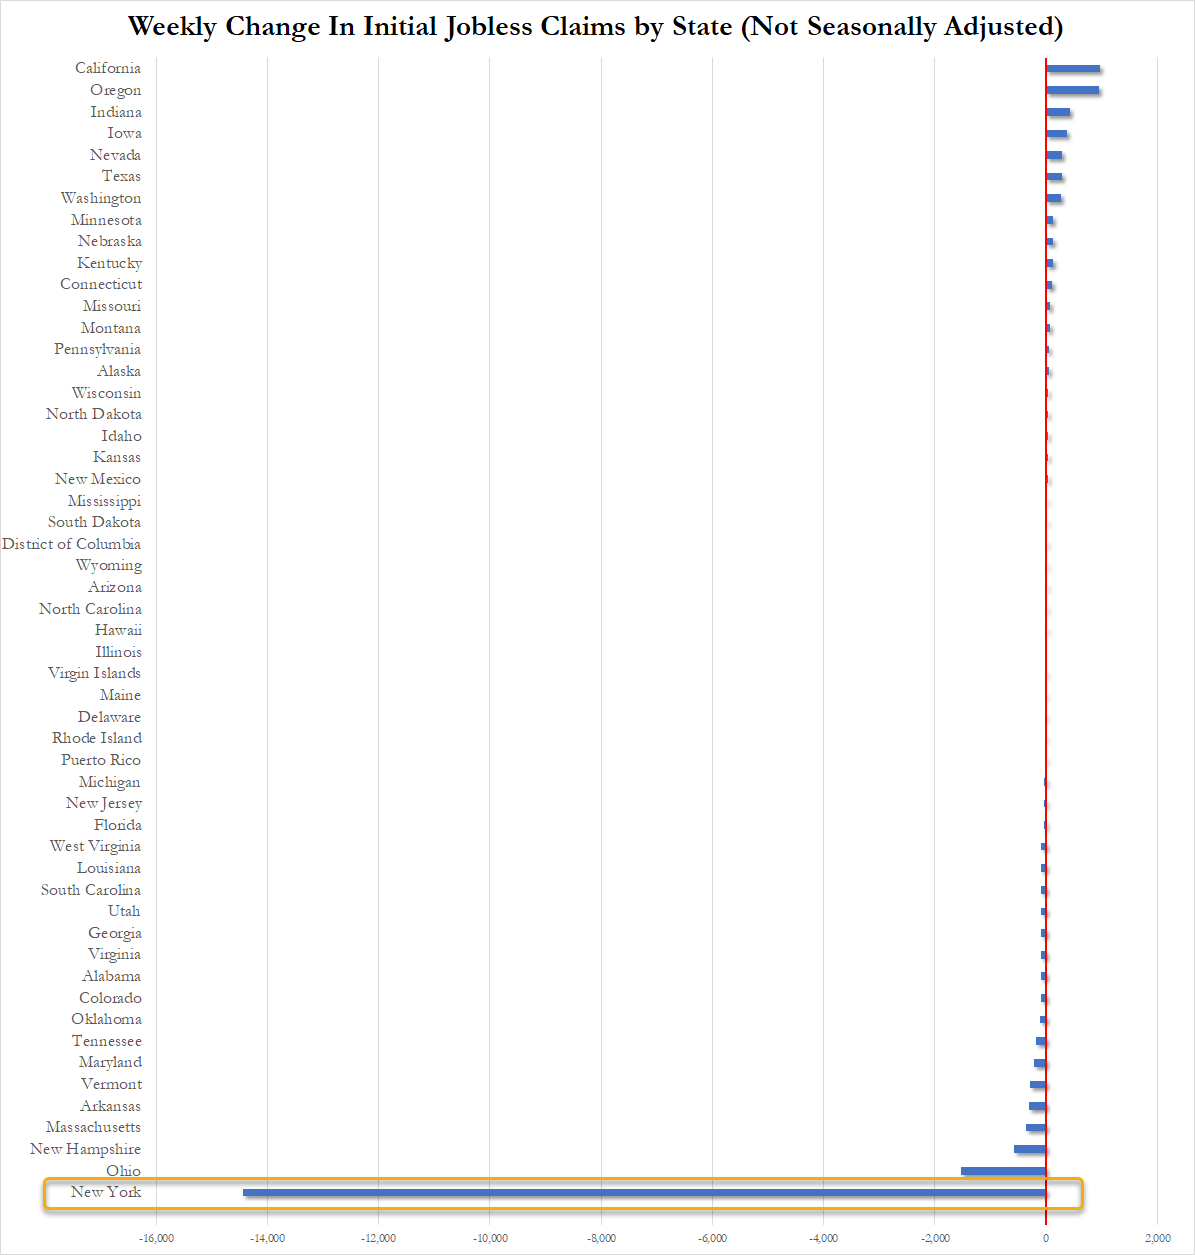
The number of American filing for jobless benefits for the first time last week dropped to 209k (vs 218k exp) with the NSA number tumbling to 200k…
Source: Bloomberg
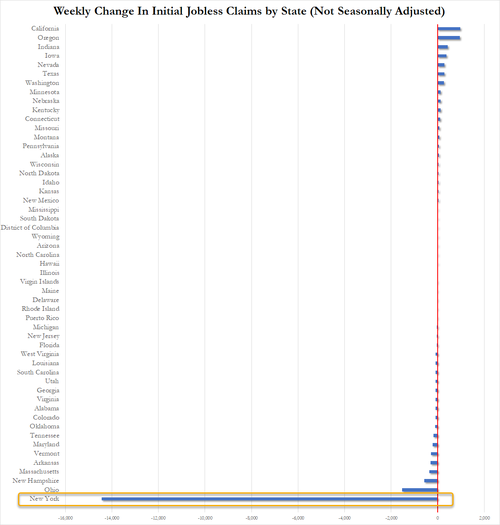
How is this possible, you may ask… well let us show you the ways… New York State claims that its jobless benefits rolls collapsed last week. New York accounted for 99.75% of the weekly change in initial claims across the entire US as shown below…
Source: Bloomberg
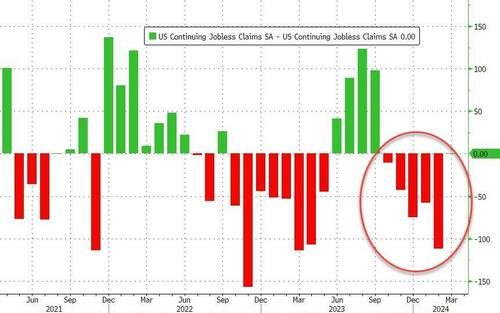
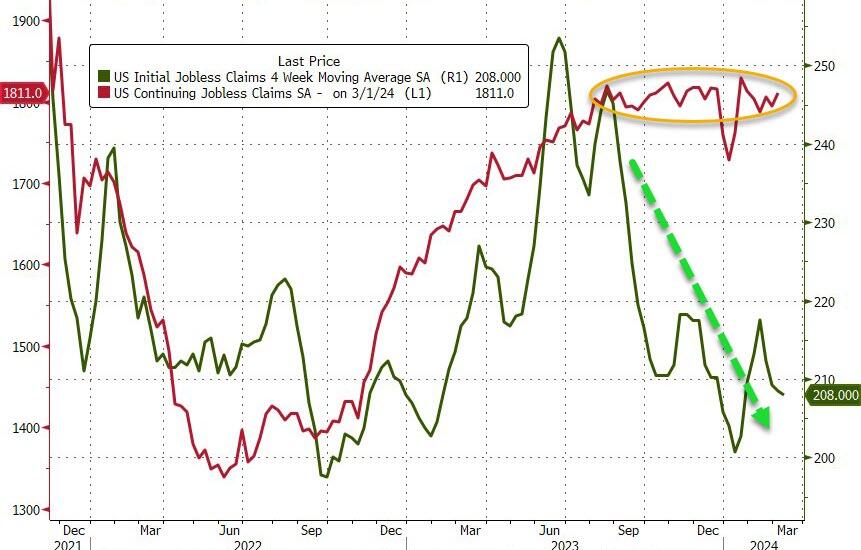
Continuing Claims was a shit show – with a massive 112k person downward revision for last week from 1.906 million to 1.794mm. That is the 5th straight weekly downward revision of continuing claims…
Source: Bloomberg
But thanks to the adjustments, it all looks ‘normal’ and ‘stable’ at around 1.8 million Americans…
Source: Bloomberg
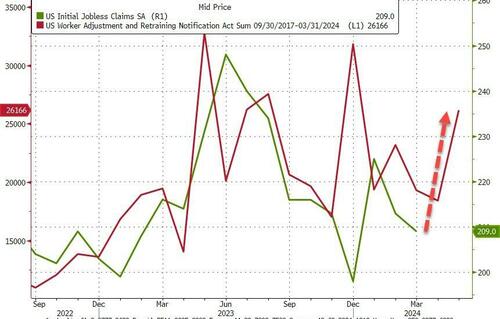
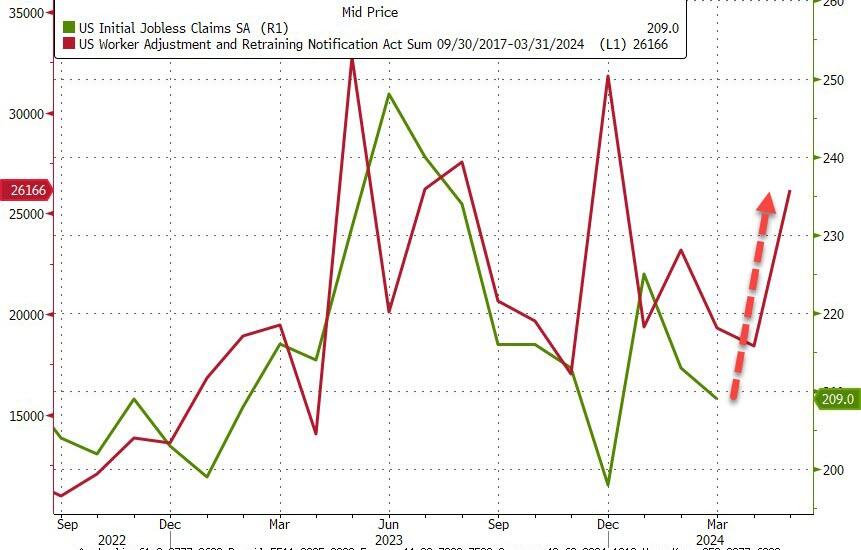
And WARN numbers are rising rapidly…
Source: Bloomberg
As a reminder, if you doubt the accuracy of the Biden admin’s data, here’s what the most recent FOMC Minutes said:
“While the recent trends prior to the meeting had been remarkably positive, Fed officials judged that some of the recent improvement “reflected idiosyncratic movements in a few series.”
Even they aren’t buying it, and neither should you!
We are experiencing a situation known as House Latitudes. Where mortgage rates are so high that the mortgage market is struggling to recover from Bidenomics.
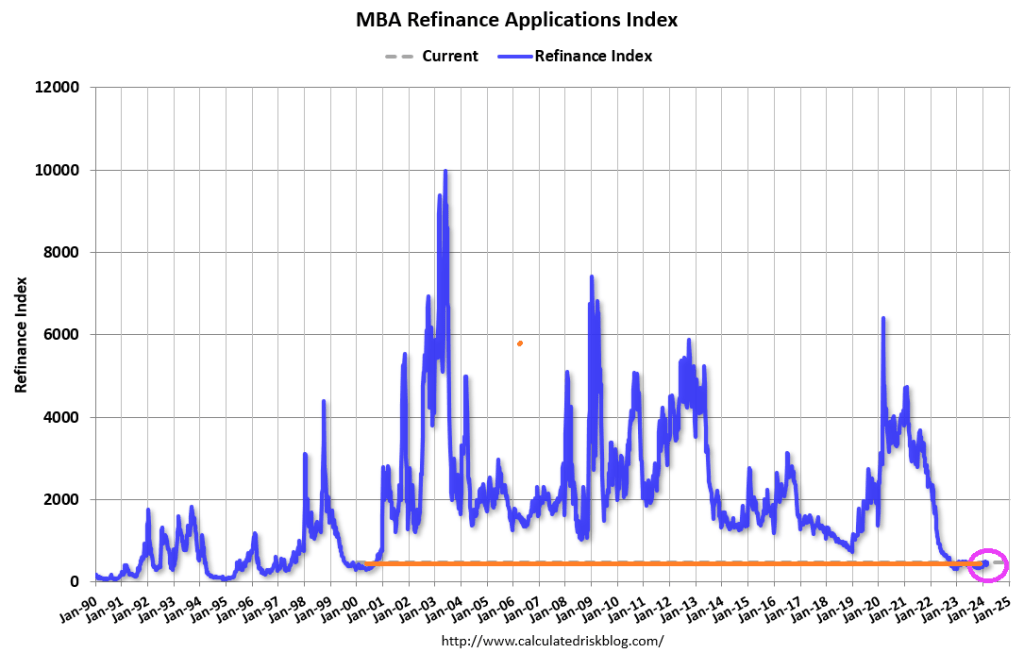
Mortgage applications increased 7.1 percent from one week earlier, according to data from the Mortgage Bankers Association’s (MBA) Weekly Mortgage Applications Survey for the week ending March 8, 2024.
The Market Composite Index, a measure of mortgage loan application volume, increased 7.1 percent on a seasonally adjusted basis from one week earlier. On an unadjusted basis, the Index increased 8 percent compared with the previous week. The seasonally adjusted Purchase Index increased 5 percent from one week earlier. The unadjusted Purchase Index increased 6 percent compared with the previous week and was 11 percent lower than the same week one year ago.
The Refinance Index increased 12 percent from the previous week and was 5 percent higher than the same week one year ago.
The average contract interest rate for 30-year fixed-rate mortgages with conforming loan balances ($766,550 or less) decreased to 6.84 percent from 7.02 percent, with points decreasing to 0.65 from 0.67 (including the origination fee) for 80 percent loan-to-value ratio (LTV) loans.
Following yesterday’s release of Biden’s $7.3 trillion budget, the Biden administration bragged about lowering the deficit by $3 trillion over the next decade – an average of 0.8% of GDP over that period.
This would consist of roughly $2.6 trillion over 10 years in additional spending programs, offset by around $4.8 trillion in tax increases over the same period. Most of the tax and spending proposals have been included in prior budget proposals from the White House, according to Goldman’s Alec Phillips, however there are several new items.
The budget would increase the corporate alternative minimum tax on book income from 15% to 21%, raising $137 billion over the next decade. It also limits a corporation’s ability to deduct employee pay exceeding $1mm/year, raising $272 billion over 10 years. The largest proposed tax increases include; raising the corporate minimum tax from 21% to 28%, as well as a series of tax increases on high-income earners, including new Medicare taxes, and a new 25% minimum tax on incomes over $100 million, raising $500 billion over the next decade.
Of course, it has zero chance of passing under the current Congress – but that’s not the point.
As one DC strategist wrote in a morning email noted by CNBC‘s Brian Sullivan, the budget deficit will still grow by another $16 trillion over the next decade – and that’s with aforementioned tax hikes.
Without them, the deficit grows to $19 trillion.
In short, talk of ‘$3 trillion saved’ is total bullshit in the grand scheme of things, given how much the national debt will grow in the best case scenario.
“No family budget or business could exist with this kind of math,” says Sullivan.
Yes Brian, no family budget could exist with this kind of math AND SPENDING!
And the national debt is rising by $1 TRILLION every 100 days. Before Spending Joe’s budget!
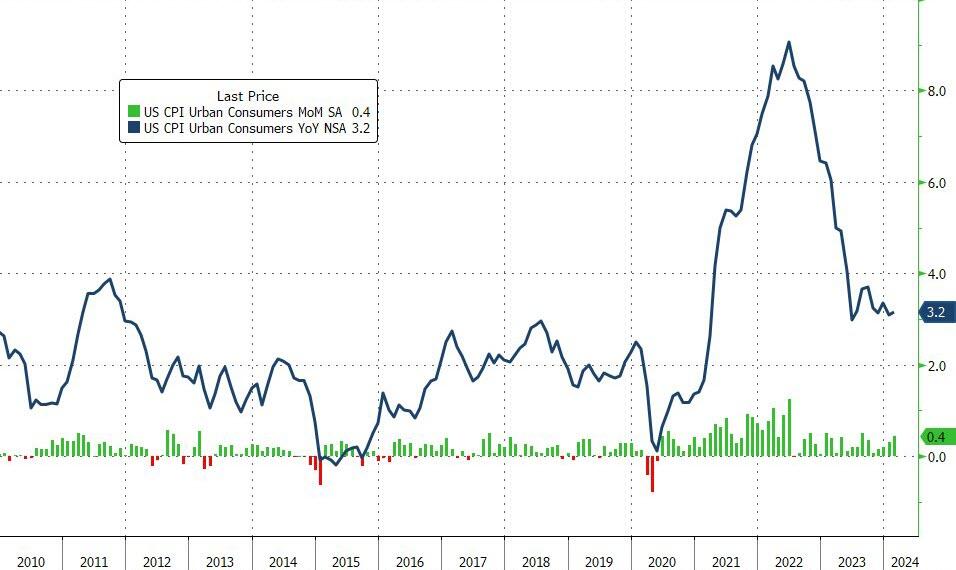
Unlike what Grand-dad Joey Biden screamed at the State of The Union (SOTU) address, inflation is NOT been defeated. In fact, inflation has defeated Biden and The Federal Reserve.
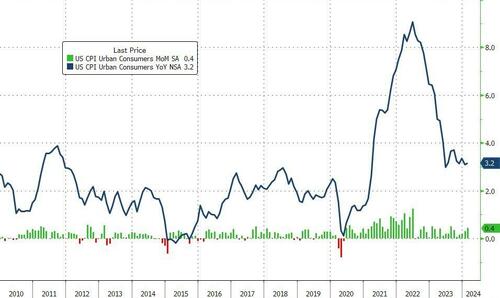
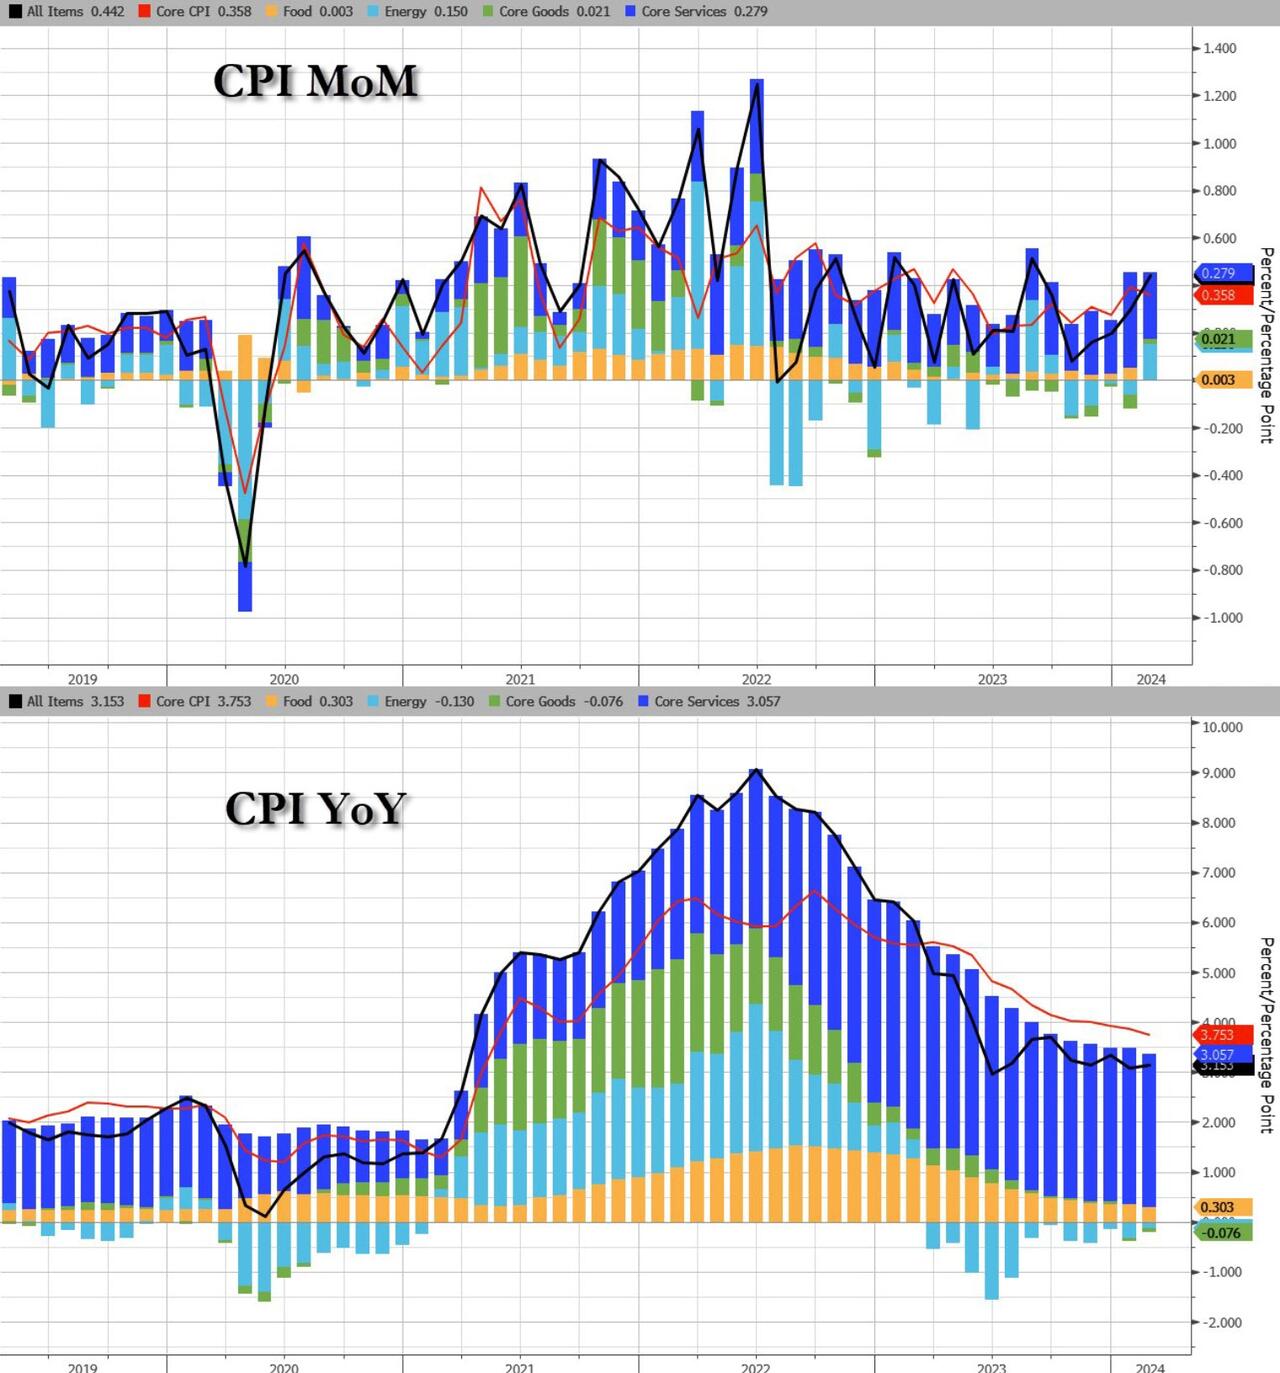
The 3-month annualized CPI rate was rose to 2.8% from 1.9%. The 6-month annualized core rate dropped to 3.2% from 3.3%.
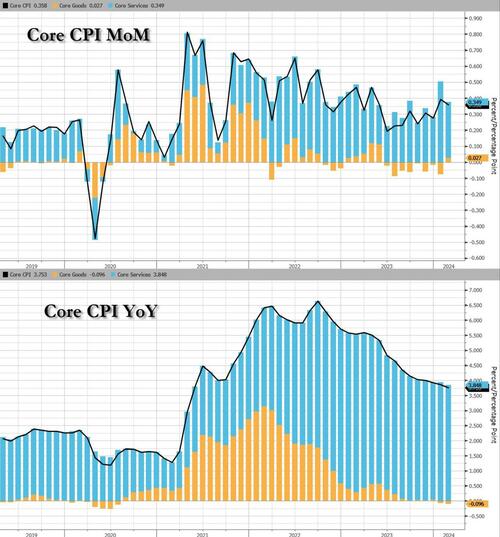
Energy costs surged MoM as Core Services inflation slowed MoM…
Source: Bloomberg
Full CPI MoM breakdown:
The index for all items less food and energy rose 0.4 percent in February, as it did the previous month.
The shelter index increased 0.4 percent in February and was the largest factor in the monthly increase in the index for all items less food and energy.
The index for rent rose 0.5 percent over the month, while the index for owners’ equivalent rent increased 0.4 percent.
The lodging away from home index increased 0.1 percent in February, after rising 1.8 percent in January.
The airline fares index rose 3.6 percent in February, following a 1.4-percent increase in January.
The index for motor vehicle insurance increased 0.9 percent over the month.
The medical care index was unchanged in February after rising 0.5 percent in January.
The index for hospital services decreased 0.6 percent over the month and the index for physicians’ services decreased 0.2 percent.
The prescription drugs index fell 0.1 percent in February.
The index for dental services was among those that rose in February, increasing 0.4 percent.
The index for personal care fell 0.5 percent in February, following a 0.6-percent increase in January.
The household furnishings and operations index fell 0.1 percent over the month, as did the new vehicles index.
Among other indexes that rose in February were apparel, recreation, and used cars and trucks.
Full CPI YoY breakdown:
The index for all items less food and energy rose 3.8 percent over the past 12 months.
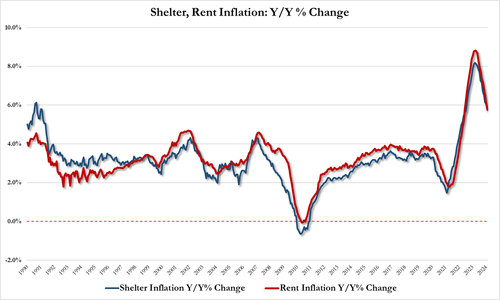
The shelter index increased 5.7 percent over the last year, accounting for roughly two thirds of the total 12-month increase in the core CPI index
Feb Shelter inflation: 5.74% down from 6.04% in Jan
Feb rent inflation: 5.77%, down from 6.09% in Jan
Other indexes with notable increases over the last year include motor vehicle insurance (+20.6 percent), medical care (+1.4 percent), recreation (+2.1 percent), and personal care (+4.2 percent).
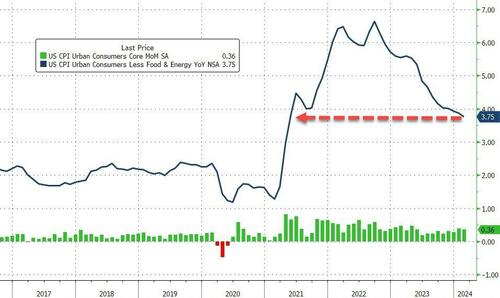
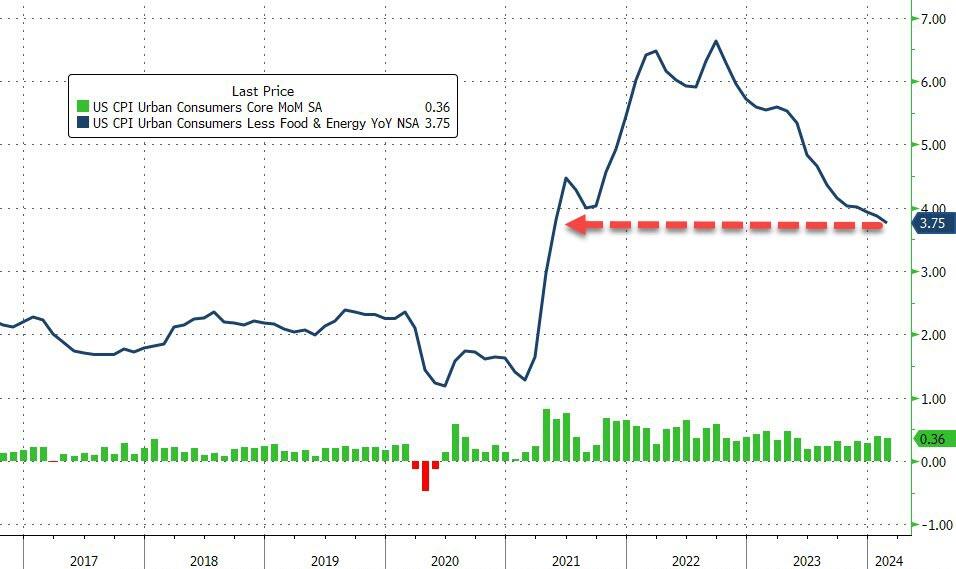
Core CPI rose 0.4% MoM (hotter than the +0.3% exp) and up 3.8% YoY (hotter than the +3.7% exp), but still the lowest since April 2021…
Source: Bloomberg
The 3-month annualized Core CPI rate was rose to 4.1% from 3.9%. The 6-month annualized core rate rose to 3.8% from 3.5%.
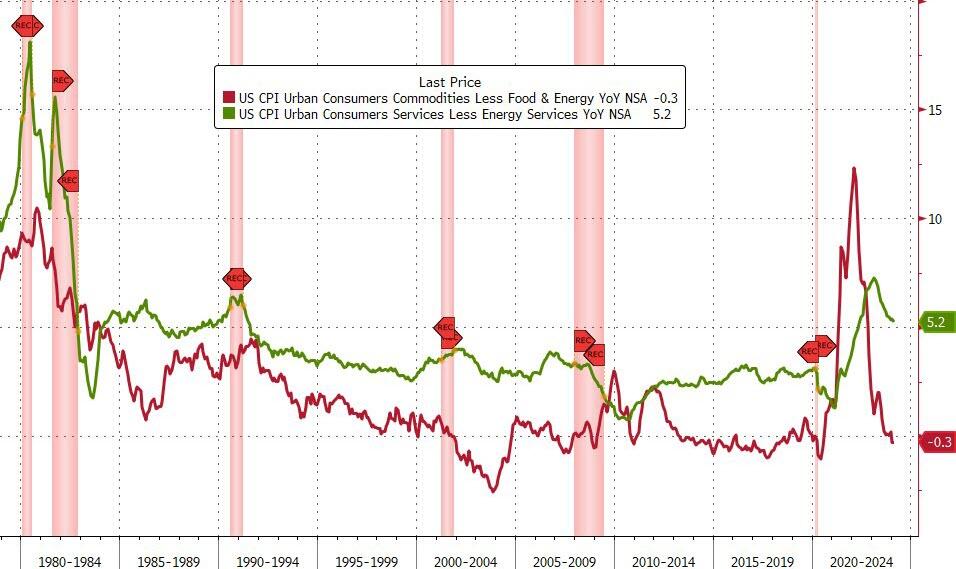
Core Goods actually rose MoM for the first time since June 2023…
Goods deflation continues (-0.3% YoY) but has flattened out, while services inflation remains stubbornly high at +5.2% YoY…
Source: Bloomberg
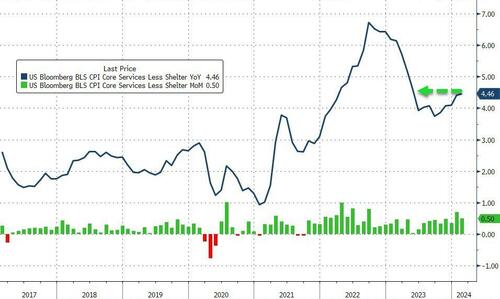
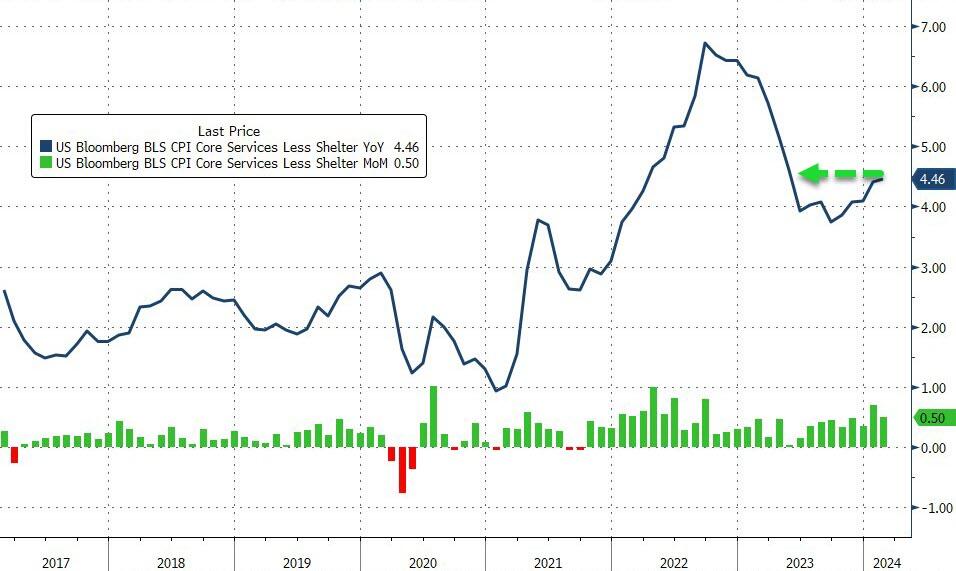
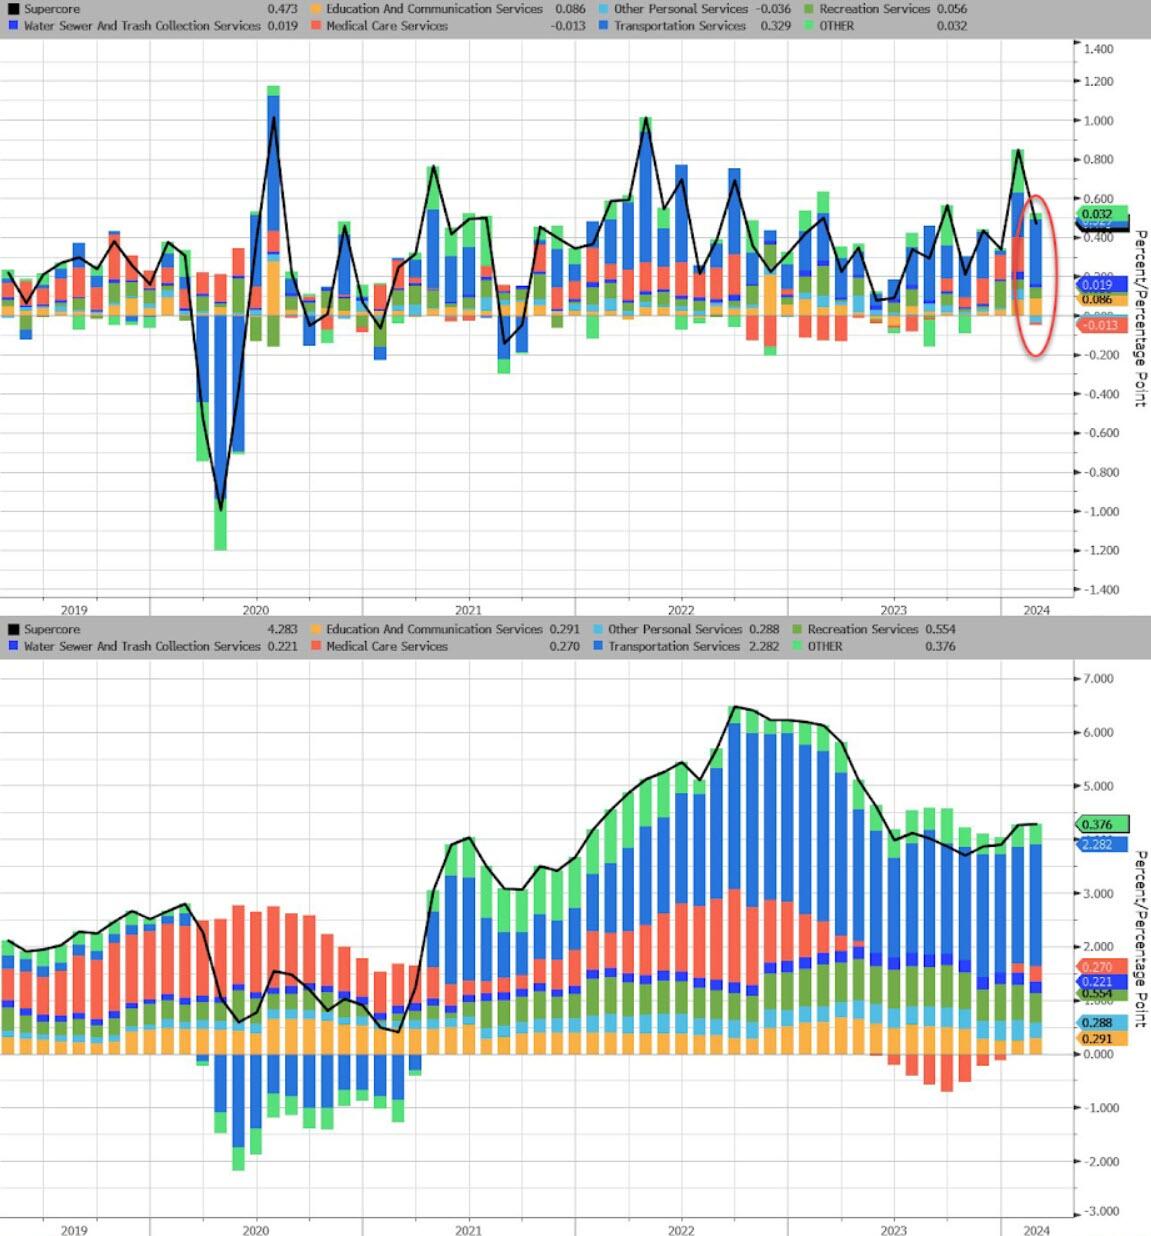
And one step deeper – the so-called SuperCore: Core CPI Services Ex-Shelter index – soared 0.5% MoM up to 4.5% YoY – the hottest since May 2023…
Source: Bloomberg
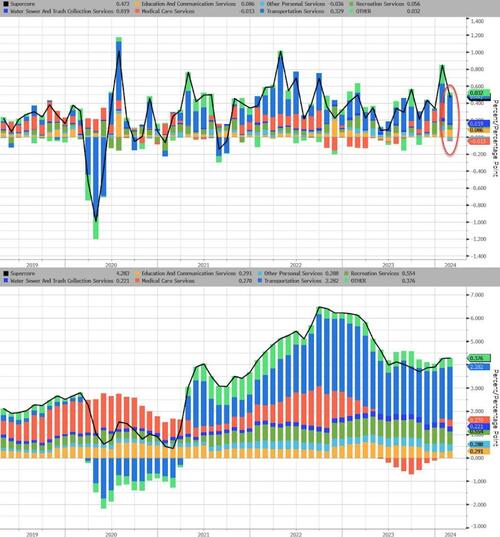
While SuperCore CPI slowed MoM, there was a large jump in Transportation Services MoM…
Source: Bloomberg
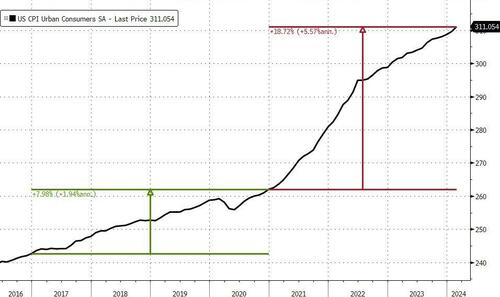
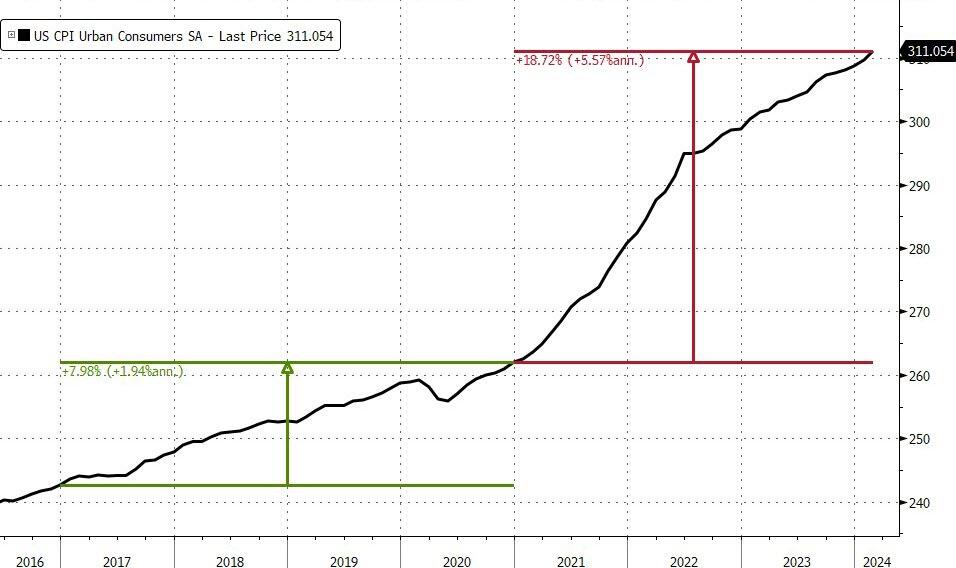
Finally, we note that consumer prices have not fallen in a single month since President Biden’s term began (July 2022 was the closest with ‘unchanged’), which leaves overall prices up 19% since Bidenomics was unleashed. And prices have never been more expensive…
Source: Bloomberg
That is an average of 5.6% per annum (more than triple the 1.9% average per annum rise in price during President Trump’s term).
So, about that shrinkflation – did companies only ‘get greedy’ when Biden took office?
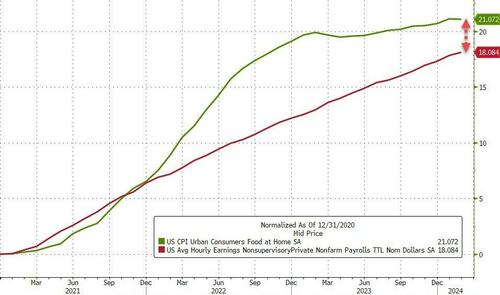
But it gets worse, real wage growth has lagged significantly for the average joe in America…
Source: Bloomberg
Despite a very modest decline in Feb, Food costs are up over 21% since Biden’s term began, but non-supervisory wages are up only 18%.
Bidenomics for the win!
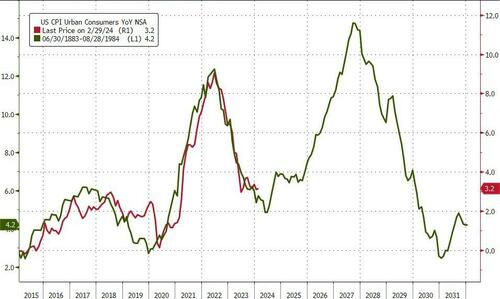
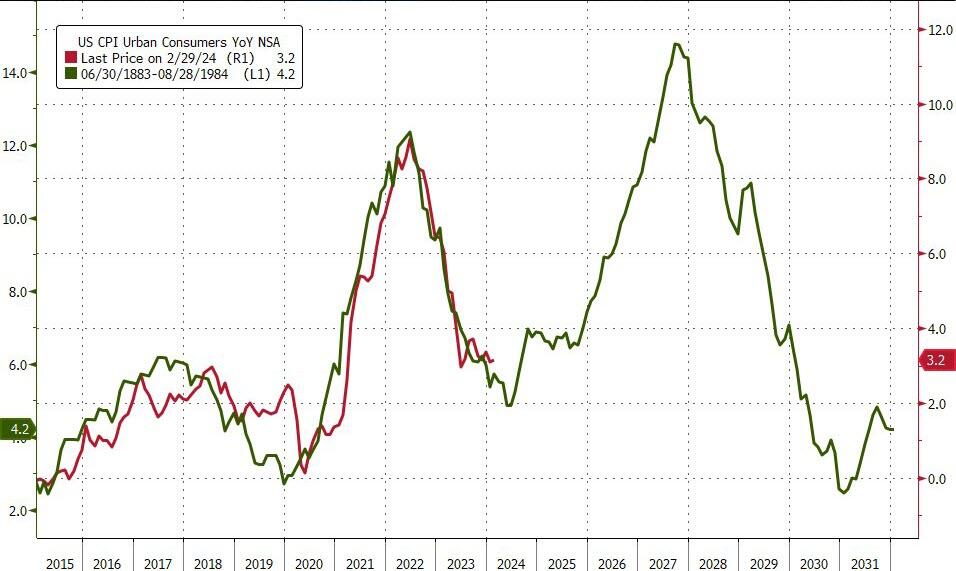
Are we going to see a replay on the ’70s?
Source: Bloomberg
The market narrative of slow and steady disinflation just broke harder.
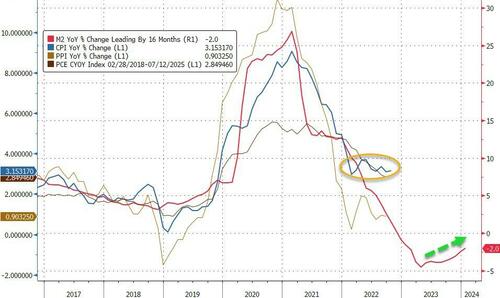
…or are we still set for a massive wave of depressionary deflation?
Inflation remains hot, hot, hot although Biden/Yellen will undoubtedly say that it is lower than last year. But remember, consumer prices are up a staggering 19% under Bidenomics. THAT is a major tax of those making under $200,000 per year, Joey.
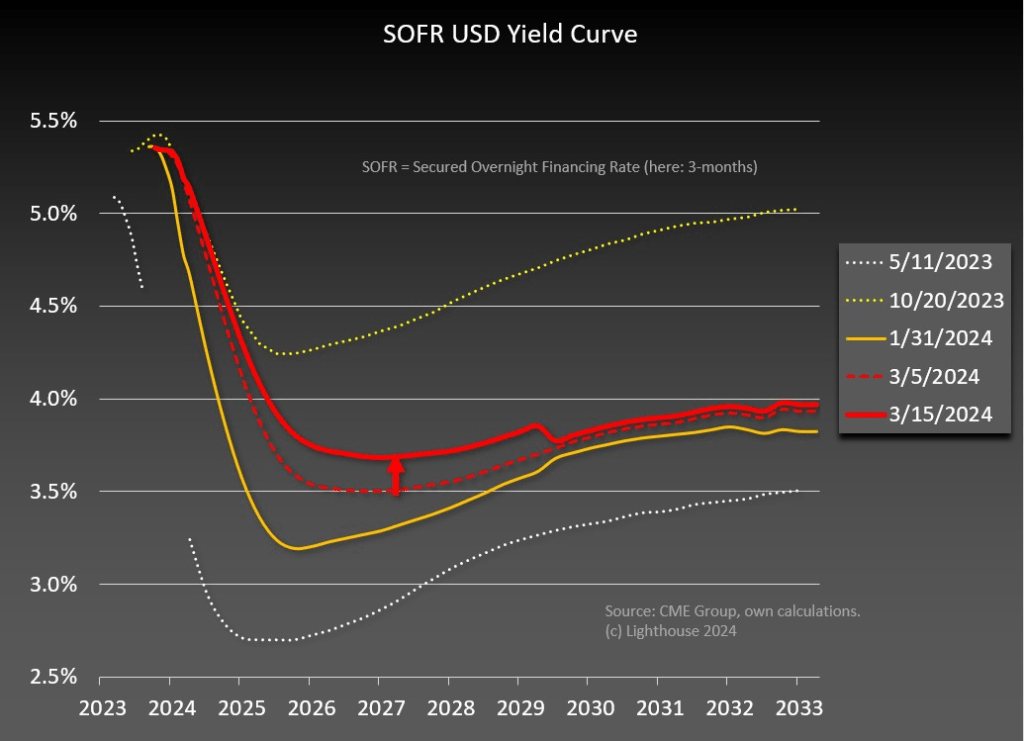
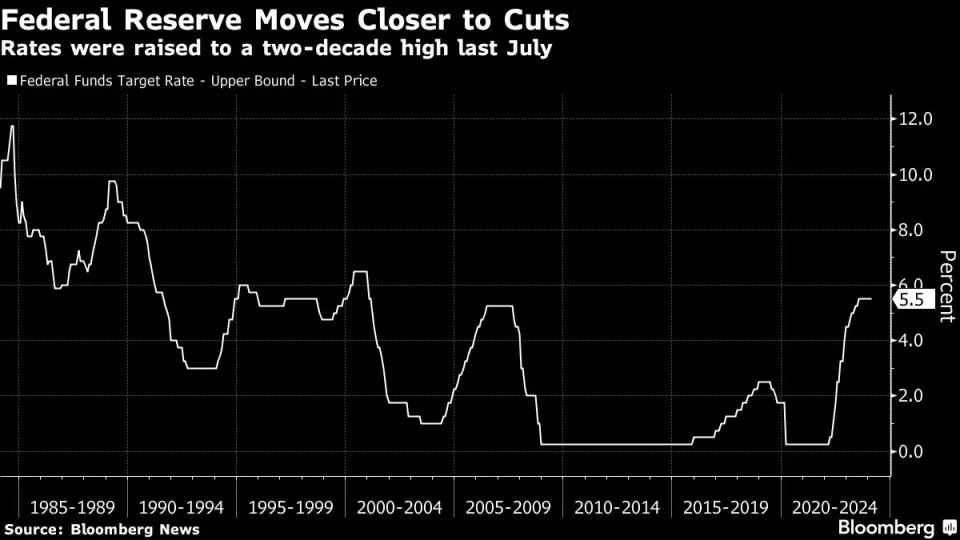
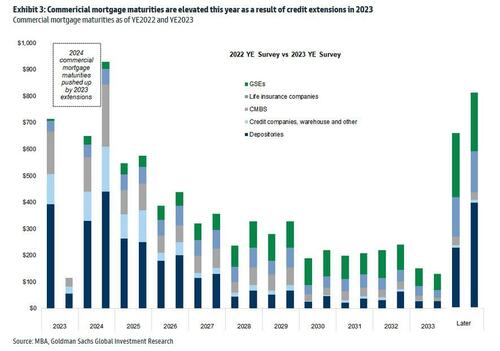
Holders of commercial real estate (CRE) debt are riding the tiger. Meaning that if interest rates don’t come down, there will be a lot of pain and suffering.
“We’re far from neutral now,” said America’s Fed Chairman, Jerome Powell, to the Senate Banking Committee. As The Fed moves closer to cutting rates.
All those rent-seekers stacked up with commercial real estate holdings nodded in violent agreement. That of course includes the nation’s regional banks, which continue to succumb to the power of their systemically important rivals, now so big that they cannot possibly be allowed to fail.
And this has turned America’s banking behemoths into for-profit wards of the state, recipients of an unspoken but ironclad insurance policy that underwrites catastrophic losses and adds them to the national debt.
“Interest rates right now are well into restrictive territory. They’re well above neutral,” added Chairman Powell without, well, sharing his definition of the word ‘well’. And truth be told, no one really knows the definition of ‘neutral’ when it comes to interest rates.
Economic PhDs will generally tell you that the neutral real interest rate is 0.50%. Their level of confidence is inversely proportional to the amount of capital they have at risk in markets — which would have been Newton’s Fourth Law had he bothered to study the art of economics.
Those of us less academically gifted, who must resort to taking risk for a living, lack the conviction of Nobel Laureates. We see that there are times in an economic cycle when 0.50% real rates stimulate growth, and times when they restrict economic activity.
Sometimes neutral rates have no effect at all. Which is to say that the economic impact of real rates simply depends. Like now when signals are far from uniform. Stock markets hit all-time highs despite collapsing commercial real estate, crypto and gold prices are soaring to records, massive government stimulus programs like the IRA are cranking up, student debt is being forgiven in successive waves, unemployment is near record lows, core inflation is starting to rise again, and the budget deficit is around 6% despite robust GDP growth.
All of which screams that a 0.50% real rate is preposterously low to everyone but economic PhDs.
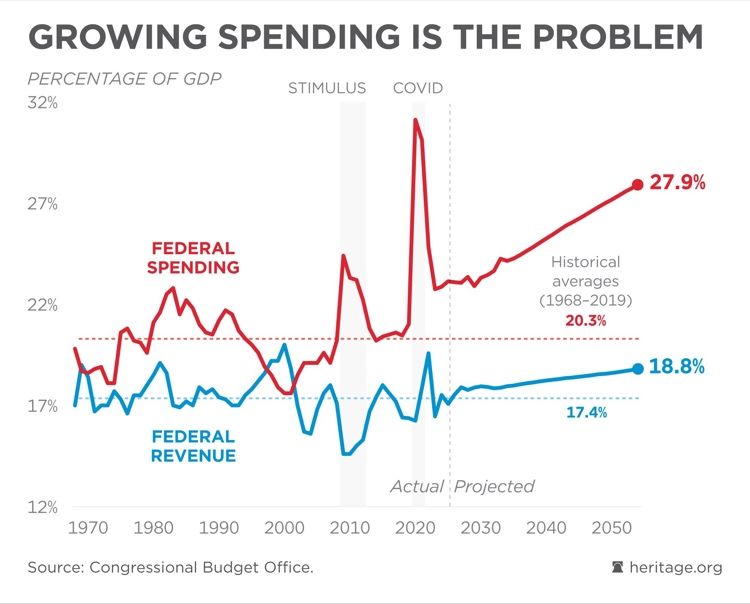
In statistics we talk about “jump processes.” Like Federal government spending every time there is a financial crisis like the subprime crisis of 2008-2009 and the Covid lockdowns of 2020. Each crisis brought a jump in the level of spending and jump in Federal debt.
Federal debt under Biden started at $27.7 trillion and is currently at $34.5 trillion, that amounts to $6.75 TRILLION in additional debt under Old Grand-dad Joe Biden. Federal spending, of course, is out of control with Biden/Congress spending $569 BILLION since Joey took office.
Generally speaking, the Federal government needs to justify the elevated levels of Federal spending, like another COVID outbreak, escalate the war in Ukraine, get into a hot war with Iran and China, or … say … Washington DC pols never need much of an excuse to go on a spending spree.
If only Biden would retire gracefully. He could be the new face of “Old Grand-dad Bourbon Whiskey.” Except Biden’s version would be an angry 80+ year old man with dementia.
Somehow, Biden left this factoid out of his State of The Union (SOTU) address. In February, immigrants added 1,277 million jobs while native Americans lost -420,000 jobs according to the BLS. Or maybe Biden can change his campaign motto to “Make America Great Again … For Immigrants, NOT Natives.”
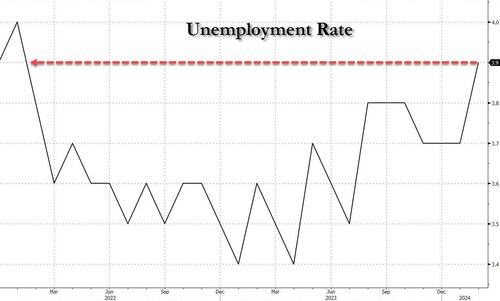
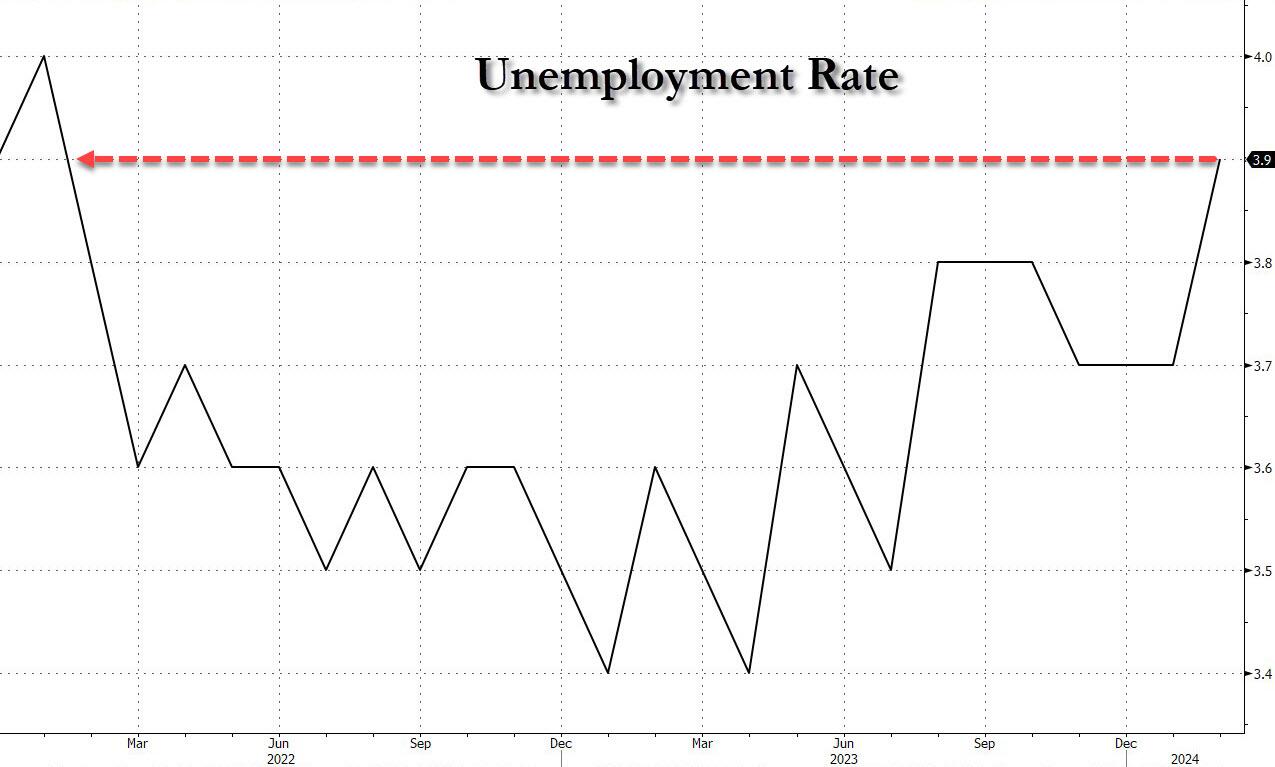
In February, the unemployment rate unexpectedly jumped to 3.9%, the highest since February 2022 (with Black unemployment spiking by 0.3% to 5.6%).
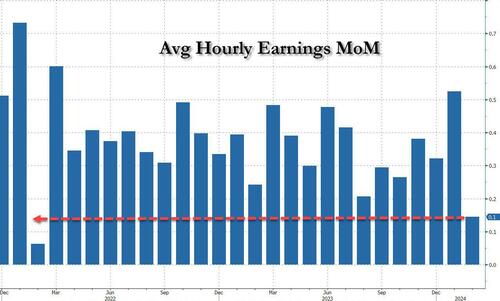
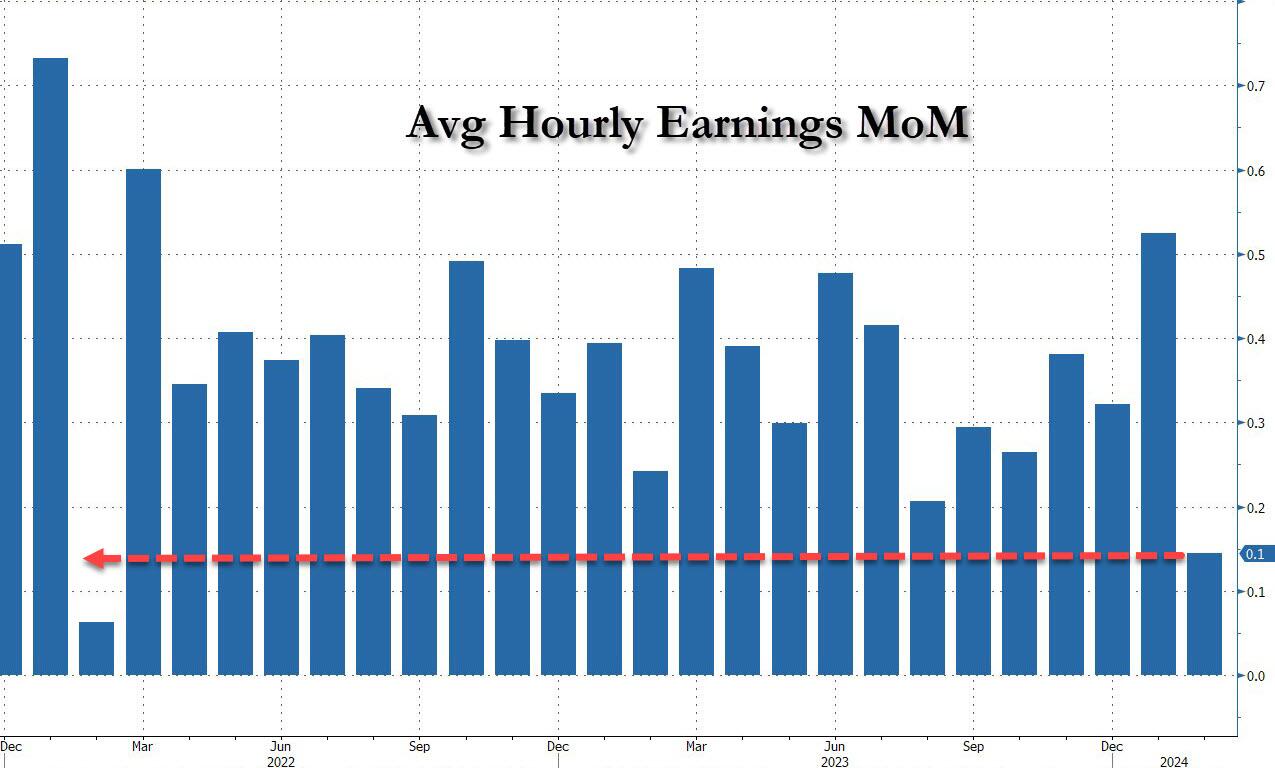
And then there were average hourly earnings, which after surging 0.6% MoM in January (since revised to 0.5%) and spooking markets that wage growth is so hot, the Fed will have no choice but to delay cuts, in February the number tumbled to just 0.1%, the lowest in two years…
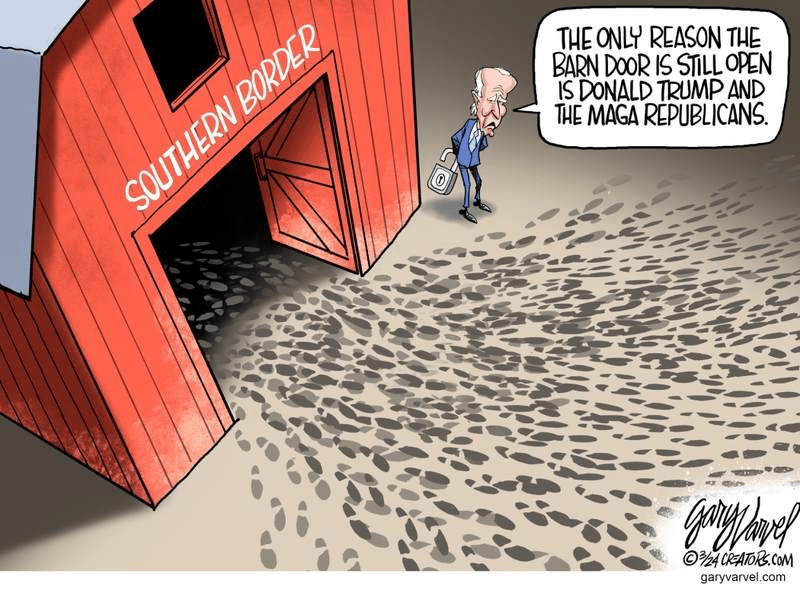
It is clear that the labor market is softening, but Biden/Mayorkas will continue to let millions of illegal immigrants pour across the border making the labor market even softer than before. But the top 1% are making out like bandits from the illegal immigration. Bandits benefitting bandits.
After witnessing the debacle called “The State of the Union Address” or “Crazy Grandfather Screams At Nation To Get Off His Lawn,” I was hoping that today’s jobs report would make me happier. It didn’t. In fact, the February jobs report was downright awful.
Maybe now you can understand why Biden gave his angry SOTU speech. Perhaps he saw how bad February’s jobs report was for Middle class America and was trying to redirect the rage away from himself towards the Supreme Court, MAGA Republicans, corporate America (his biggest donors?), and the 6 year old that walked across The White House Lawn uninvited.


You must be logged in to post a comment.