Let It Ride? Bidenomics Debt Market Meltdown With US Debt On “Unprecedented” Trajectory (Each US Citizen On The Hook For $636k In Unfunded Entitlements)

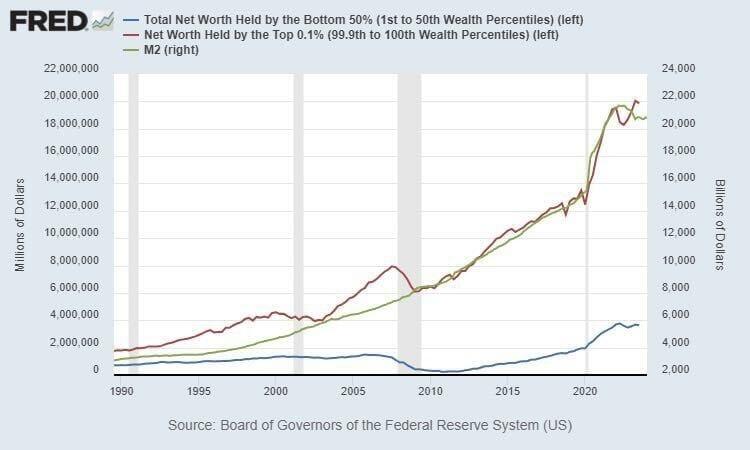
Part of the Bidenomics “plan” is not only green-energy spending, but plenty of freebies to gather voters from the masses. Like the $214 TRILLION in unfunded liabilities promised to the masses in the form of entitlements like Social Security, Medicare and Medicaid (why did they demand that all US citizens be forced to buy healthcare insurance, then give free healthcare to illegal immigrants??). In any case, each citizen is on the hook for $636,000!

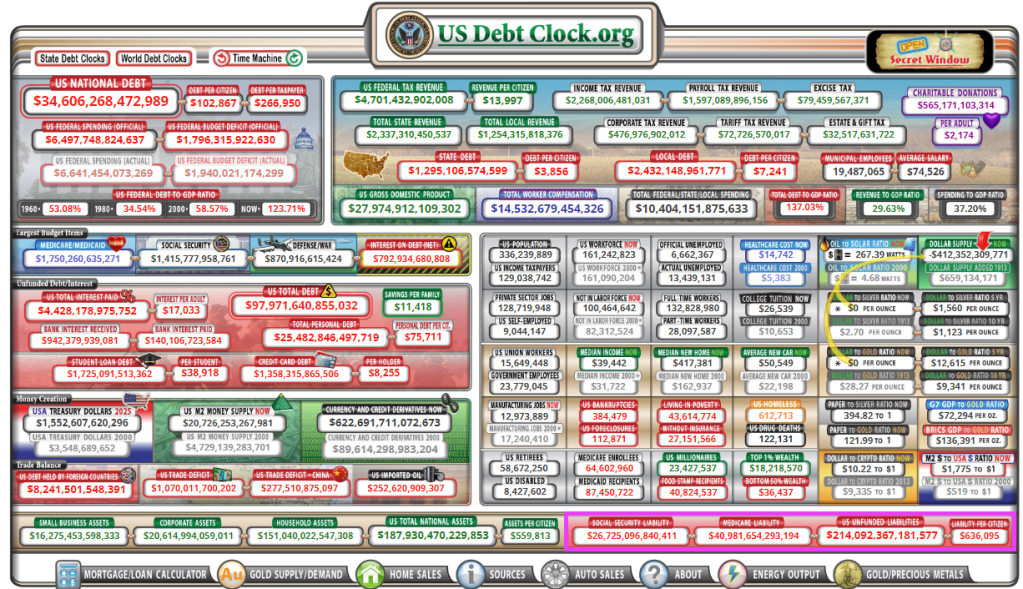
What about the national debt with Ice Cream Joe at the helm? It has exploded in growth.

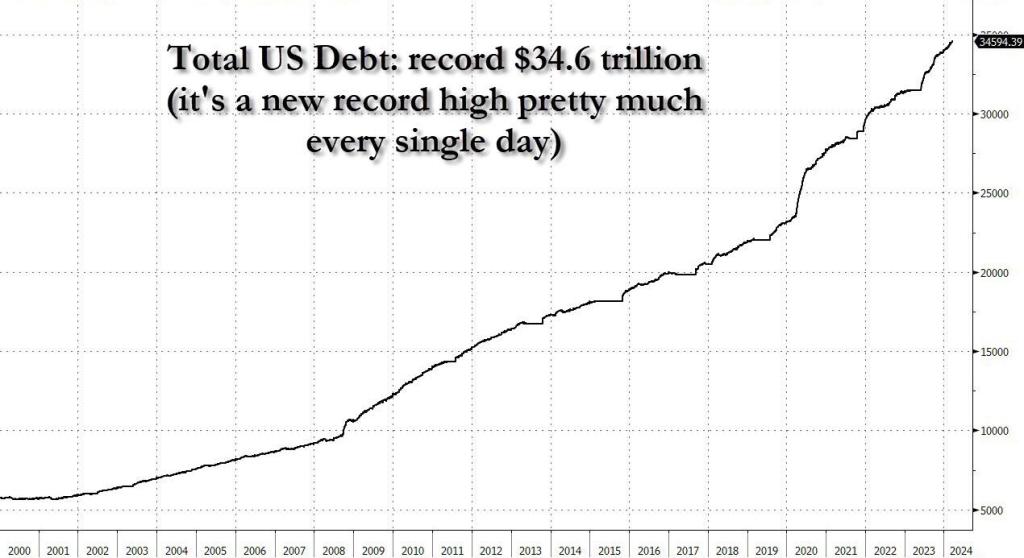
Not only has it gotten boring to be ahead of the curve by almost half a year, but pretty much every possible warning that could be said about the exponential increase in the US debt has been – well – said.

And yet, every now and then we are surprised by the latest developments surrounding the unsustainable, exponential trajectory of US debt. Like, for example, the establishment admitting that it is on an unsustainable, exponential trajectory.

That’s precisely what happened overnight when in an interview with the oh so very serious Financial Times (which has done everything in its power to keep its readers out of the best performing asset class of all time, bitcoin), the director of the Congressional Budget Office, Phillip Swagel, issued a stark warning that the United States could suffer a similar market crisis as seen in the United Kingdom 18 months ago, during former Prime Minister Liz Truss’s brief stint leading Britain – which briefly sent yields soaring, sparked a run on the pound, led to an immediate restart of QE by the Bank of England and a bailout of various pension funds, not to mention the almost instant resignation of Truss – citing the nation’s “unprecedented” fiscal trajectory.

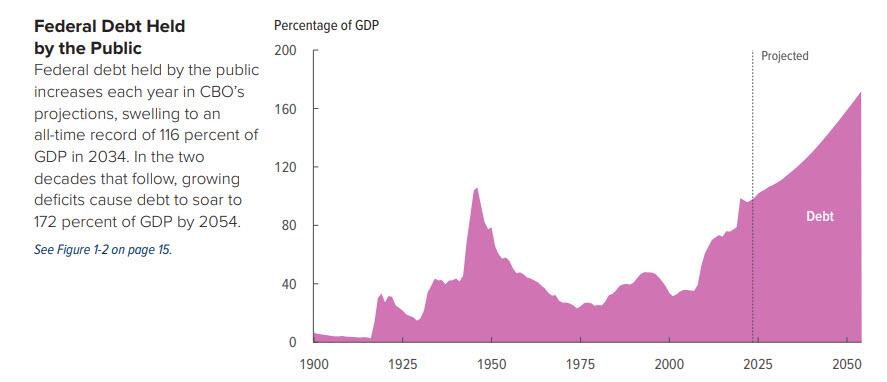
The striking words from the head of the CBO, best known perhaps for publishing doomer debt/GDP projection charts such as this one…

… warned of the dangers of the U.S. facing “what the U.K. faced with former prime minister Truss — where policymakers tried to take an action, and then there’s a market reaction to that action”, comes as US government debt continues to break records, fueling concerns about the burden that places on the economy and taking a toll on America’s credit rating.

As a reminder, in September 2022, Truss roiled markets as she pressed for significant tax cuts, including changes lessening the tax burden on wealthier individuals without offsets, as well as other economic measures. The budget proposal spurred a major selloff of British debt, forcing U.K. interest rates to decades-long highs and causing the value of the pound to tank. While Truss defended her agenda as a means to spur economic growth, she stepped down as prime minister after less than two months on the job following the market revolt to her administration.

Meanwhile, it was up to the Bank of England to bail everyone out: the central bank intervened in the market, pledging to buy gilts on “whatever scale is necessary” with Dave Ramsden, a senior official at the central bank, saying at the time that “were dysfunction in this market to continue or worsen, there would be a material risk to UK financial stability.

Needless to say, by bringing up the catastrophic rule of Truss, who for at least a few days tried to impose a regime of fiscal and monetary austerity which immediately blew up the UK bond market and led to an instant market crisis, Swagel is admitting that there is nothing that can be done to reverse the growth of US debt and to make what is already an exponential chart less exponential. Quite the opposite, in fact.

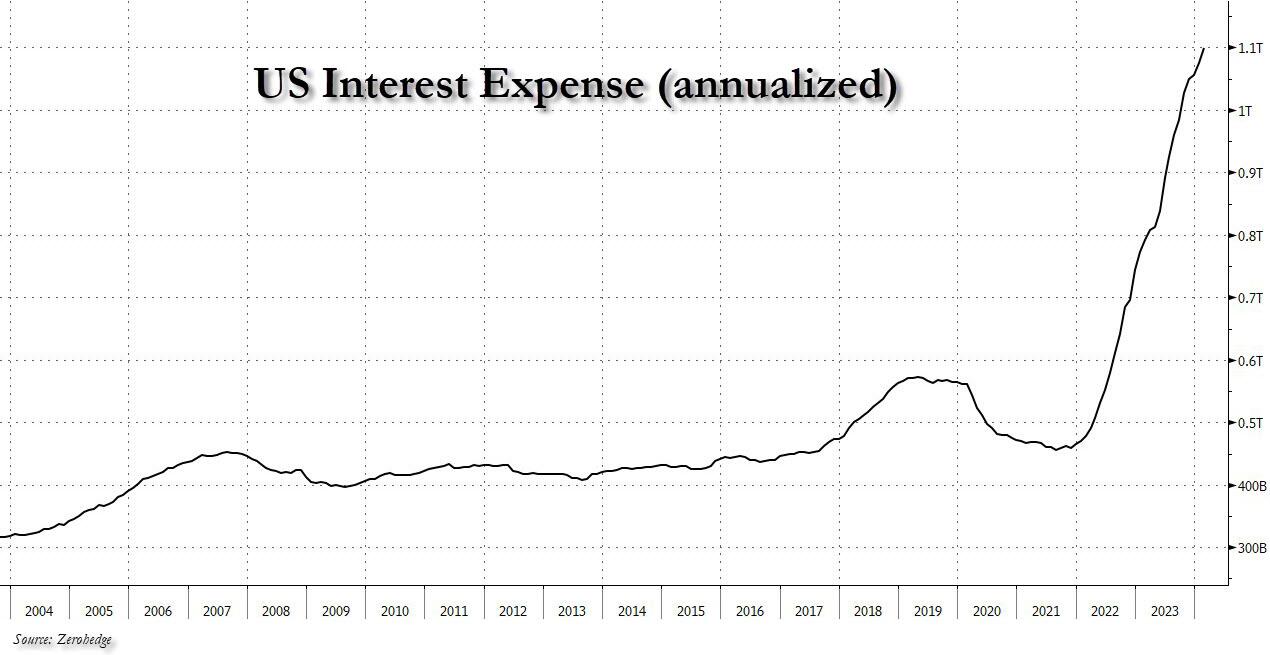
And while Swagel said the U.S. is “not there yet,” he raised concerns of how bond markets could fare as interest rates have climbed. Specifically, he warned that as higher interest rates raise the cost of paying its creditors, on track to reach $1 trillion per year in 2026, bond markets could “snap back.”

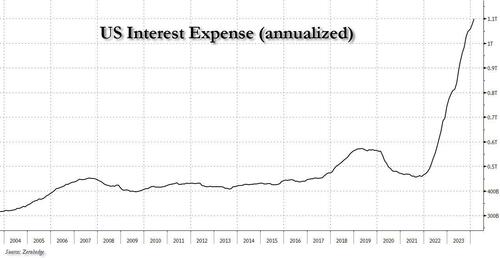
Well, we have some bad news, because if one calculates total US interest on an actual, annualized basis… we don’t have to wait until 2026, we are there already and then some.

Indeed, it seems like it was just yesterday when everyone was talking about US debt interest surpassing $1 trillion (and more than all US defense spending). Well, hold on to your hats, because as of this month, total US interest is now $1.1 trillion, and rising by $100 billion every 4 months (we should probably trademark this before everyone else steals it too).

According to the CBO, US government debt is set to keep rising. “Such large and growing debt would slow economic growth, push up interest payments to foreign holders of US debt, and pose significant risks to the fiscal and economic outlook,” it said in a report last week. “It could also cause lawmakers to feel more constrained in their policy choices.”

Only that will never happen, because a politician who is “constrained” in their policy choices – one who doesn’t feed the entitlements beast in hopes of winning votes (while generously spreading pork for friends and family) – is a politician who is fired.

Perhaps afraid he would sound too much like ZeroHedge, the CBO director left a glimmer of hope, saying that the nation has “the potential for some changes that seem modest — or maybe start off modest and then get more serious — to have outsized effects on interest rates, and therefore on the fiscal trajectory.” But we doubt even he believes it.

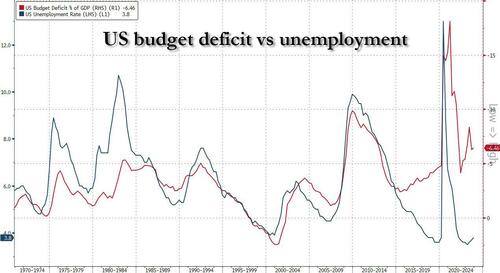
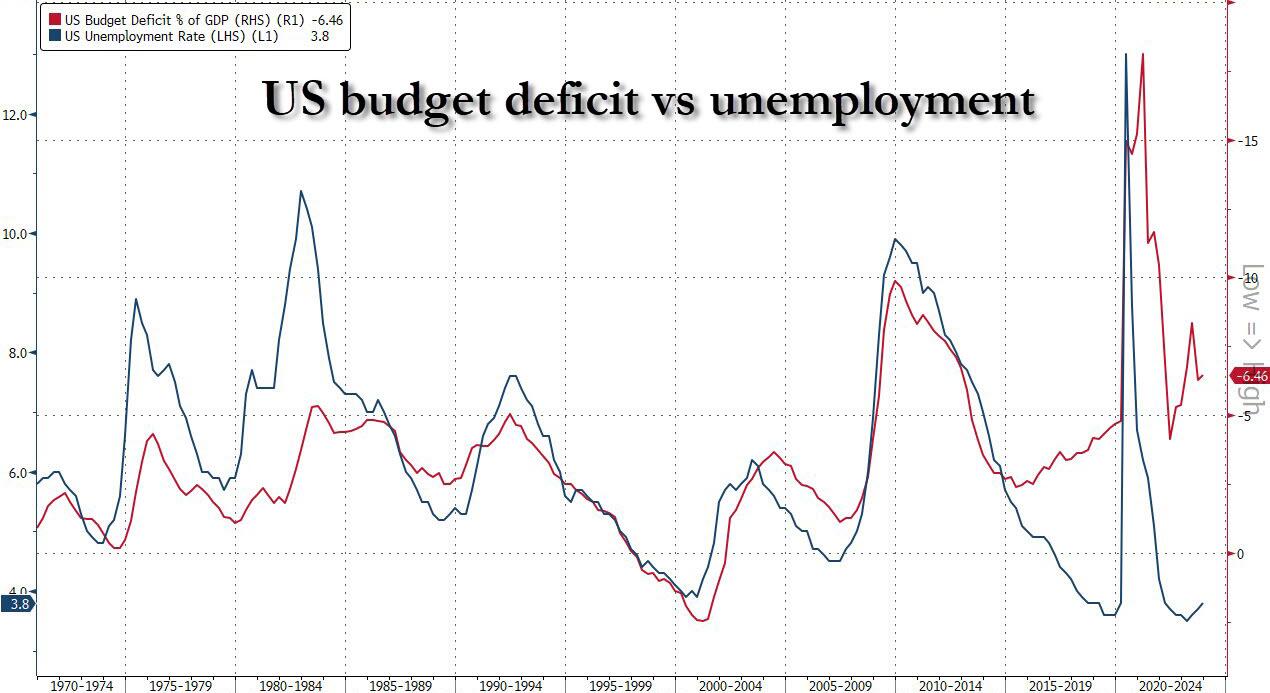
In the CBO’s long-term budget outlook report released last week, the budget agency projected the national deficit would rise “significantly in relation to gross domestic product (GDP) over the next 30 years, reaching 8.5 percent of GDP in 2054.” Which of course, is laughable: the US deficit is already at 6.5% of GDP – a level that traditionally implied there is a major economic crisis – and yet here we are, with unemployment *reportedly* at just 3.8%. Said otherwise, the US deficit will – with 100% certainty – hit 8.5% of GDP during the next recession which will likely be triggered as soon as Trump wins the November election.

The budget scorekeeper attributed the projected growth to rising interest costs, as well as “large and sustained primary deficits, which exclude net outlays for interest.” In short, everything is already going to hell to keep “Bidenomics” afloat, but when you also throw in the interest on the debt, well.. that’s game over man.

Socialists, and other liberals who are only good at spending other people’s money and selling debt until the reserve currency finally breaks, quickly sprung to defense of the debt black hole that the US economy has become.

Bobby Kogan, senior director of federal budget policy at the communist-leaning Center for American Progress think tank, pointed to improved deficit projections in recent years, as well as forecasts from the CBO he said “don’t project anything that looks like a panic.”

“If someone were thinking about, ‘Should I panic or should I not panic?’ I would just say, ‘hey, the underlying situation has gotten better, right?’” Kogan said, adding “there’s been lower, long-term projected deficits in the Biden administration.”

Instead of responding, we will again just show the latest CBO debt forecast chart and leave it up to readers to decide if they should panic or not.

What Kogan said next, however, was chilling:  “You either should have been worried a long time ago, or you should be less worried now,” he said. “Because we’ve been on roughly the same path for forever, but to the extent that it’s different, it’s better.”

Actually no, it’s not better. It much, much worse, and the fact that supposedly “serious people” are idiots and make such statements is stunning because, well, these are the people in charge!

But he is certainly right that “you should have been worried a long time ago” – we were very worried, and everyone laughed at us, so we decided – you know what, it’s not worth the effort, may as well sit back and watch it all sink.

And now bitcoin is at a record $72,000 on its way to $1 million and gold is at a record $2,200 also on its way to… pick some nice round number…. in fact the number doesn’t matter if it is denominated in US dollars because very soon, the greenback will go the way of the reichsmark.

And just to make sure that nothing will ever change, even after the US enters the infamous Minsky Moment, shortly after the close we got this headline::

  • *UNITED STATES AA+ RATING AFFIRMED BY S&P; OUTLOOK STABLE

Because when nobody dares to tell the truth, why should anything change?

When asked about disastrous out of control spending and debt, Biden and Schumer broke into song: “Let it ride!”

Bidenomics, The Key Bridge Collapse And The Collapsing US Mortgage Market (Mortgage Applications Collapse By 16% From Last Year)

The cargo ship craashing into and collapsing the Key bridge in Baltimore is emblematic of Bidenomics: an ongoing wreck. And the mortgage market is the Key bridge collapse over a longer period. Specifically, from the start of Biden’s Regime in 2021.

Mortgage applications decreased 0.7 percent from one week earlier, according to data from the Mortgage Bankers Association’s (MBA) Weekly Mortgage Applications Survey for the week ending March 22, 2024.

The Market Composite Index, a measure of mortgage loan application volume, decreased 0.7 percent on a seasonally adjusted basis from one week earlier. On an unadjusted basis, the Index decreased 0.4 percent compared with the previous week. The seasonally adjusted Purchase Index decreased 0.2 percent from one week earlier. The unadjusted Purchase Index increased 0.2 percent compared with the previous week and was 16 percent lower than the same week one year ago.

The Refinance Index decreased 2 percent from the previous week and was 9 percent lower than the same week one year ago.

Employment in mortgage lending has shrunk along with collapsing mortgage originations under Biden.

Hey Big Spenders! Broken Money And Neverending Inflation (Inflation STILL At 18%)

Face it. The Federal government is broken. Congress and the Biden Administration are addicted to spending money and running up massive debts. There is no attempt at fiscal restraint because they will always argue that “More money must be spent!” On what exactly? Usually pet projects (aka, pork) like the LGBTQ retirement home in Boston for $850 thousand and $15 million for Egyptian college tuition.

How does “broken money” work? Badly. Without any fiscal restraint, politicians can just give away thousands/millions of dollars to the donor class (donate $1, get $1,000 in return). As you can see, the net worth of the top 0.1% has exploded with each ensuing “crisis.” There was the 2008/2009 financial crisis and the 2008 Covid crisis. With each crisis, the top 0.1% get richer and richer. You will note that net worth for the top 0.1% is closely related to M2 Money printing. Like, who gets the money printed by Uncle Spam? The 0.1%, of course!

Broken money leads people to store their value in sub optimal vehicles like housing. This drives the cost of real estate up unnaturally and increases the gap between the “haves” and the “have nots”. Sowing seeds of animosity. Seeds that, when left to germinate and grow via the further degradation of the money people use, blossom into ugly flowers of Anarcho Tyranny.

This has manifested in the trend of people claiming other’s houses by squatting in them when they are left unattended for an extended period of time. The preferential treatment that has been given to squatters over homeowners in recent years can be seen as the regime which controls the money printers throwing the plebs a bone as they struggle to get by, an attempt to push the productive class to violence against a state unwilling to respect private property rights, or a combination of the two.

Look at inflation if we use pre-1983 methods. Inflation is still roaring at 18%!

Broken money incentivizes governments to allow their borders to be bum rushed by cheap laborers who will take low paying jobs that enable the systemically fragile economy to keep chugging along while simultaneously increasing the chaos that already exists and diluting the values that the natives of this country believe in.

The excess and decadence enabled by a world run on broken easy money allows people to live in a detached reality that leads them to push objectively false narratives. This is why there are running debates about gender and a retreat from merit based compensation.

All of this stems from broken money.

The chart above should act as a reminder to you all that the biggest problem in the world right now is the money. The chart above should also prove to you that the most powerful people throughout the economy are going to fight tooth and nail to protect the broken money because they benefit massively from the fact that it is broken.

Keep this in mind as the chaos increases and narratives begin to form around using bitcoin as money. But we will never see inflation “normalizing” as long as Congress and Biden keep spending money.

Here are 3 of the BIG SPENDERS, Obama, Biden and Insider trader pro Pelosi. Do any of them look like the care about the bottom 50% of net worth or inflation??

Pork Barrell Chuck And Gaslight Joe! $60 Million For Ukraine, $0 For US Border Disaster (Purchasing Power Of Dollar Down -16% Under Biden)

Its Pork Barrell Chuck Schumer and Gaslight Joe Biden! Always ready to lie (gaslight) and spend trillions that we don’t have.

A new $1.2 trillion government spending package Congress is trying to ram through faces significant headwinds in the House, where members are expected to vote on it later this morning.

The 1,012-page bill was introduced at around 3am Thursday morning – just 48 hours before a midnight Friday funding deadline. It must pass both the House and the Senate, after which President Biden will sign it (with crayons at the ready, we’re sure).

The package accounts for approximately 70% of discretionary government spending – and consists of six out of twelve total bills that Congress must pass each fiscal year to fund the government. The six others, around $460 billion in spending, were passed earlier this month.

According to Fox News, multiple GOP sources, two GOP lawmakers and one senior GOP aide think the package will pass, but by a tight margin.

On Thursday afternoon, however, the bipartisan deal hit turbulence – with one GOP lawmaker citing absurd pork contained within – including funding for LGBTQ centers and facilities that provide late-term abortions.

Pork City

As usual, Democrats slipped in as much pork as possible, including:– $850k for a gay senior home- $15 million to pay for Egyptian’s college tuitions- $400k for a gay activist group to teach elementary kids about being trans- $500k for a DEI zoo- $400k for a group to gives clothes to teens to help them hide their gender

$60,000,000,000 for Ukraine (of course). NOTHING for US border.

$1,140,000,000,0000 for pork barrelling

1.2 trillion in inflation, an increase of the money supply by 2% in a single spending bill.

The US Dollar’s purchasing power is down -16% under Gaslight Joe.


Existing Home Sales Prices Explode In February (Median Selling Price Rose 5.7% to $384,500 From Last Year, Highest For Any February Back To 1999)

February’s existing home sales are like a scoop of cottage cheese. Seemingly satisfying until you look more closely at the data (or get hungry 30 minutes later).

Existing home sales soared a stunning 9.5% MoM in February, smashing the expectation of a 1.3% decline and building on the 3.1% MoM in January. However, even with the big monthly jump, existing home sales remain down 3.3% YoY…

Source: Bloomberg

Total existing home sales SAAR surged to 4.38mm – a 12 month high…

Source: Bloomberg

Homeowners may be accepting that mortgage rates are settling into a new normal and can’t delay moving any longer, NAR Chief Economist Lawrence Yun said on a call with reporters.

“Additional housing supply is helping to satisfy market demand,” Yun said in a statement.

“Housing demand has been on a steady rise due to population and job growth, though the actual timing of purchases will be determined by prevailing mortgage rates and wider inventory choices.”

With a 2-month lag, we can see why existing home sales may have risen, but with mortgage rates rising since then, we suspect the fun and games may come to an end again soon (even if the NAR economist thinks otherwise)…

The number of previously owned homes for sale climbed to about 1.07 million last month, and Yun said he expects that will continue to go up. At the current sales pace, selling all the properties on the market would take 2.9 months, the lowest in about a year.

Realtors see anything below five months of supply as indicative of a tight market.

Even with greater inventory, strong demand put upward pressure on prices. The median selling price advanced 5.7% to $384,500 from a year ago, the highest for any February in data back to 1999.

Sales rose in three of four regions, led by a 16.4% surge in the West

First-time buyers made up 26% of purchases in February, matching the lowest on record.

Mortgage Woes Continue! Purchase Applications (Demand) Now Down 14% From Last Year

The woes for the mortgage market continue under President Magoo.

Mortgage applications decreased 1.6 percent from one week earlier, according to data from the Mortgage Bankers Association’s (MBA) Weekly Mortgage Applications Survey for the week ending March 15, 2024.

The Market Composite Index, a measure of mortgage loan application volume, decreased 1.6 percent on a seasonally adjusted basis from one week earlier. On an unadjusted basis, the Index decreased 1 percent compared with the previous week. The seasonally adjusted Purchase Index decreased 1 percent from one week earlier. The unadjusted Purchase Index decreased 1 percent compared with the previous week and was 14 percent lower than the same week one year ago.

The Refinance Index decreased 3 percent from the previous week and was 3 percent lower than the same week one year ago.

Between The Fed’s announcement of rate changes and The Biden Crime hearings in DC (where Hunter of course failed to appear), there is plenty to keep us occupied.

US Home Buyers Need to Earn $47,000 More Than in 2020 (The Income Needed To Afford A Home Up 80% Since 2020, While Median Income Has Risen 23%)

How bad is Bidenomics for the American middle class? We know that inflation is far higher under China/Ukraine Joe (even with those awful looking Hoka shoes), but the pain that is being felt is attrocious.

Home shoppers today need to make more than $106,000 to comfortably afford a home. That is 80% more than in January 2020, showing how the math has changed for hopeful buyers, who are more often partnering with friends and family or “house hacking” their way to homeownership. 

Housing costs have soared over the past four years

A monthly mortgage payment on a typical U.S. home has nearly doubled since January 2020, up 96.4% to $2,188 (assuming a 10% down payment). 

Home values have risen 42.4% in that time, with the typical U.S. home now worth about $343,000. Mortgage rates ended January 2020 near 3.5%, keeping the cost of a home affordable for most households that could manage the down payment. At the time of this analysis, mortgage rates were about 6.6%. 

Wages have not kept up

In 2020, a household earning $59,000 annually could comfortably afford the monthly mortgage on a typical U.S. home, spending no more than 30% of its income with a 10% down payment. That was below the U.S. median income of about $66,000, meaning more than half of American households had the financial means to afford homeownership.

Now, the roughly $106,500 needed to comfortably afford the mortgage payment on a typical home is well above what a typical U.S. household earns each year, estimated at about $81,000.  

Buyers are teaming up, “house hacking,” and moving to more affordable areas

For a household making the median income, it would take almost 8.5 years before they would have enough saved to put 10% down on a typical U.S. home, about a year longer than it would have in 2020. It’s no wonder, then, that half of first-time buyers say at least part of their down payment came from a gift or loan from family or friends. 

With the cost of a mortgage rising, most millennial and Gen Z buyers say the ability to rent out all or part of a home for extra cash is very or extremely important. Cobuying with a friend or relative is another way to help with affordability, something 21% of last year’s buyers reported doingLong-distance movers are also targeting less expensive and less competitive metros.

Where a home is most and least affordable

Metro areas where a buyer could comfortably afford a typical home with the lowest income are Pittsburgh ($58,232 income needed to afford a home), Memphis ($69,976), Cleveland ($70,810), New Orleans ($74,048) and Birmingham ($74,338). The only major metros where a typical home is affordable to a household making the median income are Pittsburgh, St. Louis and Detroit.

There are seven markets among major metros where a household’s income must be $200,000 or more to comfortably afford a typical home. The top four are in California: San Jose ($454,296), San Francisco ($339,864), Los Angeles ($279,250) and San Diego ($273,613). Seattle ($213,984), the New York City metro area ($213,615) and Boston ($205,253) complete the list.

Methodology

Quarterly median household income is taken from the American Community Survey (ACS) and Moody’s Analytics through 2022. Present-day estimates use quarterly changes in the Employment Cost Index provided by the Bureau of Labor Statistics (BLS) to chain ACS income to the current day.

Years to save for a 10% down payment is the number of years it would take the median household to save for a 10% down payment on a typical home in their metro, assuming a 5% annual savings rate.

Income needed to afford a home with 10% down is defined as the income needed to afford the total monthly payment on the typical home. The total monthly payment is based on the monthly mortgage payment, insurance, property taxes, and annual maintenance costs of the home.

Of course, tech town San Jose and San Francisco lead the nation in income needed to afford a typical home in a market. Los Angeles and San Diego are third and fourth, followed by Seattle. Pittsburgh PA has a lowest income to afford a home, probably because they signed Russell Wilson AND Justin Fields at QB.

Nike has made a pair of shoes fitting Biden’s international image.

Too Much Debt (Coping With Bidenflation) And The Downside Of Federal Housing Policies (No Title Searches On Federally-insured Mortgages)

Households have too much debt, thanks to trying to cope with Bidenomics and Bidenflation.

And much of the debt burden falls on the middle class.

Serious auto delinquencies are on the rise.

And lowest earners saw the biggest increase in credit card delinquenices.

And who voters prefer as of today? Trump on interest rates and personal debt.

In addition to the absurd idea of removing title searches for government-guaranteed mortgages (now rely on attorney opinions), the Biden Administration is considering a homebuyer tax credit … that likely won’t help much.

And if you want to see which lenders have the largest concentrations of commercial real estate (CRE) loans, BankOZK takes the cake as the most concentrated lender.

The more the Biden Administration tries to “help” make housing more affordable, paradoxically makes housing even MORE unaffordable.

The Empire Strikes Out! NY General Business Conditions Crashes By -20.9 In March As Industrial Production Slows To -0.23% YoY In February

The Darth Vader theme seems appropriate for President Magoo’s economic malfeasance. Except that Mr. Magoo is a nice person, Biden is a mean-spirited and corrupt.

The NY Fed’s Empire State Manufacturing crashed and burned in March. NYFRB’s general business conditions index plunged 18.5pts in March to -20.9. A reading below zero indicates contraction, and the measure was weaker than all estimates in a Bloomberg survey of economists. Hey, I though illegal immigrantion was good for the economy!!!

Industrial production fell tp -0.23 YoY in February, not a stellar sign for the economy.

And how about the yield curve?

Weekly Jobs Reports Doesn’t Capture The Disastrous US Jobs Market (Biden’s “Take This Job And Shove It” Economy)

As Johnny Paycheck sang, “Take This Job And Shove It”. Apparently, we are seeing a number of firms scaling back on their workforce.

As a reminder, in the real world labor market, 2024 has been a shitshow of layoffs…

1. Everybuddy: 100% of workforce
2. Wisense: 100% of workforce
3. CodeSee: 100% of workforce
4. Twig: 100% of workforce
5. Twitch: 35% of workforce
6. Roomba: 31% of workforce
7. Bumble: 30% of workforce
8. Farfetch: 25% of workforce
9. Away: 25% of workforce
10. Hasbro: 20% of workforce
11. LA Times: 20% of workforce
12. Wint Wealth: 20% of workforce
13. Finder: 17% of workforce
14. Spotify: 17% of workforce
15. Buzzfeed: 16% of workforce
16. Levi’s: 15% of workforce
17. Xerox: 15% of workforce
18. Qualtrics: 14% of workforce
19. Wayfair: 13% of workforce
20. Duolingo: 10% of workforce
21. Rivian: 10% of workforce
22. Washington Post: 10% of workforce
23. Snap: 10% of workforce
24. eBay: 9% of workforce
25. Sony Interactive: 8% of workforce
26. Expedia: 8% of workforce
27. Business Insider: 8% of workforce
28. Instacart: 7% of workforce
29. Paypal: 7% of workforce
30. Okta: 7% of workforce
31. Charles Schwab: 6% of workforce
32. Docusign: 6% of workforce
33. Riskified: 6% of workforce
34. EA: 5% of workforce
35. Motional: 5% of workforce
36. Mozilla: 5% of workforce
37. Vacasa: 5% of workforce
38. CISCO: 5% of workforce
39. UPS: 2% of workforce
40. Nike: 2% of workforce
41. Blackrock: 3% of workforce
42. Paramount: 3% of workforce
43. Citigroup: 20,000 employees
44. ThyssenKrupp: 5,000 employees
45. Best Buy: 3,500 employees
46. Barry Callebaut: 2,500 employees
47. Outback Steakhouse: 1,000
48. Northrop Grumman: 1,000 employees
49. Pixar: 1,300 employees
50. Perrigo: 500 employees

But, according to the government-supplied data…

The number of American filing for jobless benefits for the first time last week dropped to 209k (vs 218k exp) with the NSA number tumbling to 200k…

Source: Bloomberg

How is this possible, you may ask… well let us show you the ways… New York State claims that its jobless benefits rolls collapsed last week. New York accounted for 99.75% of the weekly change in initial claims across the entire US as shown below…

Source: Bloomberg

Continuing Claims was a shit show – with a massive 112k person downward revision for last week from 1.906 million to 1.794mm. That is the 5th straight weekly downward revision of continuing claims…

Source: Bloomberg

But thanks to the adjustments, it all looks ‘normal’ and ‘stable’ at around 1.8 million Americans…

Source: Bloomberg

And WARN numbers are rising rapidly…

Source: Bloomberg

As a reminder, if you doubt the accuracy of the Biden admin’s data, here’s what the most recent FOMC Minutes said:

“While the recent trends prior to the meeting had been remarkably positive, Fed officials judged that some of the recent improvement “reflected idiosyncratic movements in a few series.”

Even they aren’t buying it, and neither should you!