According to Real Clear Politics, the generic Republican polling data FAVORABLE (red line) is at 47.9% while Democrat polling data favorable polling data (yellow line) is at 45.4%, advantage Republicans.
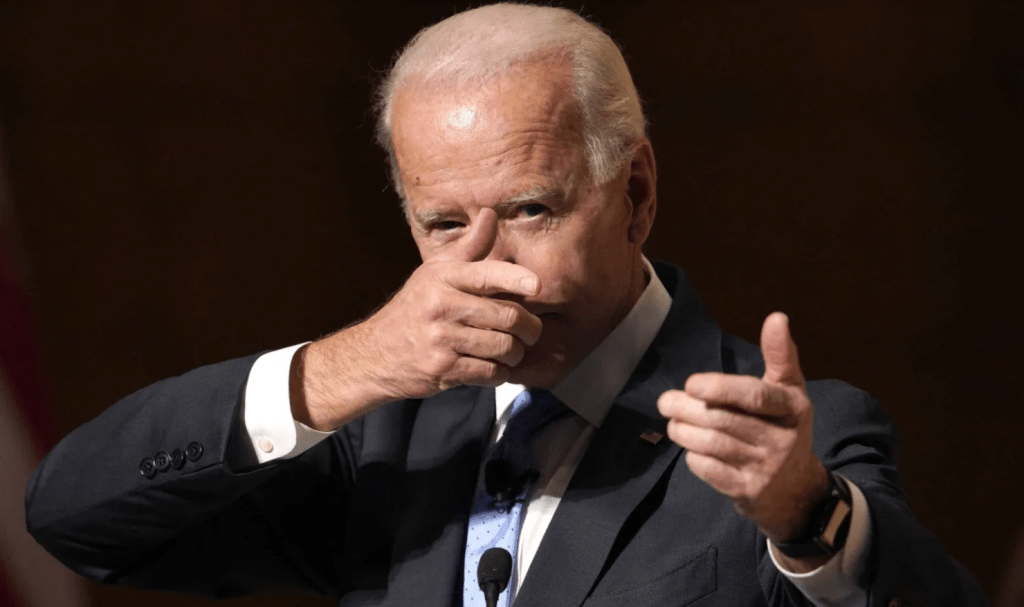
Biden has been a disaster as President (energy mandates, Afghanistan debacle, endless funding of Ukraine, highest inflation in 40 years, and every time he opens his mouth. But it is the “kitchen table” issues where Biden is getting clobbered: inflation, rising gas, food and diesel prices. One Democrat Congressman, Sean Patrick Maloney, said “Let them eat Chef Boyradee.” I can’t believe how tone deaf some politicians can be.
Biden’s UNFAVORABLE polling numbers (orange line) are directly related to the US headline inflation rate. Inflation was 1.4% YoY when Biden became President and it is now 8.2% YoY (blue line).
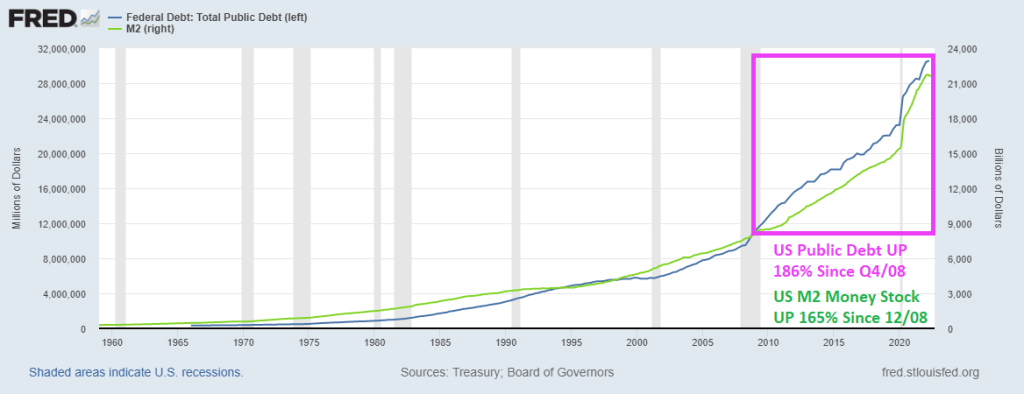
Ever since the financial crisis of 2008 and the election of President Obama and a Democrat Congressional sweep, the US has embraced Modern Monetary Theory (MMT or borrow, print and spend without consequence). And between the financial crisis and the Covid crisis of 2008, we have seen an increase in US public debt from $10.7 trillion in Q4 2008 to a staggering $30.6 trillion as of Q2 2022. That is a staggering increase of 186% in only 14 years.
How about US Money stock? M2 Money stock has grown by 162.5% since the beginning of 2009 and the “Blue Wave” of 2008. And nothing has been the same.
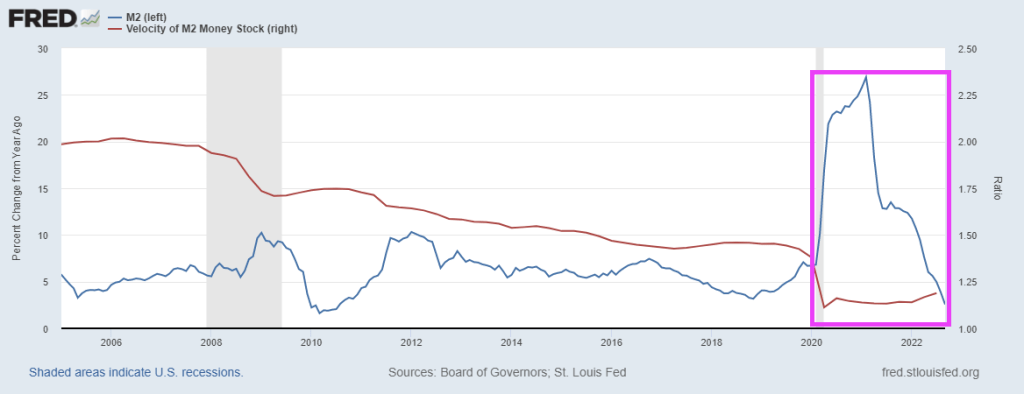
The Covid outbreak in early 2020, we saw Fed money printing that has never seen before … or since. But one thing is for sure, M2 Money Velocity (GDP/M2) is near all-time lows.
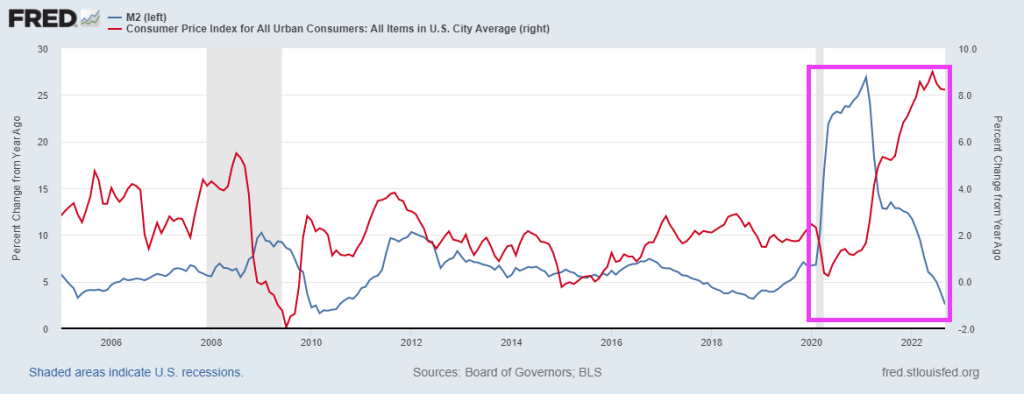
Then we have headline US inflation as a function of M2 Money growth YoY.
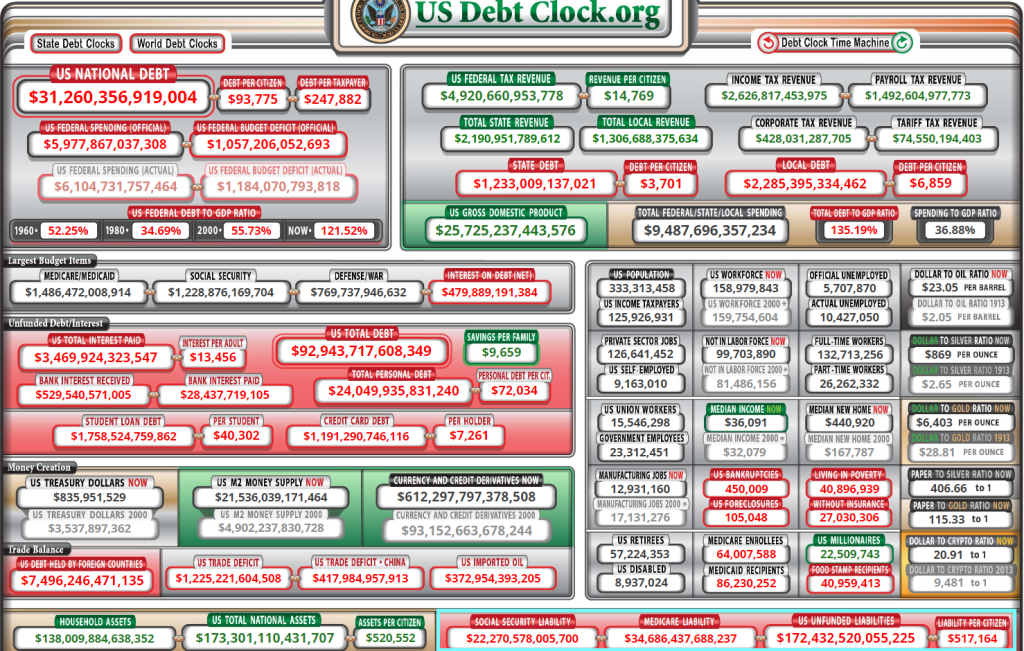
And it is the midterm election “silly season” where no politician will discuss the complete and utter mess they have made. According to US Debt Clock, US national debt is already up to $31.26 trillion (OMG!), but the REALLY scary number that not a single politician will address is UNFUNDED LIABILITIES OF $172.4 TRILLION.
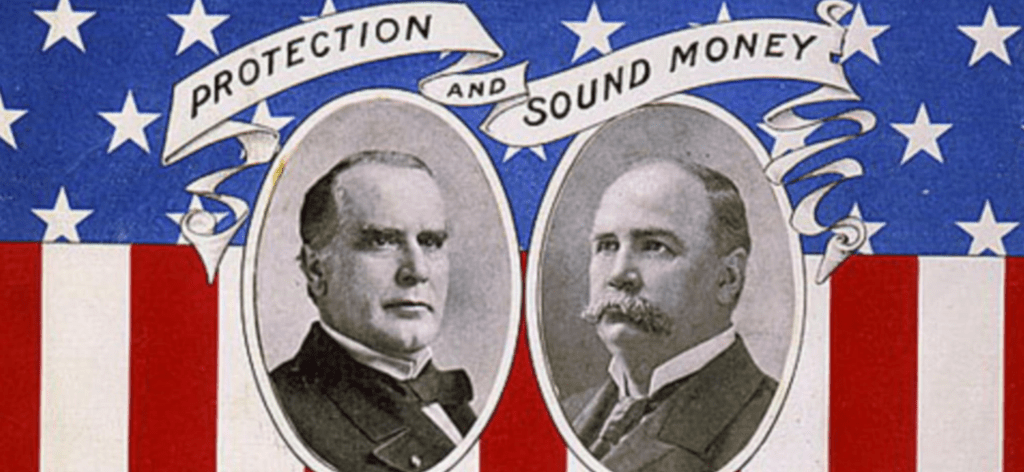
Can we go back to the gold standard? Or silver standard? Or ANY standard for that matter??
Instead, we have porous borders and patently UNSOUND money, thanks to MMT.
In addition to rampant 40-year highs in inflation, we have the Clark Griswold of the economy, Fed Chair Jerome Powell, slamming his foot on the economic breaks to combat inflation created by Biden’s energy mandates and reckless Federal spending (like the aforementioned, laughable “Inflation Reduction Act.”
So, Biden helps creates massive inflation and Powell and the Gang counterattacked by raising their target rate with more to come (at least until May 2023). And with the implied Fed Funds rate soaring (red line), we are seeing the FANG stocks (Facebook or Meta, Amazon, Netflix and Google) falling more rapidly (white line) than the S&P 500 index. Which is also falling like a rock (yellow line). All this is happening as M2 Money YoY crashes and burns.
How about growth versus value under Cousin Eddie and Clark Griswold? The Vanguard Growth ETF and Vanguard Real Estate ETF are plunging with Fed tightening (red line). Vanguard’s Value ETV (yellow line) is down too, but not by as much.
Yes, Washington DC elites. The gift that keeps on giving … bad things.
Thanks to my former GMU student Andrew Edwards for the Cousin Eddie suggestion!
On a YoY basis, US Productivity is down for the 3rd straight quarter (and 4th quarter of the last 5).
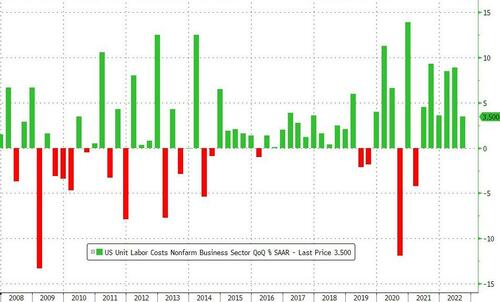
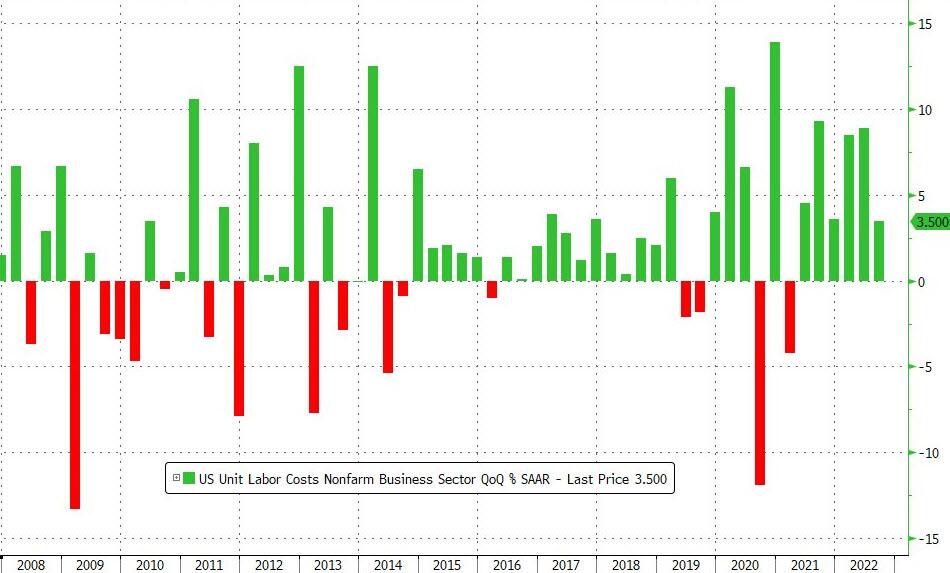
On the mirror image of productivity, unit labor costs rose 3.5% QoQ (a notable slowing from the 8.9% QoQ growth in Q2). This was the 6th quarter in a row of rising unit labor costs (but was less than the +4.0% QoQ expected)…
However, on a YoY basis, that is the fastest growth since Q3 1982.
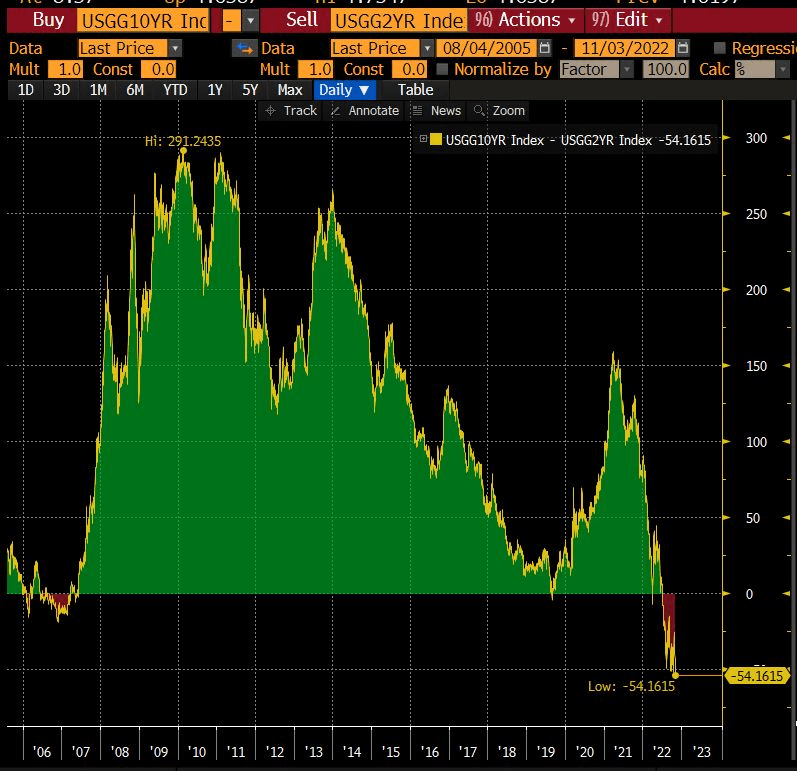
Yikes! The 2s10s Yield Curve Inversion Is the worst since the 1980s.
The Bank of England followed the Fed’s 75 basis-point increase with an equivalent hike on Thursday, but strongly pushed back against market expectations for the scale of future increases, warning that following that path would induce a two-year recession. The pound fell 1.8% to $1.1183.
Stocks and bonds fell as Jerome Powell’s warning that the Federal Reserve would raise interest rates more than previously anticipated sapped risk appetite. The dollar gained.
Futures on the S&P 500 fell 1% in the wake of Wednesday’s 2.5% drop. The selloff spread to Europe and Asia, where China’s affirmation of its Covid-Zero stance dashed hopes of a reopening. Lumen Technologies Inc., Peloton Interactive Inc., Moderna Inc. and Qualcomm Inc. tumbled in premarket trading, while Etsy Inc. and EBay Inc. rose.
So, the BofE, Fed and ECB are back to 2008/2009 era central bank rates.
But the US Fed is slow to shrink its enormous balance sheet.
The next Federal Reserve Open Market Committee (FOMC) meeting in on Wednesday, November 2nd. Let’s see what The Fed does with its BIG GREEN BAG … OF MONEY.
As I set here on Sunday morning waiting to see how the Cleveland Browns will lose to cross-state rival Cincinnati Bengals, I see that both the US Treasury 10yr-2yr and 10yr-3mo yield curves are inverted (below zero).
Core inflation (CPI less food and energy) YoY (blue line) was only 1.3% in February 2021 shortly after Biden was sworn-in as President and is now 6.6% in September 2022. That is over a 400% increase in core inflation!
We have this tantalizing headline on Bloomberg:
Goldman Sachs Now Sees Fed Rates Peaking at 5% in March By Simon Kennedy(Bloomberg) —
Goldman Sachs Group Inc. economists said they now expect the US Federal Reserve to raise interest rates to 5%, higher than previously predicted.
The central bank will lift its benchmark rate to a range of 4.75% to 5% in March, 25 basis points more than earlier expected, economists led by Jan Hatzius wrote in an Oct. 29 research report.
The route to the new peak includes increases of 75 basis points this week, 50 basis points in December and 25 basis points in February and March, they said.
The economists cited three reasons for expecting the Fed to hike beyond February: “uncomfortably high” inflation, the need to cool the economy as fiscal tightening ends and price-adjusted incomes climb, and to avoid a premature easing of financial conditions.
Well, not exactly earth-shattering. Fed Funds Futures data point to a peak of near 5% (4.905%) for the May 2023 FOMC meeting, so Goldman Sachs is calling for an earliest peak at the March 2023 FOMC meeting,
Regardless of what Goldman Sachs thinks, Fed officials are expecting a peak in 2023 followed by a decline to 2.5%.
Brainard and Bostic are the only “doves.” Which is silly because Chicago’s Evans is a perma-dove. Let’s see how the Dots Plot changes at the November 2nd meeting.
America’s distressed debt pile is biggest since September 2020.
US Q3 GDP numbers are out and they are … meh. Only Biden and Karine Jean-Pierre would cheer about 1.8% real GDP growth. At least real GDP growth wasn’t negative!
Real GDP rose 2.6% after -0.6% in Q2 and 1.8% YoY. But the most interesting data bit is the GDP Price Index. It fell to 4.1% in Q3 down from a whopping 9.0% in Q2.
But wait! Also declining at a stall speed is M2 Money.
And brace yourself for a cold winter. Heating oil is UP 162% under Biden.


You must be logged in to post a comment.