Face it. No one in Washington DC wants to close the border. Republicans supporting big agriculture support open borders and cheap labor, Democrats love open borders for political gains, despite open borders meaning a flood of migrants and depressing job prospects for native born Americans.
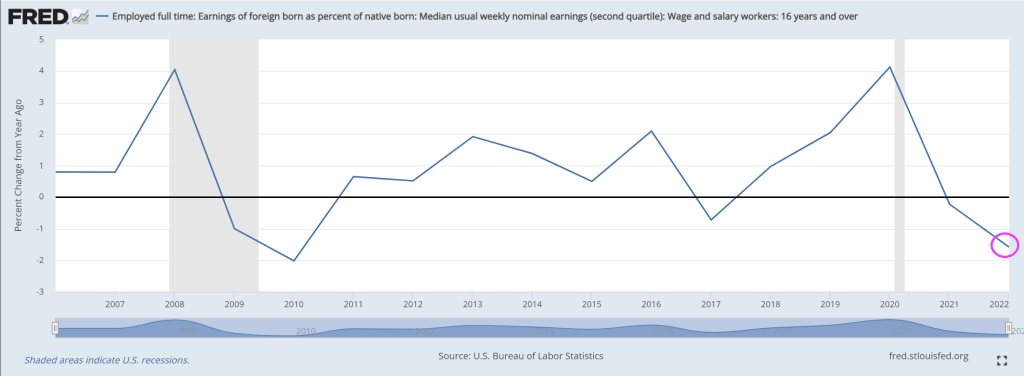
Case in point. Under the leadership of Biden (more like a followship because Biden clearly isn’t in charge of anything), the native born labor force (blue line) grew by 3.6%. However, the foreign born labor force (red line) grew by 14.6%.
The media focused on 1 million jobs lost for native-born and a gain of 697k jobs for foreign-born. But this claim is misleading. Look at the month to month changes in the labor force since 2020 (pink box). In several past months, we witnessed the same thing … native born job losses when foreign born gained jobs. But several months had the exact opposite. It is the overall trend that is alarming: native born jobs only grew 3.6% under Vacation Joe Biden while foreign born jobs grew 14.6%.
If we look at Employed full time: Earnings of foreign born as percent of native born: Median usual weekly nominal earnings (second quartile): Wage and salary workers: 16 years and over, we see that the YoY growth rate of earnings for foreign born declining. I attribute this to open borders and the influx of unskilled, largely uneducated immigrants pouring over the southern border.
Biden’s biographer claims that Biden is worried that he will be remembered as “Stupid.” Well, Biden IS stupid. But he is also the most corrupt President in history.
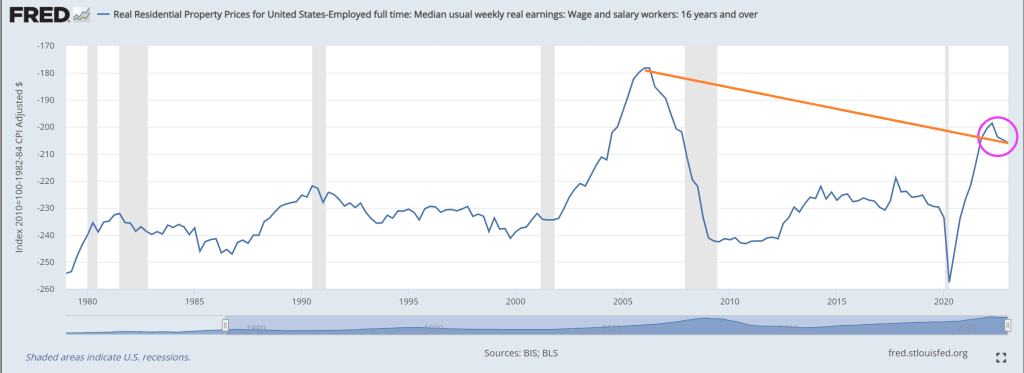
You know Bidenomics isn’t working at all when the best I can say about it is … the current housing bubble isn’t as bad as the house price bubble of 2006. We are truly in Biden’s ShamWow economy!
Yes, if I look at real home prices less real median earnings we can see that the ratio, while terrible, is still not as bad as the housing bubble of 2006.
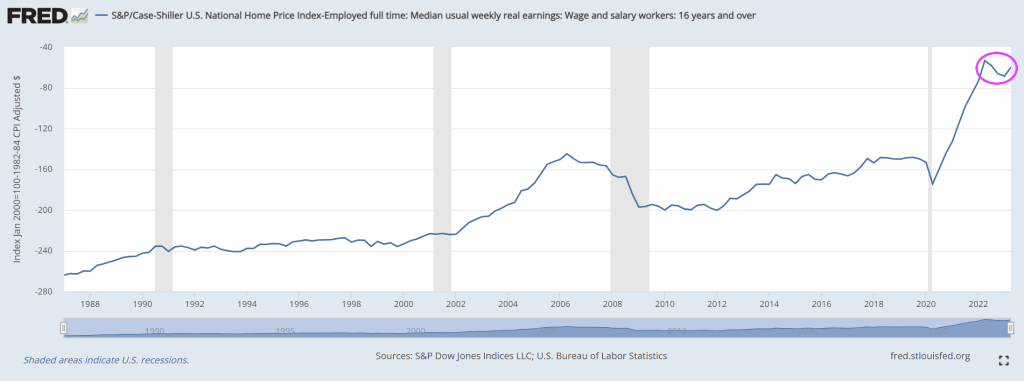
If I look at Case-Shiller National home price index less REAL median earnings, it is now far worse than in 2006.
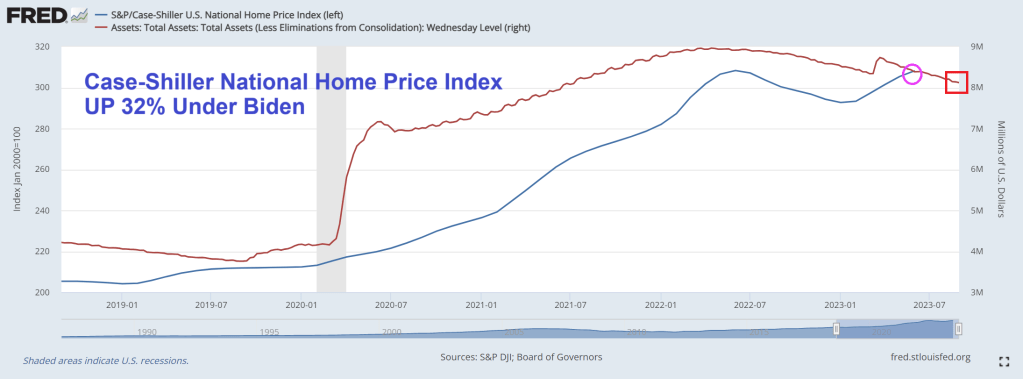
But home prices are still up 32% under Biden
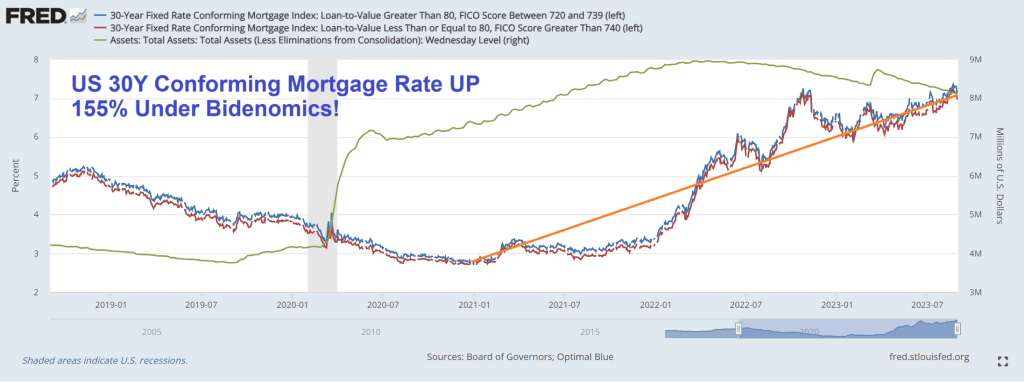
While the 30-year conforming mortgage rate is up 155% under Vacation Joe.
It should be GREEN ShamWow!. The money seems to be disappearing into the pockets of green energy donors, and Ukraine.
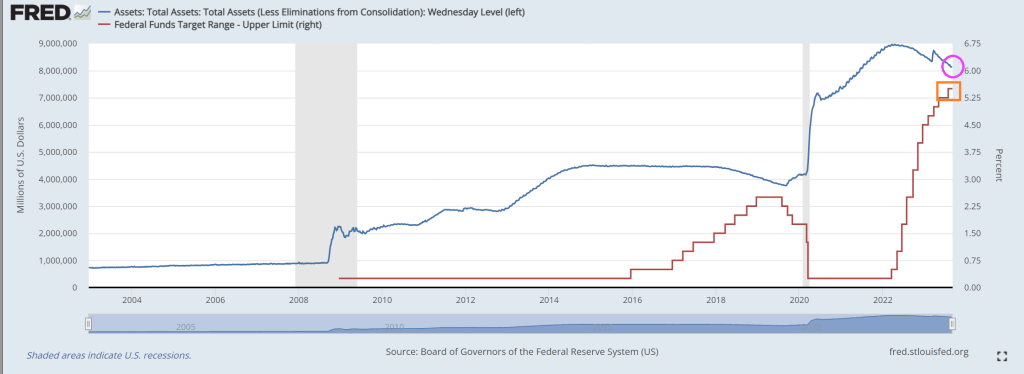
Under Bidenomics, there is still too much Fed monetary stimulus in the form of >$8 trillion on its balance sheet. While the biggest surge in Fed activity occurred with Covid, The Fed has added 10% to its balance sheet under Billions Biden.
Despite not backing off the assets purchases by The Fed, conforming 30Y mortgage rate is still up 155% under Bidenomics.
Yes, The Fed is raising its target rate to cool inflation, but doing little with its balance sheet.
The Case-Shiller national home price index is up 32% under Vacation Joe!
It seems prices are out of control and The Fed refuses to trim its balance sheet. But don’t worry, Vacation Joe is probably on yet another vacation while Maui and Flordia suffer and The Ukraine war is seeing bodies pile up. Meanwhile, he still hasn’t visited East Palestine Ohio like promised.
Soviet Joe Biden, who is a believer in Soviet-style command economies where rather than rely on free market capitalism, we now have CC (Crony Communism) running the US economy. Into the ground. But in the tradition of bad Federal policiies, Soviet Joe and Energy Secretary Granholm (with help from Congress) mandate green energy transition at all costs, watch the auto industry suffer, then bail them out. Sounds a lot of like the banking crisis of 2008 where The Federal government pushed homeownership until it helped almost collapse the banking sector, then the Federal government bailed out the banks. Rinse, repeat, bailout. And the bailout of banks in going! (Notice that The Fed has barely shrunk its $8+ trillion balance sheet!).
Automakers are looking to finish the week with strength after it was announced on Thursday that the Biden administration would be making “up to $12 billion” available to retrofit facilities to make both EVs and hybrids.
The money will include $10 billion from a US Energy Department loan program for clean vehicles and an additional $3.5 billion in financing to expand domestic battery manufacturing, according to Bloomberg.
The United Auto Workers, currently in negotiations with Detroit, has argued that a shift to EVs will cost the industry union jobs. US Energy Secretary Jennifer Granholm said on Thursday that the funding would help Detroit retain workers.
However, we’ve seen this “bailout” business model to save jobs before – at banks and during Covid, to name two examples – and it always winds up turning into a company cash grab before ultimately firing workers regardless. The UAW will try to prevent such a situation from taking place as it negotiates.
UAW President Shawn Fain “cautiously” welcomed the news after warning earlier this month that the White House should not push an EV agenda if it means the loss of jobs in Detroit.
Almost like the government should stay out of the auto industry as a whole, right? But that would make too much sense.
“The EV transition must be a just transition that ensures auto workers have a place in the new economy,” Fain said this week. Meanwhile, the Alliance for Automotive Innovation, a Washington lobby group that represents most Detroit automakers, said this week the funding “will further advance the domestic automotive supply chain and globally competitive battery manufacturing platform that automakers have already made sizable investments.”
Instead, Bloomberg calls the move the Biden administration “doubling down on efforts to support carmakers’ transition to EVs”. In a statement this week, President Biden said: “This funding will help existing workers keep their jobs and have the first shot to fill new good jobs as the car industry transforms for future generations.”
The Biden administration continues to aim for half of all vehicles on the road being EVs by 2030.
Oh and now that UAW Boss seeks 46% raise and 32-hour work week. Reminds me of Federal student loans where students run up massive amounts of debt to major in useless degrees like political “science” and gender/race studies, yet universities hire more admininstrators.
Covid is the gift that keeps on giving … to lazy bureaucrats and teachers union members. And a horror for small businesses and students since small businesse go bankrupt and students suffer from lack of education. And now The Federal Government is fearmongering (hey, that’s all they do!) ANOTHER Covid outbreak with Deep State Joe Biden advocating for more Federal spending on vaccines and telling everyone to get yet ANOTHER vaccination. And wear useless masks as a sign of obidience to The Democrat Party.
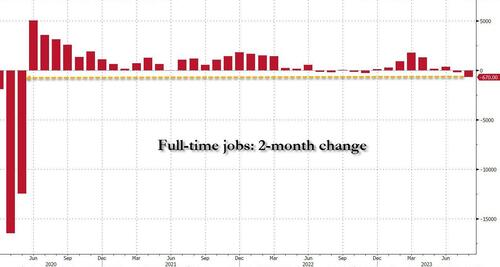
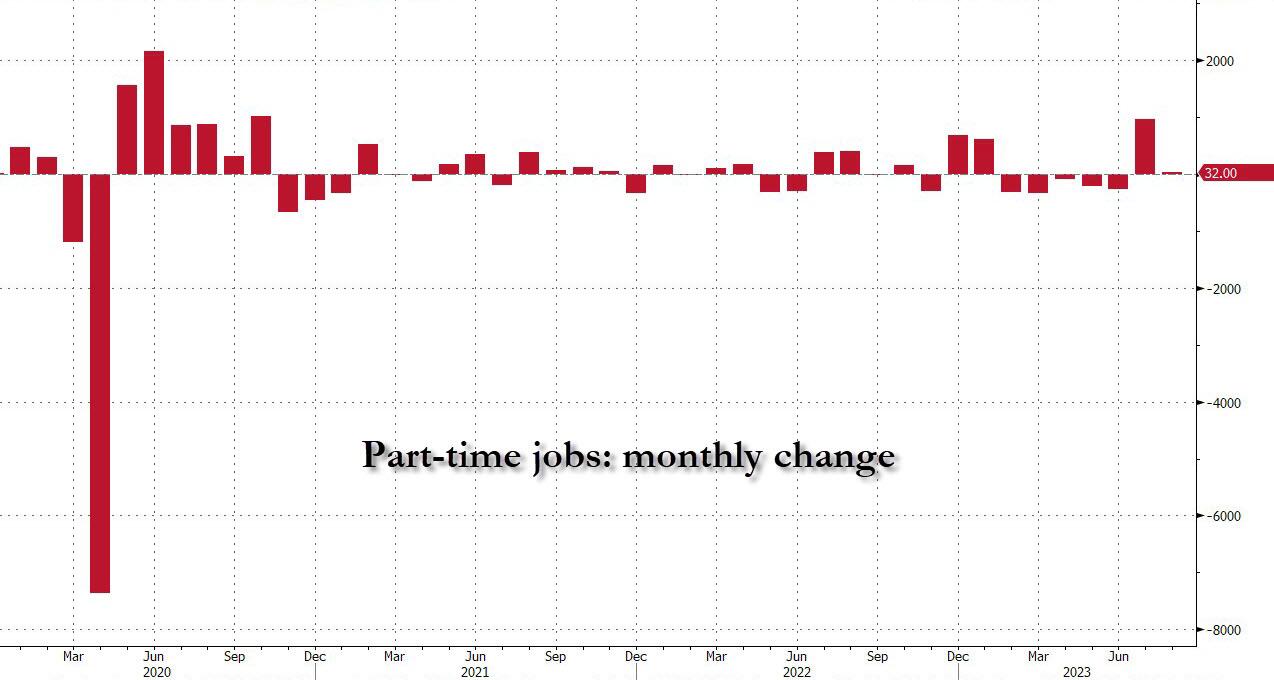
The Bureau of Labor Statistics (BLS) reported that in August the number of full-time jobs dropped again, sliding by 85K to 134.2 million, and followed the whopping 585K plunge in July which brings the two-month total drop in full-time jobs to a whopping 670K, the biggest 2-month plunge since the covid lockdowns in early 2020 when 12.5 million full-time jobs were lost in one month!
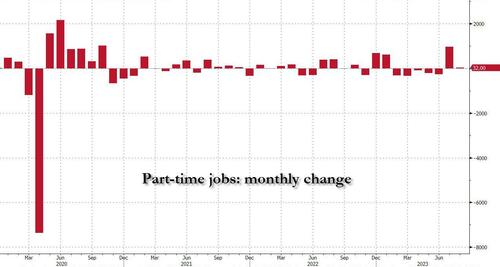
But if full-time jobs crashed how did the BLS get an increase of 222,000 employed workers? Simple: it was all in the latest jump of part-time workers. Indeed, in August the number of reported part-timers jumped by 32K and when added to the near-record 972K surge in July, the 2-month total was just over one million – 1,004,000 to be precise – to 27.185 million.
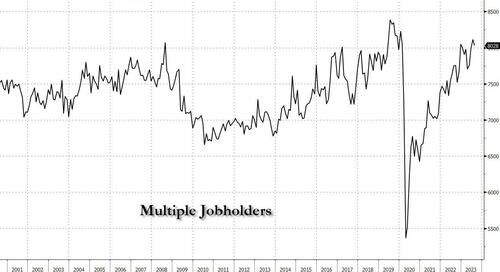
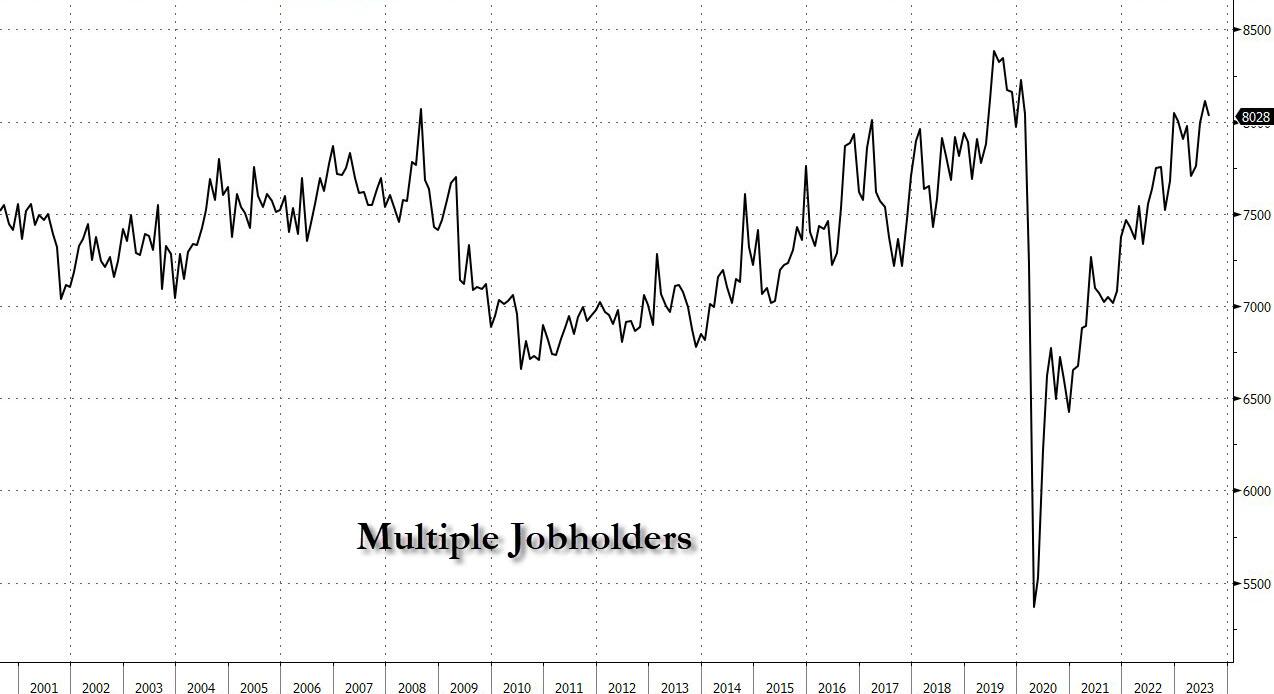
Going back to a quantitative read of the data, we look at the number of multiple jobholders – those workers who have to work more than one job at a time to make ends meet. In August this number was actually a modest silver lining, as it dropped by July, that number dropped by 85K to 8.028 million, but it remains just shy of the pre-covid record.
Given the extreme level of corruption in the Biden Administration, the Democrat Party should be renamed after New York’s Tammany Hall.
And require all people to wear a Tammany Hall fez instead of a mask.
The glories of Bidenomics is on fully display. Despite what Lyin’ Biden says, Bidenomics is only working for the elites (top 1%). How Soviet/CCP command economy of him!
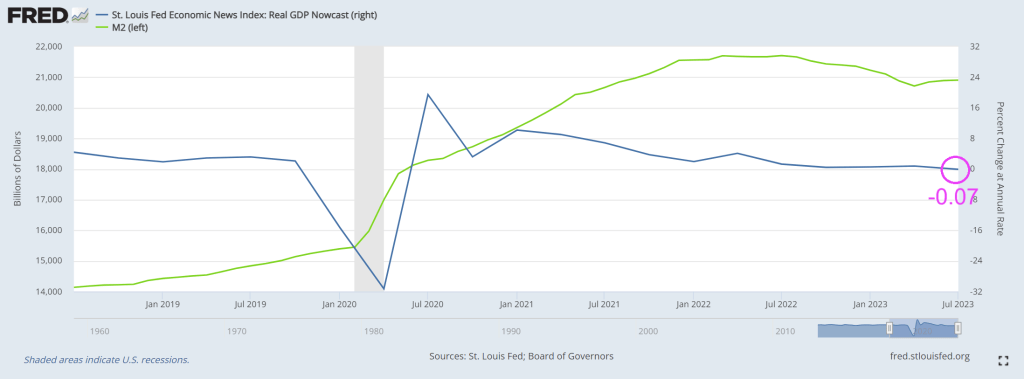
Here is an ugly chart showing Bidenomics in action! We all know that Covid unleashed a torrent of Fed monetary stimulus AND Federal spending on Covid relief and green energy subsidies (most to large Democrats donors). BUT we now have experienced 3 consectutive quarters of negative gross domestic income (GDI) growth. And nominal GDI growth is falling with falling M2 Money growth.
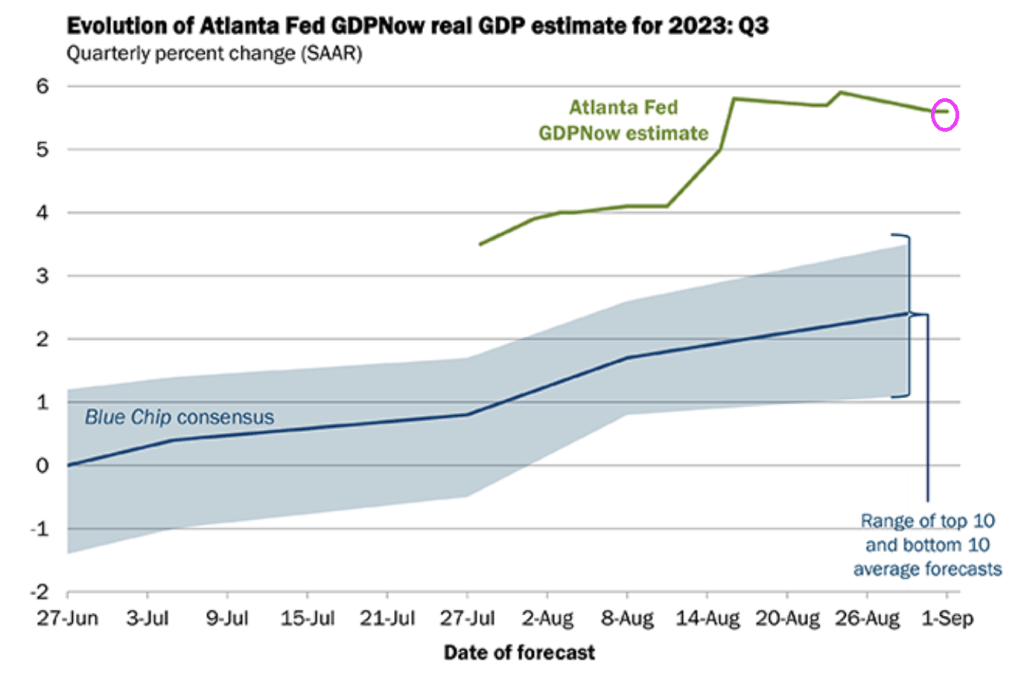
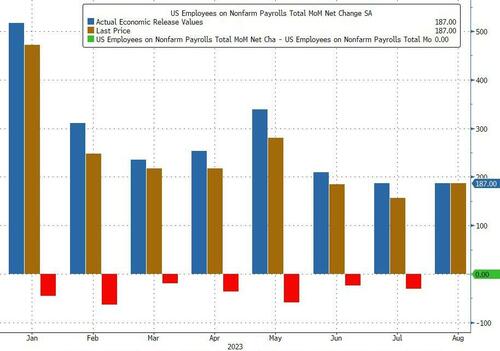
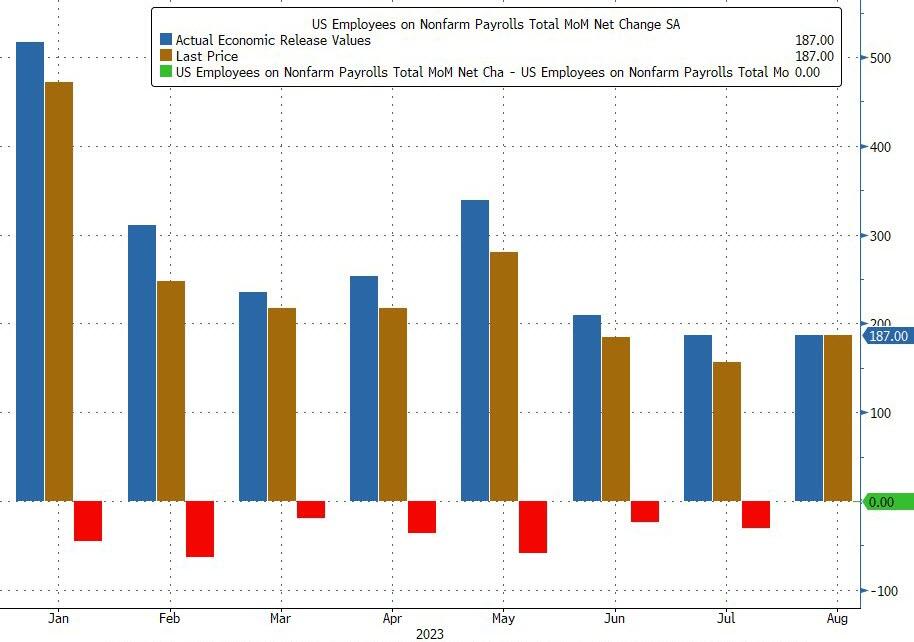
And today’s jobs report for August showed that only 187k jobs were added.
Superficially this would have meant an unchanged print from last month when the BLS also reported 187K jobs, however in keeping with recent trends that number was revised – drumroll – lower again, to 157K, meaning that every single monthly payrolls print in 20-23 has been revised lower (see chart below), a 12-sigma probability and virtually impossible unless there was political pressure to massage the data higher initially and then revise it lower when nobody is looking. (As if the mainstream media is at all honest!)
But wait there’s more: while July was revised down by 30K from +187,000 to +157,000, June was revised even more, by 80,000, from +185,000 to +105,000, which means that a number that was originally reported as 209K has been reivsed 50% lower, to 105K and a collapse vs original expectations of 230K. Here, the BLS was proud to report that “with these revisions, employment in June and July combined is 110,000 lower than previously reported.”
And we have The Conference Board’s confidence index at -65. Yikes!
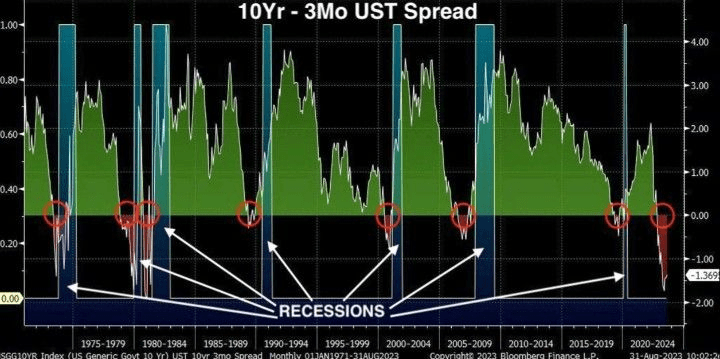
Finally, we have the 10Y-3M UST spread SCREAMING recession!
So, the economy is slowing under Bidenomics and Cadavar Joe.
Will Cadavar Joe actually go out on the campaign trail and debate ANY Democrat or Republican?? Remember, this is the man with the nuclear launch codes.
Another economic report on Bidenomics. This one is for housing.
Realtors Pending Home Sales Index (PHSI)* – a forward-looking indicator of home sales based on contract signings – rose 0.9% to 77.6 in July. Year over year, pending transactions fell by 14.0%. An index of 100 is equal to the level of contract activity in 2001.
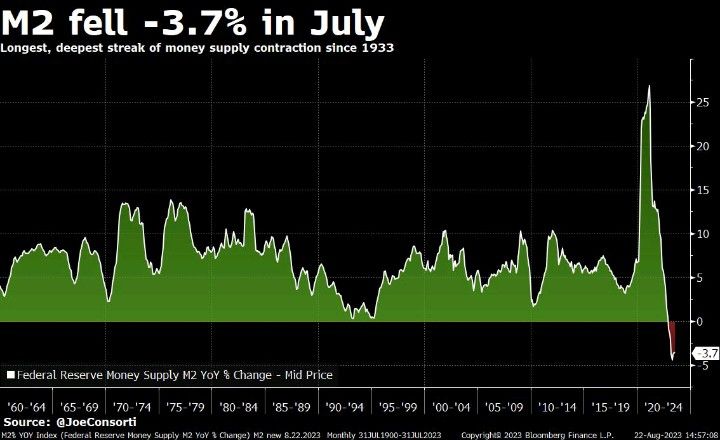
Combine that with crashing M2 Money growth (lowest since 1933 and The Great Depression (and The Dust Bowl). The difference is that the US had the soothing talks of Franklin Roosevelt “I can assure you that it is safer to keep your money in a reopened bank than under the mattress.” —President Franklin Roosevelt in his first Fireside Chat, March 12, 1933. Unfortunately, we have Joe Biden, the WORST public speaker in history and a completely unempathetic person.
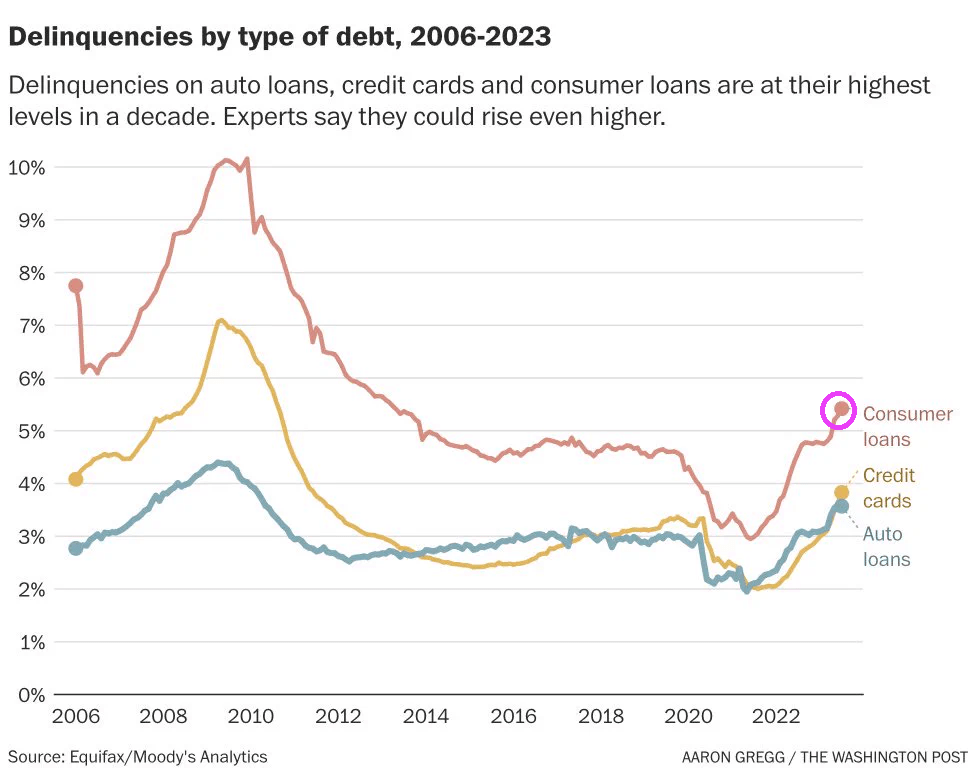
Delinquencies on auto loans, credit cards and consumer loans are at their highest levels in a decade.
Instead of Sleepy Joe, Middle Class Joe, Corrupt Joe (sounds like Cuppa Joe), and any of the multitude of unflattering nicknames, we now have REVEREND JOE.
Billions Biden, the President who loves to (recklessly) spend taxpayer money (mostly on large donors). is going to have difficuly spinnig the latest employment figures.
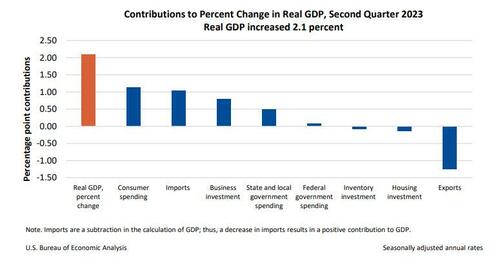
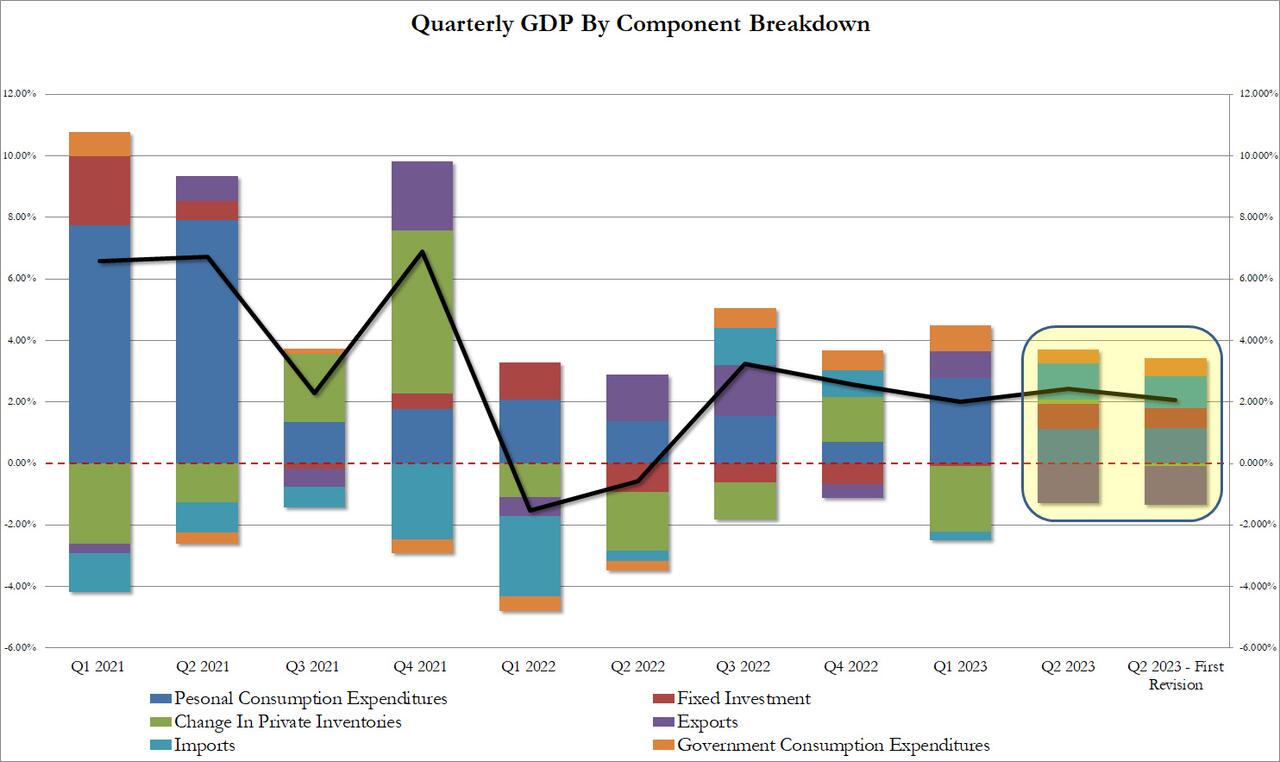
The GDP estimate released today is based on more complete source data than were available for the “advance” estimate issued last month. In the advance estimate, the increase in real GDP was 2.4 percent (refer to “Updates to GDP”). The updated estimates primarily reflecteddownward revisions to private inventory investment and nonresidential fixed investmentthat were partly offset by an upward revision to state and local government spending.
The increase in real GDP reflected increases in consumer spending, nonresidential fixed investment, state and local government spending, and federal government spending that were partly offset by decreases in exports, residential fixed investment, and private inventory investment. Imports, which are a subtraction in the calculation of GDP, decreased.
The revision according to the BEA, “reflected a smaller decrease in inventory investment and an acceleration in business investment. These movements were partly offset by a downturn in exports and decelerations in consumer spending and federal government spending. Imports turned down.” In short, everything was uglier,
Taking a closer look at the data, we find the following changes to the bottom line:
Personal consumption added 1.14% to the bottom line print or just over half, up from 1.12% in the original print; annualized this comes out to 1.7% which was below the 1.8% estimate.
Fixed investment contributed 0.66%, down from 0.83%
Change in private inventories now subtracting 0.09% from the bottom line number, a big swing from the positive 0.14% print in the original estimate. And it will be revised even lower next month as more of the “shrink” emerges.
Net exports were also revised lower, with gross exports trimmed from -1.28% to -1.26%, while imports were revised from 1.16% to 1.04%
Finally the ever handy plug that is government consumption (which is a garbage concept since the government does not actually create anything of economic value in the economy but merely allocated graft and embezzlement of public funding), actually rose from 0.45% to 0.58% (of bottom line GDP). Without this revision, Q2 GDP would have printed below 2.0%
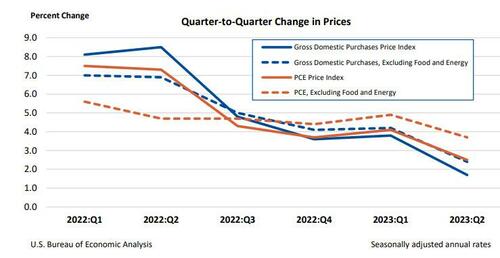
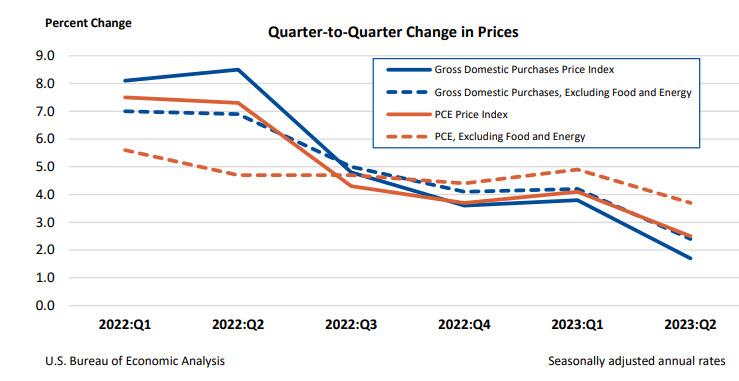
Separately, gross domestic purchases prices, the prices of goods and services purchased by U.S. residents, increased 1.7% in the second quarter after increasing 3.8 percent in the first quarter, above the 1.6% estimate last month but below the consensus 1.8%. Excluding food and energy, prices increased 2.4% after increasing 4.2%.
Personal consumption expenditure (PCE) prices increased 2.5% in the second quarter after increasing 4.1% in the first quarter. Excluding food and energy, the PCE “core” price index increased 3.7% after increasing 4.9%. This number was also revised lower from 3.8% and missed estimates of 3.8%.
Finally, the BEA reported corporate profits decreased 0.4% at a quarterly rate in the second quarter after decreasing 4.1% in the first quarter. Profits of domestic financial corporations decreased 12.1% after decreasing 2.3 percent. Profits of domestic nonfinancial corporations increased 0.9% after decreasing 5.0 percent. Profits from the rest of the world (net)increased 4.4 percent after decreasing 2.0 percent. Corporate profits decreased 6.5 percent in the second quarter from one year ago.
Needless to say, all this is a far cry from the rebound in corporate profits that companies themselves reported in their various GAAP and non-GAAP metrics, which is to be expected in a world where there is now an uncrossable chasm between economic data and its government fabrications.
Then we have M2 Money collapsing, down -3.7% in July. Longest, deepest contraction of money suppy since 1933.
Biden, making Zelenskyy rich again!! The US bought Zelenskyy a new villa! “The document indicates that the villa was purchased by Zelenskyy’s mother-in-law in May 2023. The price of the villa is 150,000,000 Egyptian pounds or approximately $4,850,000.” Thanks Biden!!! America last!


You must be logged in to post a comment.