Now that The Fed-induced-banking crisis has cooled … for the moment … I can focus on that mysterious positive homebuilder sentiment release from yesterday.
The sentiment was driven by 5+ unit (multifamily) starts which were up 24% in February, which 1-unit (single-family detached) starts were up only 1.10%. 23 consecutive months of NEGATIVE real wage growth and still ultra-high home prices begat lots of multifamily housing starts.
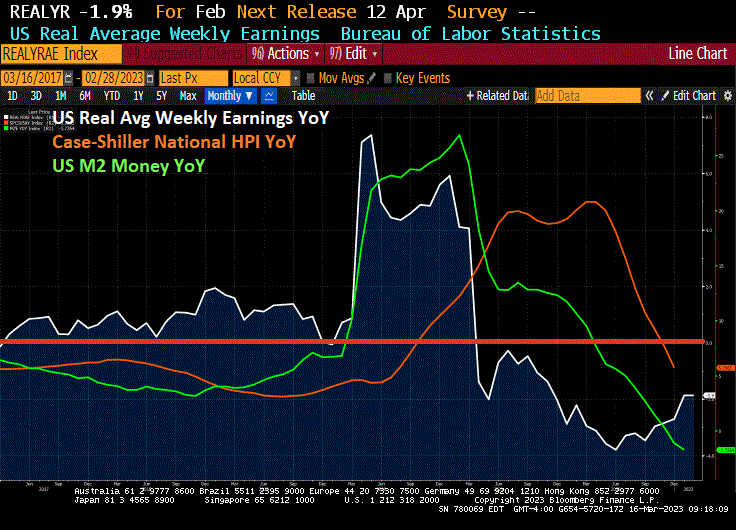
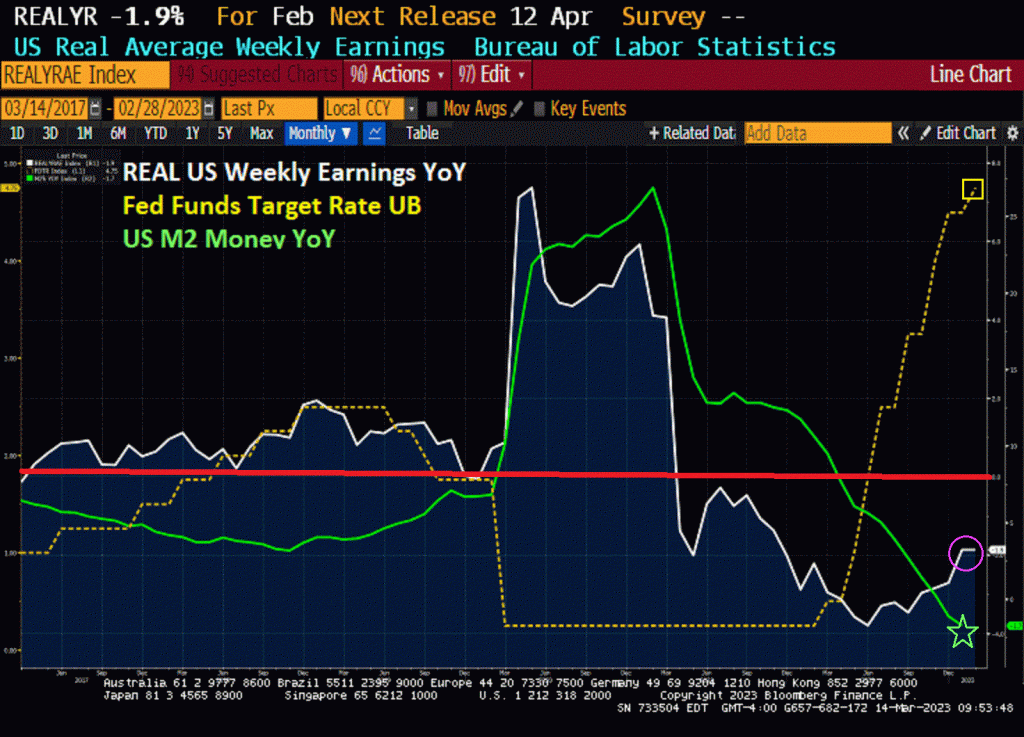
The problem for Americans is the real weekly wage growth has been negative for 23 consecutive weeks while home prices remain high, particularly after the Covid bailout by The Fed.
Argetina’s inflation rate just hit 102.5% as their M2 Money printing hit 80%
Argentina’s central bank is considering raising its benchmark rate on Thursday for the first time since September after inflation data showed prices increased by more than 100% annually last month, according to two people with direct knowledge.
The monetary authority’s board will consider an increase after leaving the key Leliq rate unchanged at 75% for several months, the people said, asking not to be named discussing internal decisions. The board has not yet decided on the size of the hike in case they opt for such move, they said.
A cautionary tale for Washington DC spendacrats and Fed officials.
Brought to the same country that gave us Statist Juan Peron and his wife Eva.
Apparently, the NEO financial crisis (not the subprime, but The Fed’s “too low for too long” crisis) is still with us.
Credit Suisse Group AG’s top shareholder, whose stake has lost more than one-third of its value in three months, ruled out investing any more in the troubled Swiss bank as a bigger holding would bring additional regulatory hurdles.
“The answer is absolutely not, for many reasons outside the simplest reason, which is regulatory and statutory,” Saudi National Bank Chairman Ammar Al Khudairy said in an interview with Bloomberg TV on Wednesday. That was in response to a question on whether the bank was open to further injections if there was another call for additional liquidity.
Credit Suisse says it has identified material weaknesses in its internal control over financial reporting as of December 31, 2022 and 2021, according to the annual report.
The material weaknesses relate to the failure to design and maintain an effective risk assessment to identify and analyze the risk of material misstatements in its financial statements and the failure to design and maintain effective monitoring activities relating to: – Providing sufficient management oversight over the internal control evaluation process to support the Group’s internal control objectives – Involving appropriate and sufficient management resources to support the risk assessment and monitoring objectives Assessing and communicating the severity of deficiencies in a timely manner to those parties responsible for taking corrective action
And it could simply be that Credit Suisse was caught in the Central Bank “Bear Trap” where banks get clobbered as interest rates rise.
Credit Suisse’s CDS (credit default swap) is soaring!
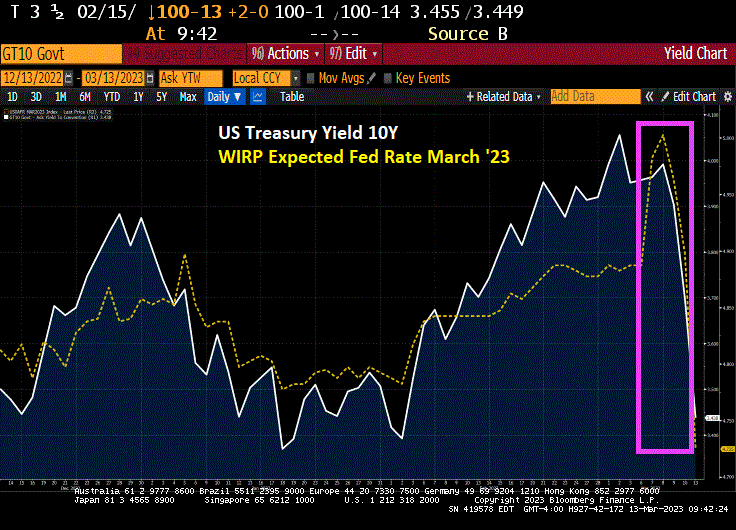
And on the “it ain’t over till its over” news from Credit Suisse, the US Treasury 2-year yield plunged -40.4 basis points.
And the US Treasury 10-year yield plunged -24.8 basis points.
The official logo of the Federal Reserve should be Munch’s The Scream.
Well, the banking fiasco CREATED BY THE FEDERAL RESERVE is still with us. Why? Because the FDIC guaranteed deposits above $250,000 for the first time in history, bailing out millionaires/billionaires. I call this Crony Socialism (but I repeat myself).
Congress doesn’t understand banking, only how to spend money.
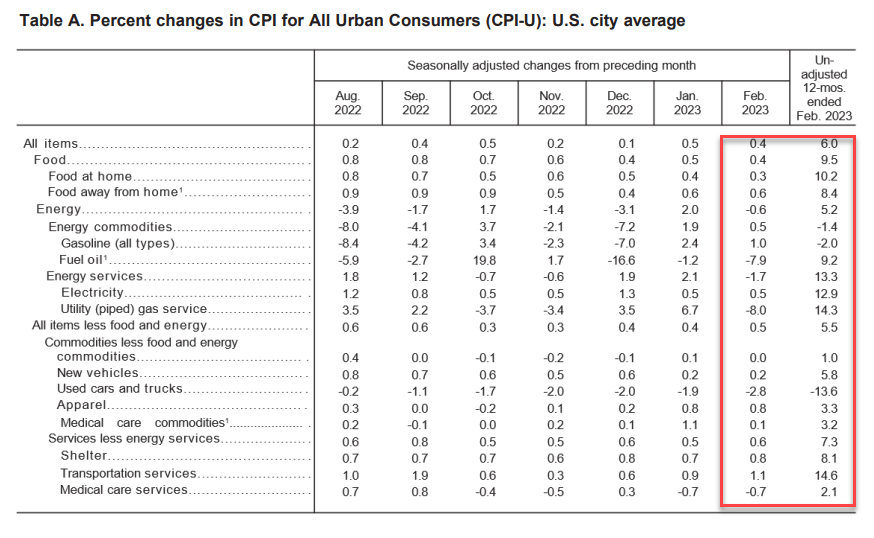
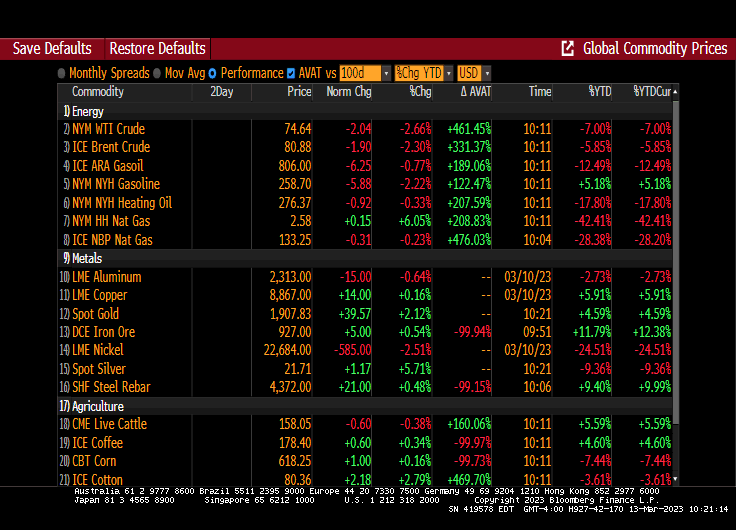
While headline inflation (CPI) came in a 6% (considerably higher than The Fed’s 2% target), core inflation came in at 5.5% year-over-year (YoY), which was expected.
The truly nasty number is today’s inflation report is that weekly earnings YoY remained the same at a terrible -1.9%. Meaning that inflation is higher than nominal wage growth. This is the 23rd straight month of negative real weekly earnings. Well done, Fed and Biden!
Food is up 10.2% YoY. Electricity up 12.9%, shelter up 8.1%.
On the news, the US Treasury 2-year yield rose 34.3 basis points.
Somehow I doubt that Biden’s press secretary will tout 23 straight months of negative weekly earnings growth as one of Biden’s economic accomplishments.
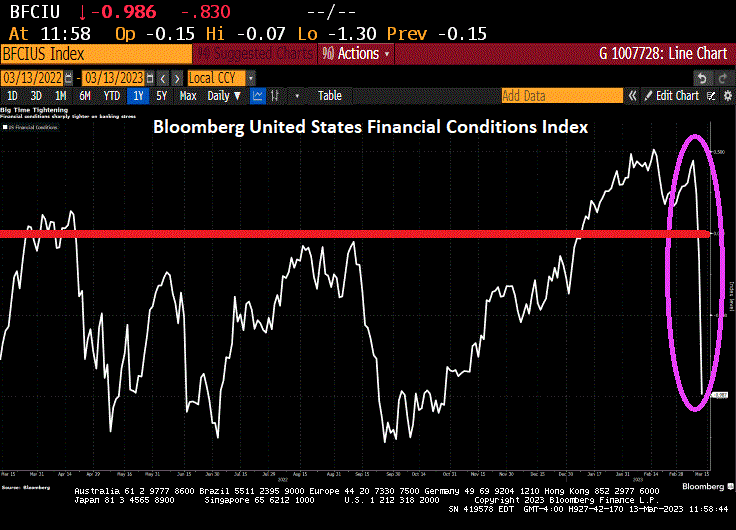
All together now. The Fed has been printing too much money for too long and Biden restricts fossil fuel production. Ad in rampant Federal spending and we have INFLATION. Inflation led to The Fed to raise rates. And with rate increases and down go the banks.
Of course, The Fed and Biden Administration will overeact (e.g. offering deposit insurance on ALL deposits above $250,000 creating moral hazard risk). As such, we are seeing gold prices soar by 2% this AM.
In adddition to gold rising 2%, natural gas futures are up 6%
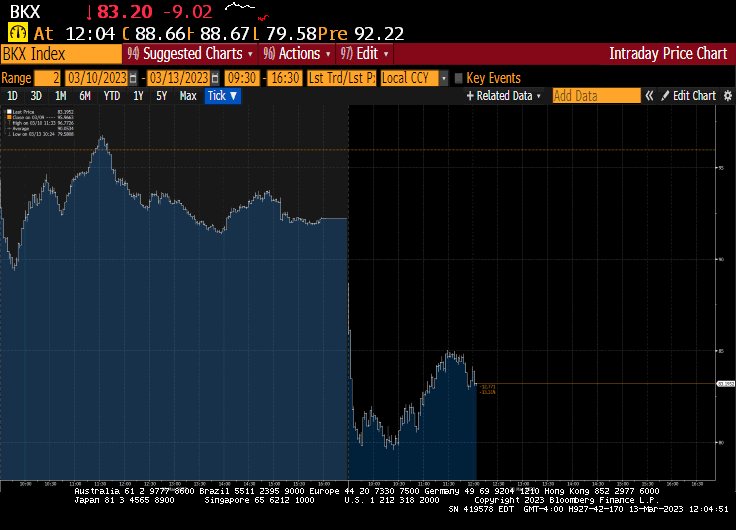
The Silicon Valley Bank failure (along with NY’s Signature Bank) are sending shock waves through the global economy. Not because of the incompetence of bank regulators, but because of the reaction function from the FDIC and Fed.
The 10-year Treasury yield is down -26 basis points in the AM. And the Fed Funds Target Rate is expected to drop to 4.7%.
Its not just the US Treasury yield that declined -26 basis points. European sovereign yields are down too (Germany 10-year is down -32.9 basis points).
Look at the 2-year Treasury yield. Its down -54.6 basis points.
On a sad note, Resident Biden is calling for stricter regulations for the banking industry, already one of the most regulated sectors of the economy. How about less politics and just make them do their ^*T^R jobs!
Despite cries from Summers, Yellen and other the DC illuminati (Biden is oddly silent), US banks are NOT fine. In fact, banks in general are suffering from Fed rates increases due to holding of long-term Treasuries and MBS.
In fact, The Federal Reserve’s fight against inflation is causing serious problems, as exemplified by AOC. No, not THAT AOC. but bank Accumulated Other Comprehensive Income.
Accumulated Other Comprehensive Income (AOCI) are special gains and losses that are listed as special items in the shareholder equity section of a company’s balance sheet. The AOCI account is the designated space for unrealized profits or losses on items that are placed in the other comprehensive income category.
On the regulatory call reports, AOCI is added to regulatory capital. Since SVB’s AOCI was negative (because of its unrealized losses on AFS securities) as of Dec. 31, it lowered the company’s total equity capital. So a fair way to gauge the negative AOCI to the bank’s total equity capital would be to divide the negative AOCI by total equity capital less AOCI — effectively adding the unrealized losses back to total equity capital for the calculation.
Getting back to our list of 10 banks that raised similar red margin flags to those of SVB, here’s the same group, in the same order, showing negative AOCI as a percentage of total equity capital as of Dec. 31. We have added SVB to the bottom of the list. The data was provided by FactSet:
Or this chart of vulnerable banks from Morningstar of unrealized losses and liquidity risk.
Here is a snapshot of SVB’s balance sheet. Or UNbalanced sheet.
After Congress passed the greatly flawed Dodd-Frank banking legislation, bailouts of banks are prohibited. But bank BAIL-INs still exist. Banks use money from their unsecured creditors, including depositors and bondholders, to restructure their capital to stay afloat. Put simply, they can convert their debt into equity to increase their capital requirements. Although depositors run the risk of losing some of their deposits, banks can only use deposits in excess of the $250,000 protection provided by the Federal Deposit Insurance Corporation (FDIC).
In any case, the FDIC and Fed are weighing a special vehicle after SVB swiftly collapses. Special vehicle? Sounds an awful like the mega bank bailout of 2008 under Hank Paulson.


You must be logged in to post a comment.