The Federal Reserve is retreating from its Covid-era monetary expansion. And with the retreat, US durable goods NEW ORDERS fell -4.5%% in January. The worst reading since … Covid in 2020.
A breakdown of new orders shows that while NONDEFENSE capital goods orders dropped -5.4% YoY in January, DEFENSE capital goods orders increased by 25.4% YoY.
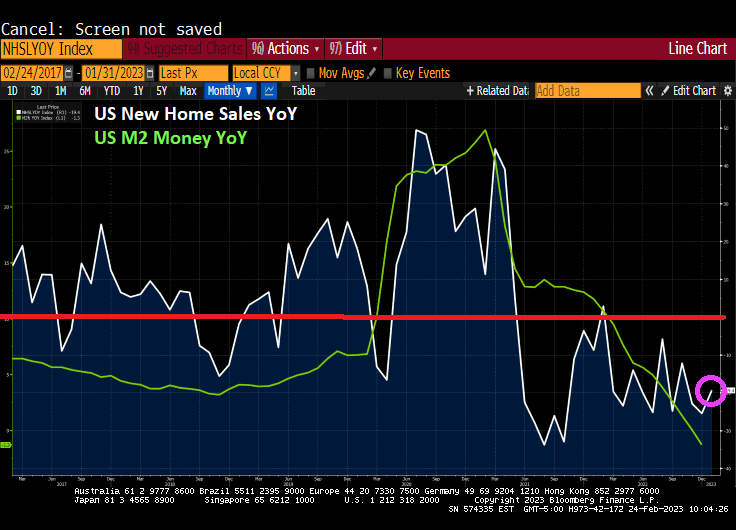
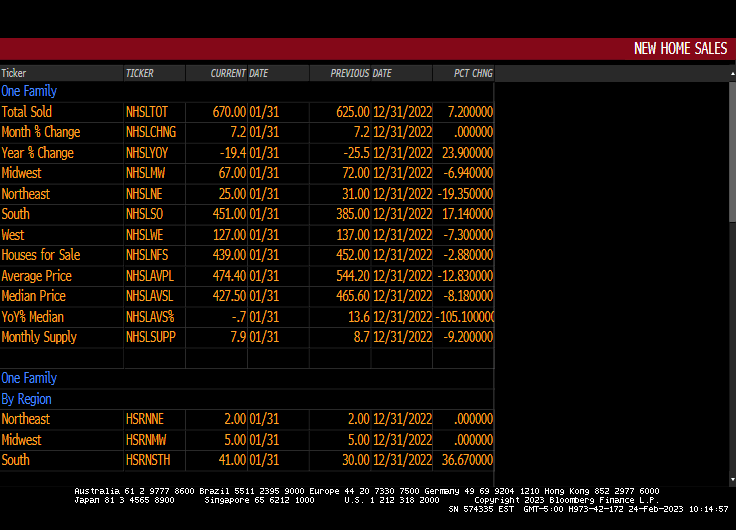
Another sign of a not healthy economy is housing. New Home Sales collapsed -19.4% from January 2022 (aka, year-over-year or YoY).
If I were Joe Biden, I would be touting the month-over-month numbers, up 7.20% from December to January. But the reality is that year-over-year new home sales are down -19.4%.
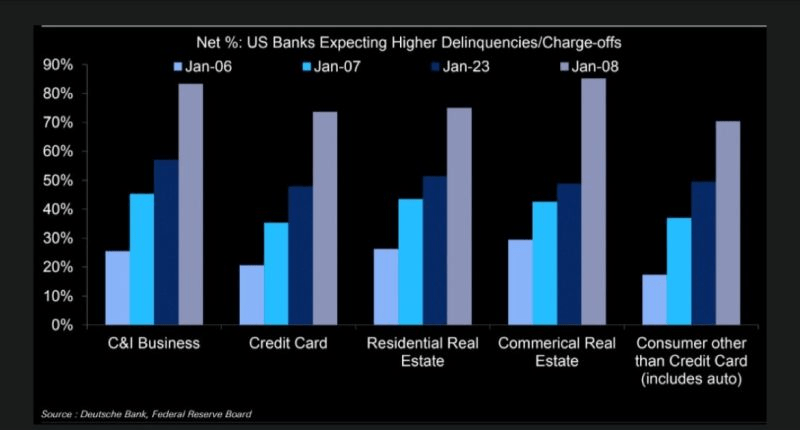
Also, on the “Alarm!” front, US banks are expecting higher delinquencies, including on residential mortgages.
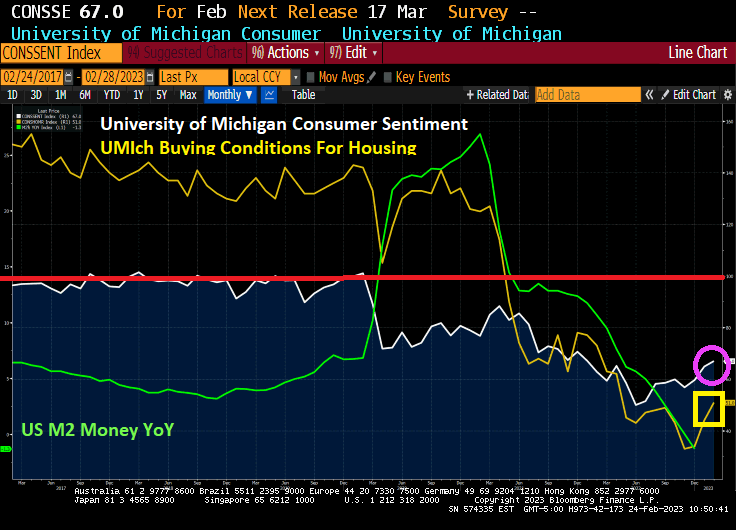
University of Michgan consumer sentiment for housing is rising, but still woefully below the 100 benchmark.
The US Federal government reminds me of the Peggy Lee song “Is That All There Is?” Since the outbreak of Covid in 2020 and the absurb spending spree by Pelosi and Schumer, the Federal government has increased their debt by 36% to help pay for the Federal spending spree. That amounts to $54.8 TRILLION in additional Federal debt since January 2020.
What did the US economy get for all that Federal spending? In Q4 2022, Real GDP rose by … 0.91% YoY. Seriously? Is that all there is from $54.8 TRILLION in additional Federal debt?
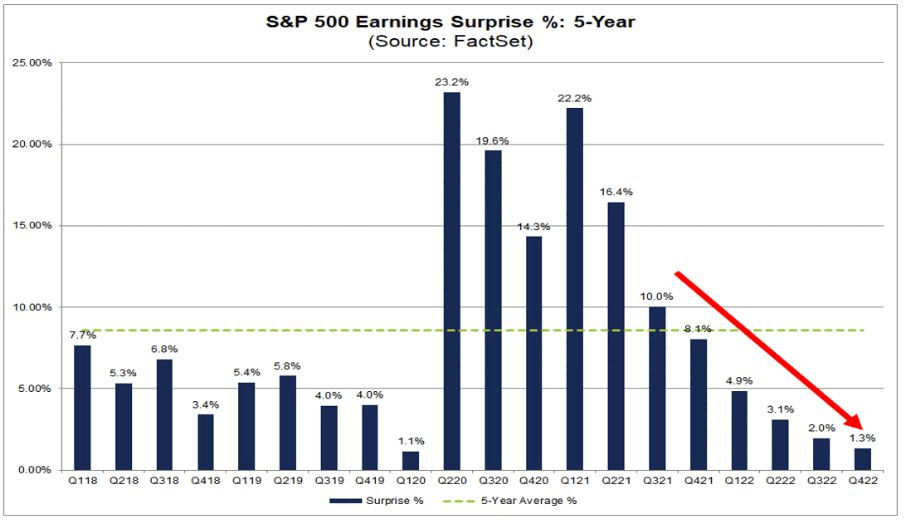
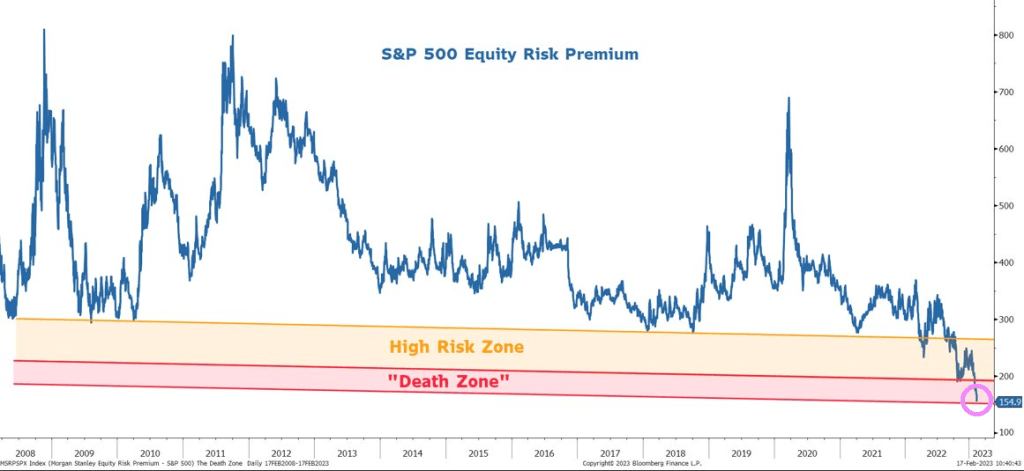
Another bit of lousy news. Look at the trend in S&P 500 Earnings Surprise (5 year).
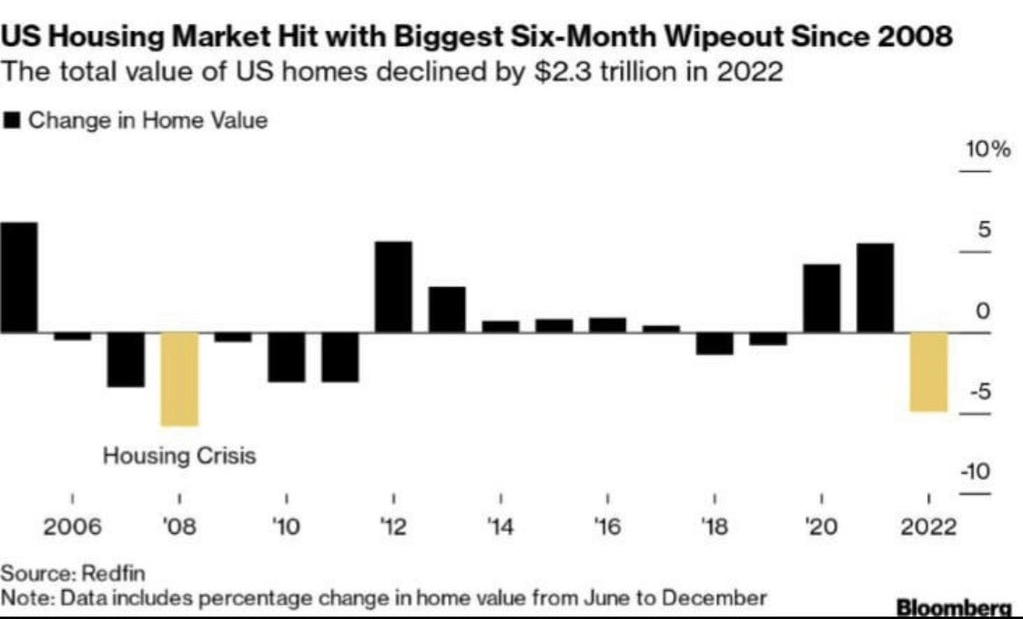
On the housing front, the US housing market was hit with the biggest six-month wipeout since 2008.
At least US Transportation Secretary “Pothole Pete” Buttigieg FINALLY showed up (three weeks after that East Palestine Ohio train disaster). Here is Buttigieg practising for his press conference.
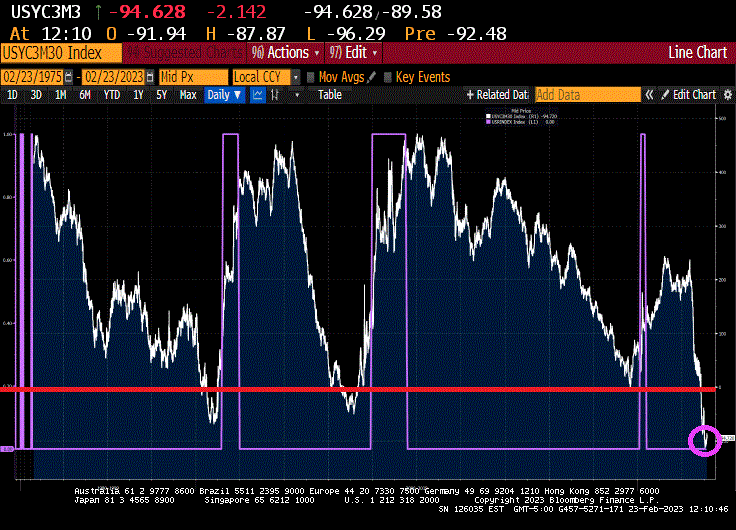
Bull steepenings in the yield curve are generally seen as a precursor to a recession, but they are often preceded by bear steepenings. The 3m30y curve is currently bear steepening, indicating a recession could begin as early as the summer. In fact, the 3m30y curve is now inverted at -94.628 basis points pointing to a recession in summer 2023.
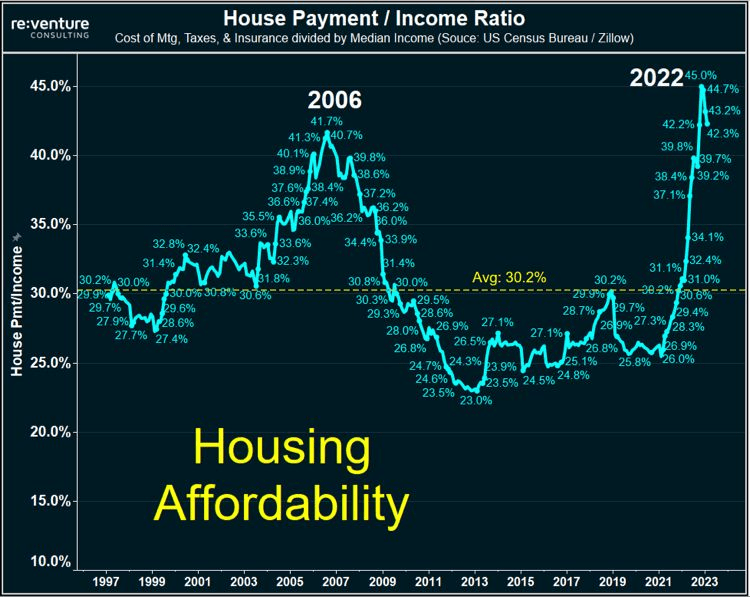
This is happening as the US house payment to income ratio near all-time highs.
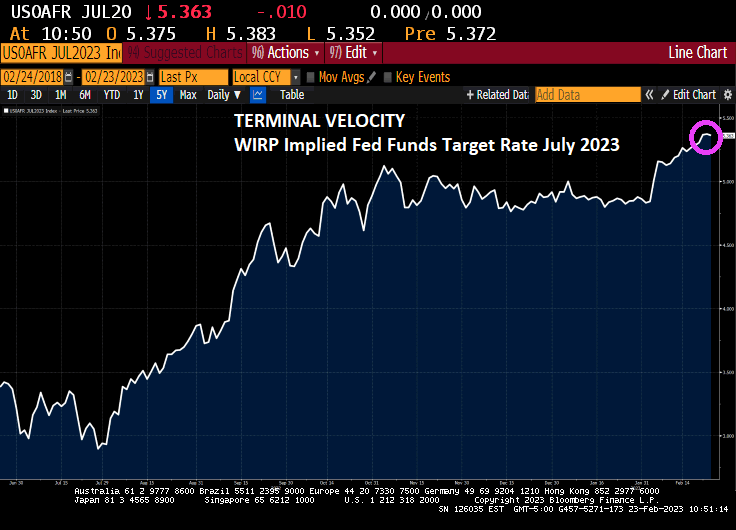
The terminal Fed Funds target rates is now 5.363% for the July FOMC (Fed Open Market Committee) meeting in 2023.
This comes as US Q4 GDP was revised lower on weaker consumer spending, revised downward to 1.4%
With the revision of Personal Consumption, real GDP was revised downward to 2.7% annualized QoQ.
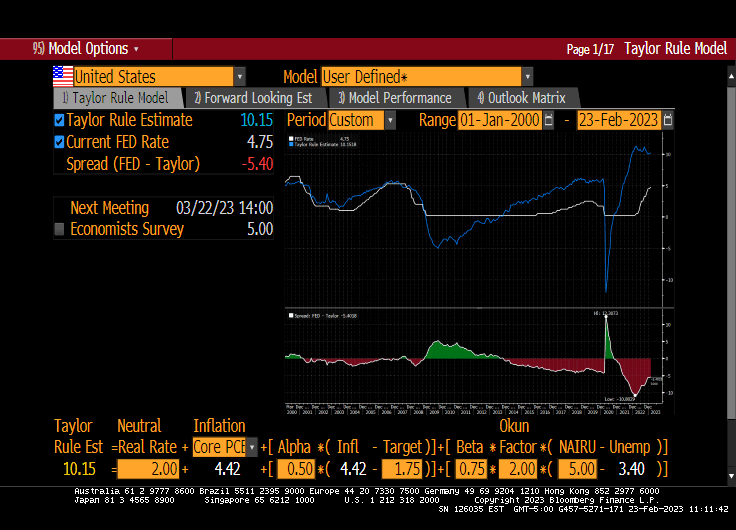
The Taylor Rule estimate for The Fed Funds Target rate is 10.15%. The Fed is only at 4.75%, so there is a long way to go! Except that The Fed doesn’t follow any useful rule like the Taylor Rule. Just the “seat of the pants” rule.
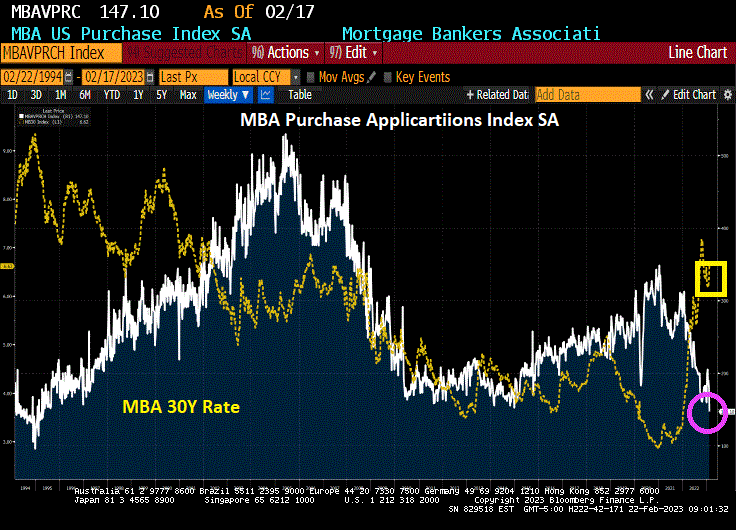
Mortgage rates increased across all loan types last week, with the 30-year fixed rate jumping 23 basis points to 6.62 percent – the highest rate since November 2022. The jump led to the purchase applications index decreasing 18 percent to its lowest level since 1995.
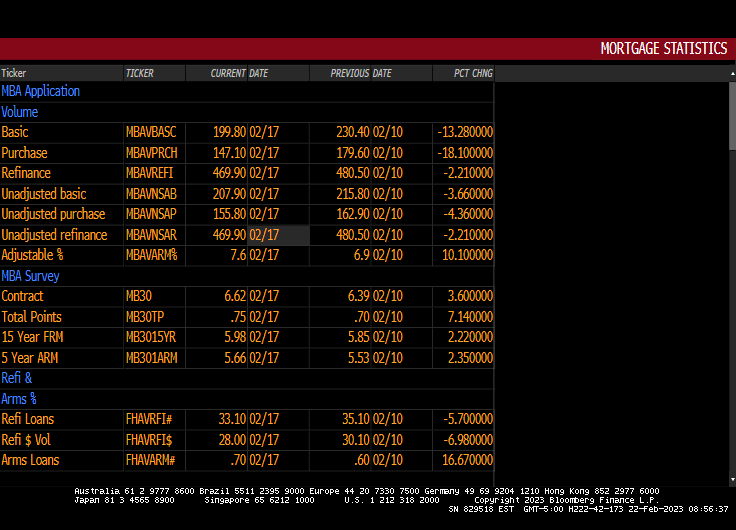
Mortgage applications decreased 13.3 percent from one week earlier, according to data from the Mortgage Bankers Association’s (MBA) Weekly Mortgage Applications Survey for the week ending February 17, 2023.
The Market Composite Index, a measure of mortgage loan application volume, decreased 13.3 percent on a seasonally adjusted basis from one week earlier. On an unadjusted basis, the Index decreased 4 percent compared with the previous week. The Refinance Index decreased 2 percent from the previous week and was 72 percent lower than the same week one year ago. The seasonally adjusted Purchase Index decreased 18 percent from one week earlier. The unadjusted Purchase Index decreased 4 percent compared with the previous week and was 41 percent lower than the same week one year ago.
Did Biden appoint “Pothole Pete” Buttigieg to oversee the mortgage market??
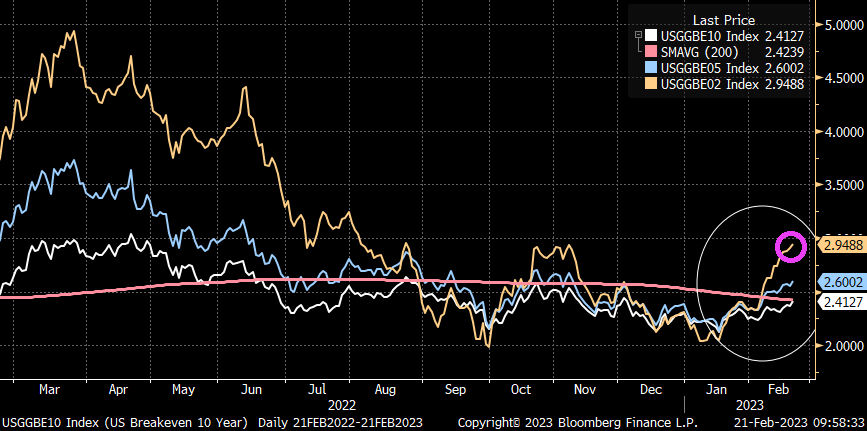
But before I go for experimental therapy for my brain tumor, I will leave you with this diddy. Inflation expectations are on the rise, not falling like Biden and Yellen keep screaming.
On the corporate side, US bankruptcies in 2023 had the worst start to a year since 2010 and the financial crisis.
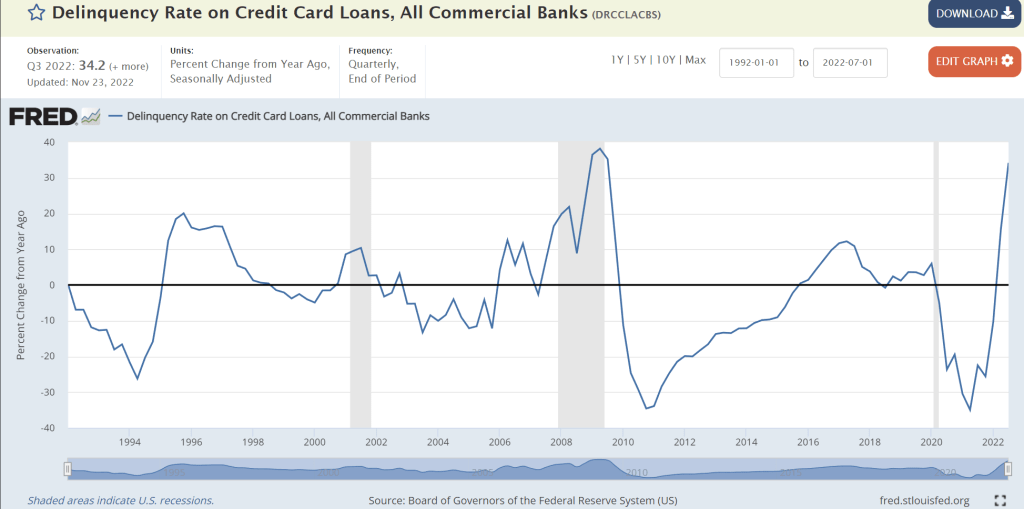
On the personal finance side of the ledger, the delinqueny rate on credit cards is growing at the faster rate since 2010.
Throw in 22 straight months of negative REAL wage growth, and have a scary situation facing middle America.
And the shate of outstanding subprime auto debt (30 days or more delinquent) is up to the highest rate since … well, you know when. The financial crisis of 2009-2010.
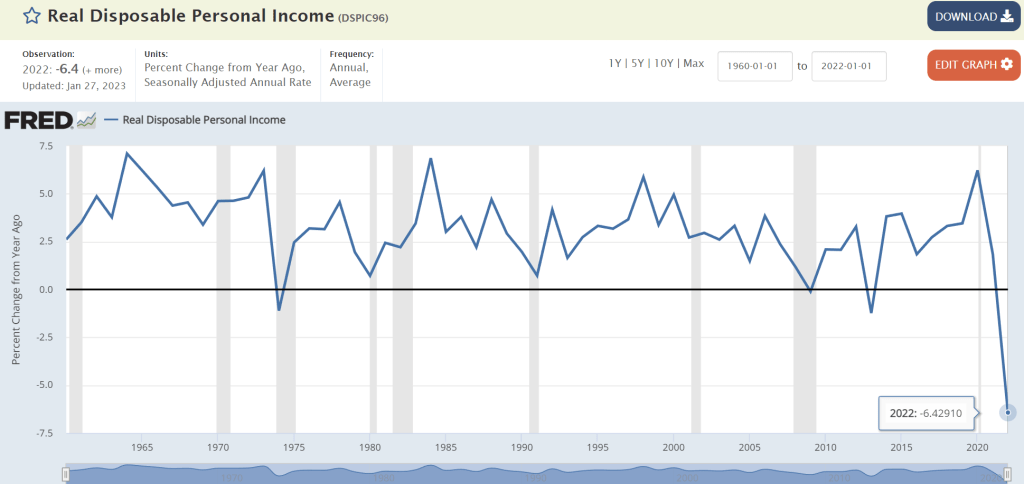
President Biden touts his economic plan as being a great success. But the data says otherwise. Real Disposable Personal Income, for examplge, was down -6.4% year-over-year (YoY) in 2022. That is the WORST reading since The Great Depression.
And to cope with inflation, Americans have expanded their credit useage, but credit card delinquencies are through the roof.
So much for “Middle Class Joe” and The Forgotten Man. Biden hasn’t forgotten, he just doesn’t care.


You must be logged in to post a comment.