Pension funds hold large positions in US Treasuries and Agency Mortgage-backed Securities (MBS). As does America’s central bank, The Federal Reserve. All are suffering losses as The Fed fights inflation.
(Bloomberg) — Week by week, the bond-market crash just keeps getting worse and there’s no clear end in sight.
With central banks worldwide aggressively ratcheting up interest rates in the face of stubbornly high inflation, prices (created by The Fed, Biden’s Green Energy Follicies and reckless Federal spending) are tumbling as traders race to catch up. And with that has come a grim parade of superlatives on how bad it has become.
On Friday, the UK’s five-year bonds tumbled by the most since at least 1992 after the government rolled out a massive tax-cut plan that may only strengthen the Bank of England’s hand. Two-year US Treasuries are in the middle of the the longest losing streak since at least 1976, dropping for 12 straight days. Worldwide, Bank of America Corp. strategists said government bond markets are on course for the worst year since 1949, when Europe was rebuilding from the ruins of World War Two.
The escalating losses reflect how far the Federal Reserve and other central banks have shifted away from the monetary policies of the pandemic, when they held rates near zero to keep their economies going. The reversal has exerted a major drag on everything from stock prices to oil as investors brace for an economic slowdown.
And as The Fed tries to combat stubborn inflation (caused by The Fed, Biden’s Green Energy folly and reckless Federal spending), you can see the US government security liquidity is worsening.
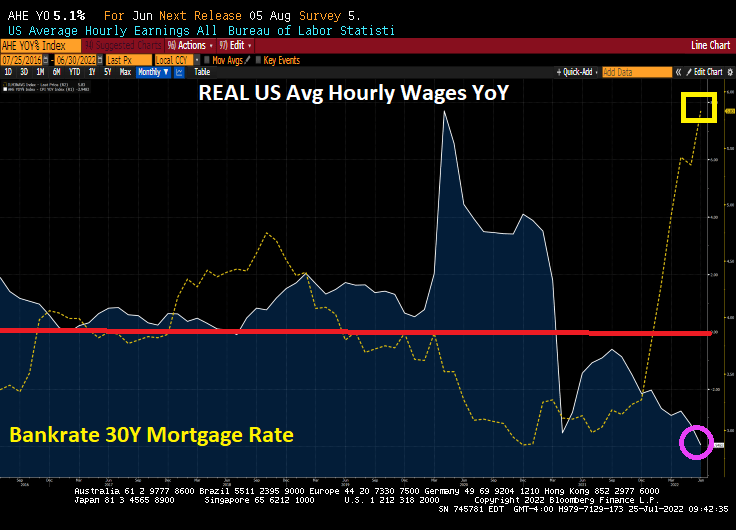
At least inflation has produced one “positive.” REAL mortgage rates are NEGATIVE since Freddie Mac’s 30-year mortgage rate less headline inflation is currently -2.975%.
Then we have Agency MBS (example, FNCL 3% MBS) plunging like a paralyzed falcon as duration risk increases with Fed rate tightening.
Fed Funds Futures data points to tightening until May ’23, then a reversal of rate hikes.
Biden’s green energy policies (limiting supply) caused a tremendous surge in energy prices and food prices (one has to pay to get food shipped!). But in order for The Fed to cool inflation, they are in the process of tightening their loose monetary policy since late 2008.
One of the consequences (intended or unintended) is that as mortgage rose, homebuyer mortgage payments rose 45.5% YoY.
Of course, Friday was one of those “Black Fridays” for investors. And pension funds.
The Dow Jone Industrial Average fell -1008.38 points after Powell’s “Mr T” remarks on pain. That was a whopping -3%. The NASDAQ composite index fell almost -4%.
Equity markets struggled in Europe as well, particularly the German DAX index.
The UMich Buying conditions for houses rose slightly, but remains near the lowest level since 1982.
Clubber Powell, Federal Reserve Chairman.
The Case-Shiller house price numbers are due out Tuesday for June and it is expected that they will show a significant slowing in home prices. Biden and Clubber Powell could then take “credit” for slowing “inflation.”
The National Association of Realtors’ Homebuyer Affordability Index for fixed-rate mortgages is now at the lowest reading since 2006 and the peak of the 2005-2007 housing bubble that burst catastrophically.
The reason? The Federal Reserve, in their attempt to put out the inflation fire (caused by 1) excessive monetary stimulus since late 2008, 2) rampant Federal spending and 3) Biden’s green energy policies, driving up prices.
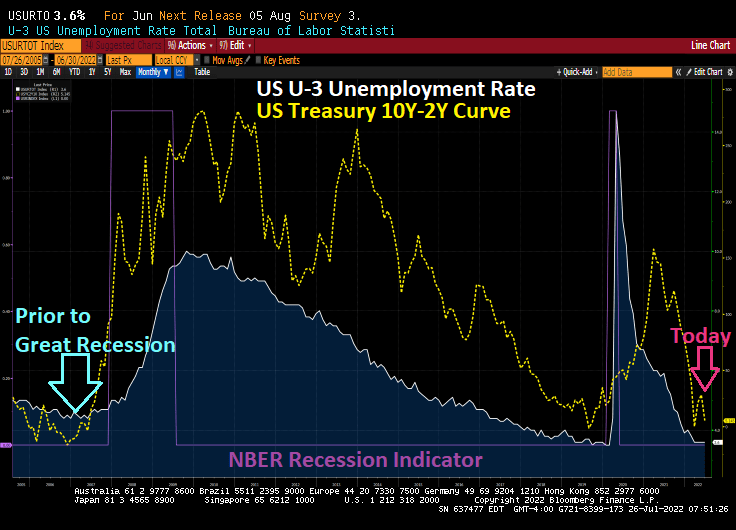
If we compare mortgage rates with the US Treasury 10Y-2Y yield curve, you can see that the yield curve remains inverted (historically a bad sign). This may signal an eventual loosening of monetary policy by March 2023.
The phrase “crossing the Rubicon” is an idiom that means that one is passing a point of no return. Its meaning comes from allusion to the crossing of the river Rubicon by Julius Caesar in early January 49 BC.
Indeed, the US crossed the FISCAL Rubicon in Q4 2012. That is when US Treasury Public Debt outstanding exceeded Real GDP. And the gap has been growing ever since.
In case you were wondering why M2 Money Velocity is so low, it is because the US is in constant crisis management mode as an excuse to spend trillions of dollars …. that generates progressively lower real GDP.
They built this nation on MMT (Modern Monetary Theory) which translates to the Federal government and Federal Reserve just wanting to spend trillions and trillions. Since 2005 (the peak of the housing bubble), the US Federal Reserve has increased the M2 Money stock more than real GDP growth in almost every quarter.
I remember when macroeconomists used to say “Everything is beautiful … as long as M2 Money growth is LESS than real GDP growth.” But we have apparently shifted to MMT when Everything is beautiful as long as there is a crisis and Congress can spend trillions.
Now Biden/Congress are spending billions in trying to reduce inflation (seriously, only in Washington DC would they think that massive spending bills would REDUCE inflation).
Dear Mr. Fantasy, play us a tune, something to make us all happy (like hitting 2% inflation WITHOUT crashing the economy). Do anything take us out of this gloom (caused by The Fed, Biden’s energy policies and Federal spending). Sing a song, play guitar, Make it snappy. Or in the case of housing, make it crappy.
(Bloomberg) — Federal Reserve Bank of Richmond President Thomas Barkin said the central bank was resolved to curb red-hot inflation, even if that meant risking a US economic recession.
“We’re committed to returning inflation to our 2% target and we’ll do what it takes to get there,” Barkin said Friday during an event in Ocean City, Maryland. He said that this could be achieved without a “tremendous decline in activity” but acknowledged that there were risks.
“There’s a path to getting inflation under control but a recession could happen in the process,” he said.
The US central bank hiked interest rates by 75 basis points in July for the second straight month as policy makers tackle inflation that’s running near 40-year highs. Fed officials speaking in recent days have said more rate increases are needed, but they are still deciding how big to move at their next policy meeting.
St. Louis Fed President James Bullard, one of the most hawkish policy makers, on Thursday urged another 75 basis-point move while Kansas City’s Esther George struck a more cautious tone.
Well, The Fed (aka, Der Kommissars) let the monetary stimulus blow out of control since 2000.
With the 2001 recession, The Fed crashed the target rate (white line) causing home price growth (blue line) to soar. Then The Fed decided that the economy was overheated and cranked up their target rate. This sudden rise in The Fed’s target rate helped to slow/crash housing prices. Resulting in … a frantic decrease in the target rate (late 2007- late 2008) and the adoption of asset purchases of Treasury Notes/Bonds and Agency Mortgage-backed Securities in late 2008.
The Bernanke/Yellen “loose as a goose” policies from late 2008 to Feb 2018 created a total mess. Bernanke/Yellen raised the target rate only one before Trump was elected President, and 8 times AFTER Trump was elected. And Yellen’s Fed began to let the balance sheet shrink a bit before Covid struck in early 2020. And with Covid came another massive expansion of The Fed’s Balance Sheet WHICH HAS NOT YET BEEN WITHDRAWN (despite Fed talking heads saying it would be reduced).
Here we sit with The Fed NOW trying to extinguish inflation (yellow line) by raising their target rate (white line) but NOT shrinking the balance sheet (orange line).
Wonder why this is a horrible homeless problem in the US, particularly in California? While Stanford University has an excellent study of the causes of California’s homeless problem, there is another cause of homelessness … The Federal Reserve’s insane monetary policies since late 2008. The Case-Shiller National Home Price Index is 65% higher in May than during the calamitous home price bubble of 2005-2007, helping to exacerbate the homeless problem.
One of the many problems created by the reckless Bernanke/Yellen/Powell monetary policies is the M2 Money Velocity is near an all-time low making a return to “easy money policies” far more difficult.
I won’t post any photos of the homeless encampments in Los Angeles since it is very sad. But here is a photo of the Dunder-Mifflin paper company “office” on Saticoy Street. The point is that thanks to The Federal Reserve’s loose monetary policies, housing is unaffordable for millions of households forcing many to live on the streets.
Figure 2: Median Rent for a Two-Bedroom Apartment, California, 2022
And a point of trivia. The Office’s Charles Miner (played by the GREAT Idris Elba) was allegedly hired from Saticoy Steel. The Dunder-Mifflin paper company site was on Saticoy Street in sunny LA, not Scranton PA.
Good luck to The Federal Reserve in combating inflation without causing a recession.
The US Empire State Manufacturing Survey General Business Conditions, that is. It just crashed and burned (-31.3) in August, the lowest reading since The Great Covid Shutdown and before that The Great Recession.
The inverted US Treasury yield curve (10Y-2Y) is beginning to make sense.
The 2020 Covid outbreak led to a massive (and generally awful) reaction. There were economic shutdowns that caused extensive damage (particularly to small firms), but it was the massive overreaction by The Federal government in terms of Covid relief and The Federal Reserve’s expansion of the money supply that caused considerable damage.
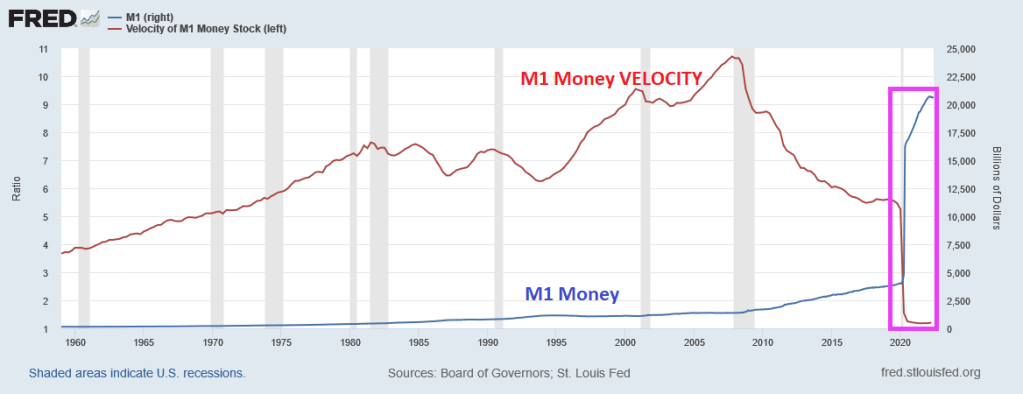
One truly horrific chart is that of M1 Money and M1 Money Velocity (M1/GDP). M1 Money surged with Covid driving M1 Money Velocity down to levels never seem before.
The broader measure of money, M2, isn’t as dramatic, but we also see that M2 Money VELOCITY has plunged to levels never seen before.
What does low money velocity indicate? Simply put, The Fed is printing trillions of dollars, but GDP isn’t moving much. But that won’t stop Congress from spending (and using The Fed to buy its debt).
So, here we sit. This morning, the US Treasury yield curve (10Y-2Y) remains inverted. This AM, the curve inverted another -.591 basis points to -42.725, a sign of impending recession.
Yes, we are living through Jay Powell’s famous chili episode where money velocity is near historic lows and we have an inverted yield curve.
BTW, congratulations to Will Zalatoris (aka, Happy Gilmore’s caddy) for his first PGA Tour victory at the FedEx St. Jude Championship!
Just remember, the US economy had strong employment figures just prior to the 2008 Great Recession and financial crisis, so US Treasury Secretary Yellen, Biden’s economic cheerleader Bernstein and Obama’s economic cheerleader Sperling are all relying on a bad indicator of economic health to justify that the US economy is in great shape.
(Bloomberg) — Treasury Secretary Janet Yellen expressed confidence in the Federal Reserve’s fight against inflation and said she doesn’t see any sign that the US economy is in a broad recession.
“We’re likely to see some slowing of job creation,” Yellen said on NBC’s “Meet the Press” on Sunday. “I don’t think that that’s a recession. A recession is broad-based weakness in the economy. We’re not seeing that now.”
With US consumer prices rising at the fastest rate in four decades, a growing number of analysts say it will take a recession and higher joblessness to ease price pressures significantly. The Federal Reserve raised rates in June by the most since 1994 and is expected to approve another 75 basis-point hike this week.
Inflation is “way too high,” Yellen said, while renewing the Biden administration’s argument that it’s also high in many other advanced economies.
“The Fed is charged with putting in place policies that will bring inflation down,” said Yellen, a former Fed chair. “And I expect them to be successful.”
Dammit, Janet. All of Biden’s anti-fossil fuel orders are still in place and Biden/Pelosi/Schumer are still trying to pass the highly-inflationary Build Back (Inflation) Better bill. And The Fed still has not shrunk it massive balance sheet yet.
But Janet, the US Treasury 10Y-2Y yield curve remains inverted (historically ahead of a recession) while the Atlanta Fed GDPNow Q2 tracker is at -1.6% which would make the second quarter in a row of negative real GDP growth in a row (historically a definition of recession).
My preferred 10Y-2Y chart shows the yield curve more inverted than even prior to The Great Recession!
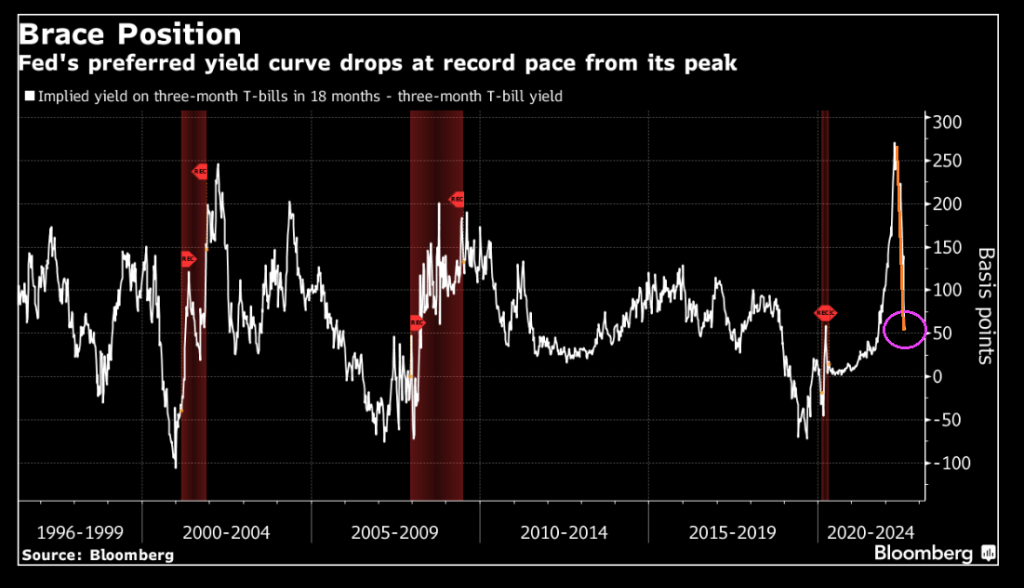
But in Yellen’s defense, The Fed’s preferred yield curve (implied yield on 3-month T-Bills in 18 month – 3 month T-Bill yield) is still positive, though crashing like a paralyzed falcon.
So, the Biden administration is sticking to the strong labor market story. But what the Biden Administration (and Yellen) fail to acknowledge is 1) unemployment is a lagged indicator of a recession (unemployment was low prior to the 2008 GREAT recession, then exploded and 2) there is still a tremendous amount of monetary stimulus outstanding that The Fed has taken away … yet.
Essentially, the Biden Administration is panicking over the coming mid-year election and will say anything at this point to stay in power. So, I would probably ignore anything said by Biden, Yellen and their talking heads before the midterms elections. But when Biden’s economic advisor says that the US economy is strong, I want to ask him how having NEGATIVE wage growth is a good thing,
Let’s see if Yellen is correct and The Fed’s Fireball will tame inflation. Frankly, I think the global slowdown is the only thing that will tame inflation.


You must be logged in to post a comment.