Eyes Wide Shut? Sam Bankman-Fried And The Absence Of Risk Management (The Collapse Of Cryptos As The Fed Tightens Fighting Bidenflation)

One of the great ironies of the Sam Bankman-Fried debacle is that while SBF was a generous donor to Democrats (and a few RINOs) and President Biden, it was Biden’s green energy policies that were part of the nail in SBF’s crypto empire. As inflation exploded upon Biden taking office (and massive overspending by Congress), The Federal Reserve jumped in to cool inflation leading to the downfall of cryptos in terms of price.

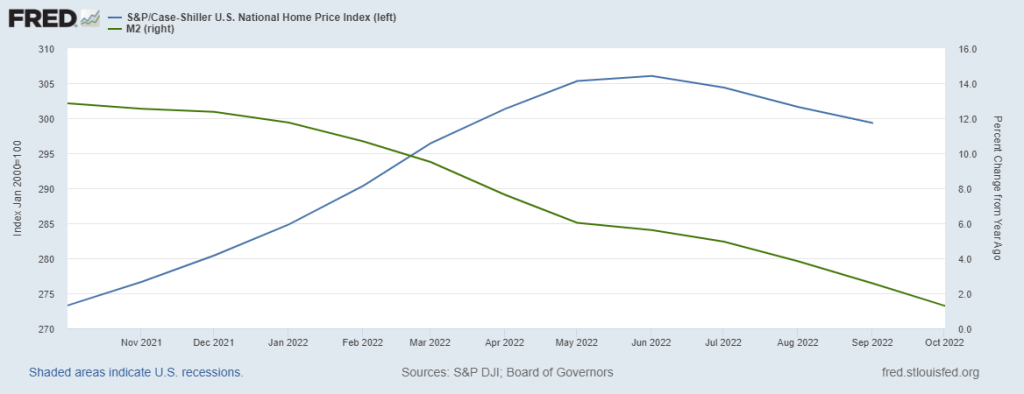
M2 Money YoY (green line) shows the massive growth money with the Covid economic shutdowns in 2020. Cryptos skyrocketed after that much money was printed by The Fed. Cryptos fell shortly after peaking in April/May 2021, then peaked again in a horrific display of asset volatility in October/November 2021.

What happened in late 2021 to crush cryptos? Ah, expectations of Fed rate increases (red line) started to soar meaning the punchbowl for cryptos was being taken away. The Fed giveth and The Fed taketh away.

The risk management question is … how did SBF and Alameda Research’s Caroline Ellison didn’t notice the relationshop between crypto prices and changing Federal Reserve monetary policy? Even worse, why didn’t investors ask questions??

Take a gander at Bitcoin relative to US diesel fuel prices (orange line) and The Fed’s inflation counterattack (red line). Sam and Sweet Caroline (who was seen walking free in NYC) must not have been monitoring how rapidly rising diesel prices would permeate the entire economy in terms of price increases. M2 Money YoY (green line) has been declining as the expectations of Fed rate tightening (red line) has increased.

SBF donated a huge amount to the midterm elections, the party that went along with Biden’s war on fossil fuels. Then inflation ensued as energy and food prices skyrocketed, leading The Federal Reserve to fight inflation by removing the monetary punchbowl. So, in a sense, SBF donations led to his own collapse.

Apparently, SBF, Caroline Ellison and the other FTXers were engaged in orgies and not paying attention to the impact of inflation and Fed policies on cryptos.

Lastly, how did Gary Genslar and the SEC not see any of this? In the same way that Fed Chair Ben Bernanke didn’t see the financial crisis as it was rapidly unfolding: eyes wide shut.

I read that Nicole Kidman underwent psychiatric treatment after filming “Eyes Wide Shut.” I saw it and was bored out of my mind.

US Real GDP Growth Forecast To Be Dismal 0.50% In 2023, Personal Savings Rate -67.9% YoY In October, US Mortgage Rates Headed Down (Economic Lights On But Nobody’s Home)

Albert Collins said it best about the US economy under Joe Biden: “Lights Are On But Nobody’s Home”.

The Federal Reserve forecast for the US economy is a dismal 0.50% YoY. Do I detect a trend?

The FOMC forecast for 2023 and 2024. Core PCE YoY (inflation) is forecast to drop to 3.50%, still considerably higher than The Fed’s target rate of inflation of 2%. And unemployment is forecast to be 4.60%.

To cope with Bidenflation, US personal savings rate as of October is -67.9% YoY. The “good” news is that rents YoY are crashing. But food prices under Inflation Joe remain very high. But most everything is slowing down, not due to Biden’s policies, but a global and US economic slowdown.

With a big slowdown coming our way, you can understand why The Fed’s December Dot Plot is showing declining Fed Funds Target rate starts declining in 2024.

Even US mortgage rates are headed down.

Speaking of going down, cryptos are down across the board with Cardano leading the decline at -6.91%.

All aboard the SS Biden!

The Amazing, Disappearing Jumbo/Conforming Mortgage Spread Since Covid And Fed Intervention (Jumbo Spread At 1.67 Basis Points After Covid Fed Reaction)

Years ago, Brent Ambrose, Michael Lacour-Little and I wrote a paper on the US 30-year jumbo mortgage spread over conforming 30-year mortgage rates entitled “The effect of conforming loan status on mortgage yield spreads: a loan level analysis.” But that paper was written before Covid and the dramatic distortion caused in mortgage markets by The Federal Reserve’s massive increase in money.

Here is the spread between Bankrate’s 30-year mortgage rate and their 30-year JUMBO mortgage. Notice that between 2007 and early 2020, the median “jumbo spread” was 49 basis points. But after Covid and The Fed’s counterattack (by printing M2 Money), the median Jumbo spread from 4/1/2020 to today is only 1 basis point.

In the following chart, you can see the jumbo mortgage rate (yellow) against the conforming mortgage rate (white) and there is almost always a spread between the two UNTIL 2020 where we saw M2 Money growth (green line) spike and The Fed increased their purchases of Agency MBS (purple line). Since Covid and The Fed’s massive reaction, the jumbo rate and conforming rate are virtually the same. In fact, the latest jumbo spread is 1 basis point over the conforming rate.

Why is this happening? One explanation is that demand from the investors who ultimately buy jumbo mortgages. The strong demand by investors appears to have driven down the yields on jumbos relative to conventional loans, especially as the use and accessibility to jumbos has grown.

A second explanation is that Loan Level Price Adjustments that were added to conforming loans post-financial crisis never went away (until just recently on selected loans). This makes jumbos and conforming loans very close in yield.

So, when will the mortgage market return to normal and jumbo mortgages go back to the normal 50 basis point spread? We may see normalization if The Fed speeds up its withdrawal from markets. Also, getting rid of Loan Level Price Adjustments would help normalized the mortgage market.

But things are getting stressed in jumboland (California) where home prices are crashing in 5 of the top 8 metro areas.

Harry Houdini couldn’t have created a more tantalizing mystery … and one I wish would go away.

Not Always Sunny! Philadelphia Fed Admits US Jobs “Overstated” By At Least 1.1 Million From March To June 2022 (Will Biden Retract “Greatest Economy In History Statement?)

Its NOT always sunny in Philadelphia. Here is a video of the Philly Fed economists explaining massively overstated job numbers to Fed Chair Jerome Powell.

The Federal Reserve Bank of Philadelphia estimates that the employment data was vastly overstated in 2022. 10k jobs added instead of 1.1 million reported from March to June of 2022.

Here is a chart (courtesy of Zero Hedge) showing reported payrolls and REVISED payrolls. Somehow, I don’t think Jean Pierre (Biden’s spokesperson, not the French chef) will be touting “Unlike Trump, our administration barely added any jobs in March, April, May and June 2022.

How will this revelation influence the Fed’s open market committee (FOMC) going forward knowing that the Biden Administrations job creation claims are wildly overstated?

Perhaps it doesn’t matter since Bernanke, Yellen and Powell don’t follow any rules (like the Taylor Rule), but generally with job creation almost nonexistant in March through June of 2022, The Fed should be cutting rates like mad. But wait! Can they with significant inflation?

The good news is that inflation is coming off its peak, but will take a while to get to The Fed’s 2% target. Hence The Fed may raise their target rate since they cannot achieve it will energy price up substantially since Biden became President.

California Screamin’! 2022 Home Prices Crashed Mostly In California As Fed Withdraws Monetary Stimulus (Austin TX And Seattle WA Also Crashed Hard)

California Screamin’!

6 of the top 8 metro areas with the largest home price crash in 2022 were in California, according to Redfin.

Sadly, I lived in three of these metro areas (Austin TX, San Jose CA and Phoenix AZ), although I wouldn’t confuse correlation with causation.

The trend for home price growth (blue line) is definitely on the downturn as The Fed removes its ample stimulus (green line).

Here is California governor Gavin (Nancy Pelosi’s nephew) Newsome screaming about crashing California home prices.

The Empire Strikes Out! NY Manufacturing Outlook Shrivels To -11.2% And Its NOT Always Sunny In Philadelphia Fed Outlook At -13.8% (S&P 500 Index Drops -1.87%, EuroStox Drops -3.42%)

The numbers coming out today are not good. November numbers were 1) US Industrial Production was down -0.2% MoM, 2) manufacturing production is down -0.6%, 3) retail sales advanced down -0.6% (most in 11 months) and …

The Empire State Manufacturing outlook was down -11.2% and the Philadelphia Fed (or Phed) business outlook was down -13.8% in November.

And with all this bad news, global equity markets are dropping like a paralyzed falcon.

But at least Biden traded a dangerous international arms dealer for WBNA star Brittney Griner. Possilby the worst trade in history after the Chicago Cubs traded future Hall of Famer Lou Brock for sore-arm pitcher Ernie Broglio. Griner is Ernie Broglio.

Gone In 60 Seconds? Treasuries And Stock Futures Trading Spike 60 Seconds BEFORE CPI Data Release (Who Tipped The Wink?)

Apparently, despite the denials from the Biden Administration, someone at Bureau of Labor Statistics or someone in Congress or the Federal Reserve or the Biden Admininstration itself likely tipped the wink on the soft CPI report on Tuesday.

Treasuries were well on the front-foot in the lead up to the below-estimate November CPO print, as a surge of buying took place seconds before the official 8:30 am New York release time. Over a 60 second period before the data, 13,518 March 10-year futures traded as the contract moved from 114-04+ up to 114-22. Gains were then extended up to 115-11 session highs once the data was released.

On the equity side, stock futures suddenly spiked more than 1%. Trading in Treasury futures surged, pushing benchmark yields lower by about 4 basis points. Those are major moves in such a short period of time — bigger than full-session swings on some days. And they should get scrutinized by regulators, long-time market observers say, even if a leak is only one of several possible explanations for why traders suddenly started buying right before the report was published. 

Remember that current Treasury Secretary Janet Yellen was accused of leaking information to a NY hedge fund ahead of the Fed Open Market Committee meeting? And then we have the Wolf of Wall Street.

I wonder if the REAL Wolf of Wall Street did this?

MBA Mortgage Applications Rise 3.2% From Previous Week, But Purchase Applications Down 38% From Same Week Last Year As Fed Tightens

Mortgage applications increased 3.2 percent from one week earlier, according to data from the Mortgage Bankers Association’s (MBA) Weekly Mortgage Applications Survey for the week ending December 9, 2022.

The Refinance Index increased 3 percent from the previous week and was 85 percent lower than the same week one year ago. The unadjusted Purchase Index decreased 1 percent compared with the previous week and was 38 percent lower than the same week one year ago.

You can see the impact of seasonalilty on mortgage purchase applications (white line). They peaked in the week of May 6, 2022 and have been generally declining since. While refi applications (orange line) increased over the past week, they have been pummelled by The Fed tightening.

It is quiet today as investors wait for The Fed to announce a 50 basis point rate increase. Fed Funds Futures point to almost another 100 basis point hike by May 5, 2023, then a slow decline in The Fed Funds target rate (upper bound).

And here is Sam Bankman-Fried and his high-powered legal defense.

The Fed Needs To Take A Look At Itself: WSJ Editorial By Levy And Plosser (Taylor Rule Implied Target Rate Of 12.07%, Current Rate At 4%)

Paul Revere and the Raiders said it best about The Federal Reserve. Take a look at yourself.

Mickey Levy of Berenberg Capital and Charles Plosser wrote a great op-ed in the Wall Street Journal entitled “The Federal Reserve Needs a Hard Look in the Mirror.” Here is a Fed Reserve St Louis paper by Levy and Plosser entitled “The Murky Future of Monetary Policy.”

Abstract

In August 2020, the Federal Reserve unveiled its new strategic framework. One major objective of the Fed was to address its concerns over the potential consequences for the conduct of monetary policy when the policy rate was constrained by its effective lower bound. This article concludes that there are significant flaws in the new strategy and that it encourages a more discretionary approach to monetary policy and increases the risks of policy errors. The new framework is an overly complex and asymmetric flexible average inflation targeting scheme that introduces a significant inflationary bias into policy and expands the scope for discretion by broadening the Fed’s employment mandate to “maximum inclusive employment.” In a postscript, the article describes how quickly the flaws have been revealed and urges a reset toward a more systematic and coherent strategy that is transparent and broadly understood by the public.

I attended a speech by macoeconomist Gershon Mandelker at the National Association of Realtors where he called on the Federal Reserve to follow some observable rule rather than the complex (or seat of the pants) approach to monetary policy.

With today’s inflation report (core inflation YoY of 6%) results in a Taylor Rule estimate of The Fed Funds Target Rate of 12.07%. We are struggling to reach 5% as a “terminal” Fed target rate (currently at 4% and likely to rise 50 basis points at tomorrow’s Fed meeting).

The matrix of CPI and unemployment under the Taylor Rule shows that The Fed’s target rate isn’t at even 5% for any relevant combination of core CPI (inflation) and unemployment rate.

Note that since the financial crisis the Fed’s target rate (white line) has been consistely below the Taylor Rule implied rate (blue dashed line).

Here is Treasury Secretary and former Fed Chair Janet Yellen laughing at those who want some kind of observable Fed rule.

Pre-Fed Status: 100% Probability Of US Recession In 2023, Mortgage Rate Steady (US Yield Curve Now Inverted For 116 Straight Days, Implied Rate Hike Of +50 BPS To 4.50%)

Fun week ahead. US inflation numbers are out on Tuesday (forecast? CPI YoY = 7.3%, Core CPI YoY = 6.1%) and The Federal Reserve’s Open Market Committee (FOMC) rate decision is on Wendesday.

So, where are we sitting on Monday?

First, the US Treasury 10Y-2Y yield curve has been inverted (a precursor to recession) for 116 straight days). Second, the likelihood of recession in 2023 is 100%. Third, with the forecast of core inflation at a still numbing 6.1%, The Fed seems dead set on raising their target rate by 50 basis points to 4.50% on Wednesday.

dddd

So, as The Fed debates recession versus fighting inflation (partly caused by The Fed), we have Kevin Malone from The Office debating Angela versus double-fudge brownies:

“I hear Angela’s party will have double fudge brownies. But it will also have Angela. Double fudge.. Angela.. double fudge….. Angela. Hmm..” I am betting on risking a recession by raising the Fed’s target rate by 50 basis points.