Joe Biden is the king of malaprops. But his press secretary is just as bad as her boss. Recently, she said that under Biden, there were 10,000 million jobs created. Better known as 10 BILLION jobs created. Not bad, considering that the total population of the US is 333 million. THAT is a hot labor market! /sarc
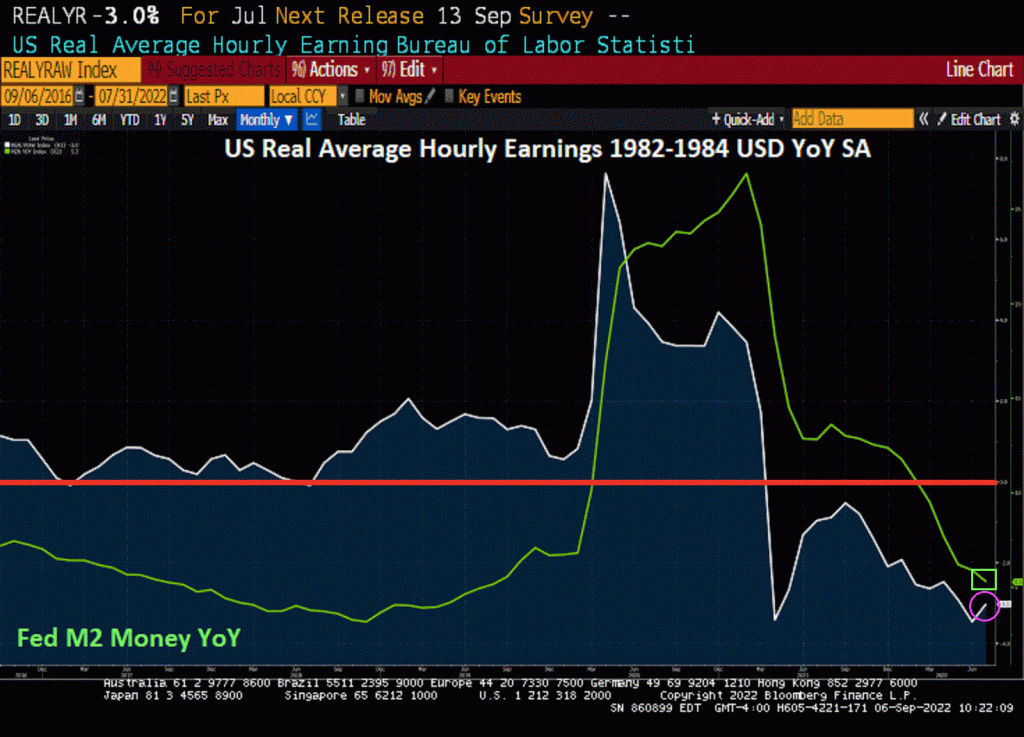
But seriously, the US U-3 unemployment rate is 3.7% in August, the lowest since Donald Trump was President and BEFORE the Covid outbreak. The Covid economic shutdown saw a surge in the unemployment rate to 14.7% in April 2020 that begat a huge spike in M2 Money growth (22% YoY in May 2022 (green line). Only now is M2 Money growth returning to Trump-era growth rates.
But as The Federal Reserve removes its hefty monetary stimulus, it is unlikely that the unemployment rate will remain low.
In defense of Biden’s press secretary, the US economy saw 10.247 million jobs added under Biden (although while technically correct, even MSNBC wouldn’t give Biden credit for job creation in his first several months as President. Check that. They probably would.
April 2020 saw a decline in US jobs of -20.493 million jobs thanks to the Covid economic shutdowns. BUT with the M2 Money surge, we saw +12.1 million jobs added between May and November 2020 under Trump. Then the US elected China Joe (or Beijing Biden) as President.
The economic shutdowns due to Covid were an economic disaster for millions. But the surge in M2 Money (supporting the various Federal spending programs and inflation) explains the surge in jobs added, not economic wizardry of Biden.
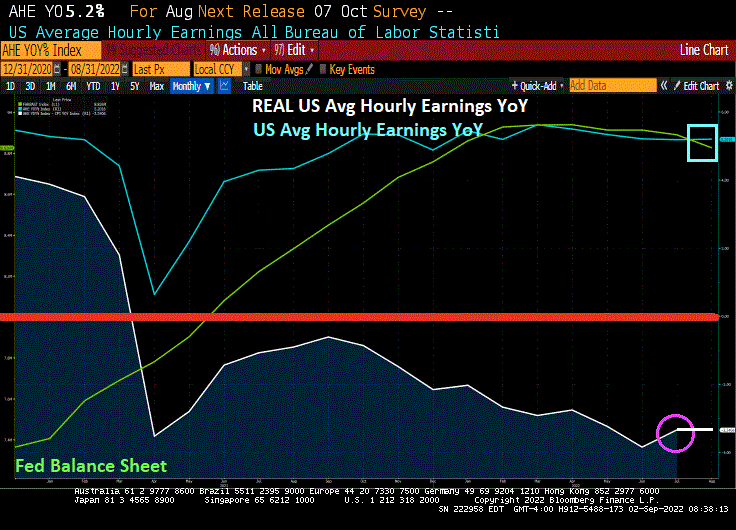
For some reason, Biden and his press secretary failed to mention that inflation is so bad that REAL average hourly earnings YoY are declining at a 3% pace.
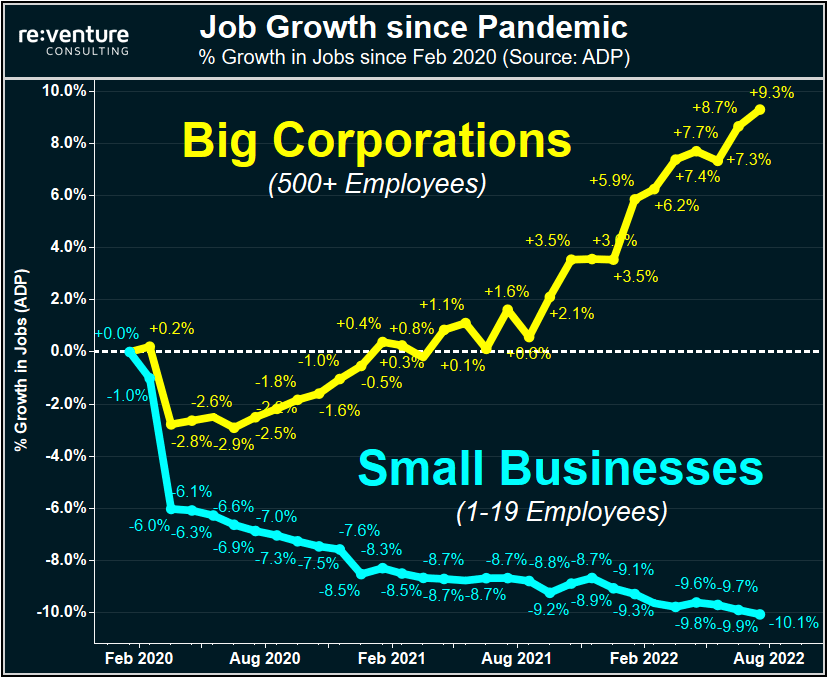
And not surprisingly, job growth has accrued to big corporations and not small businesses.
(Bloomberg)Investors who might be looking for the world’s biggest bond market to rally back soon from its worst losses in decades appear doomed to disappointment.
The US employment report on Friday illustrated the momentum of the economy in face of the Federal Reserve’s escalating effort to cool it down, with businesses rapidly adding jobs, pay rising and more Americans entering the workforce. While Treasury yields slipped as the figures showed a slight easing of wage pressures and an uptick in the jobless rate, the overall picture reinforced speculation the Fed is poised to keep raising interest rates — and hold them there — until the inflation surge recedes.
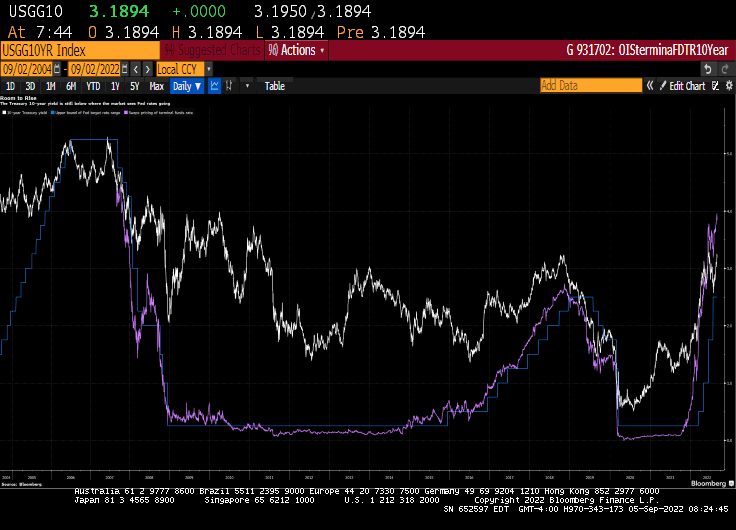
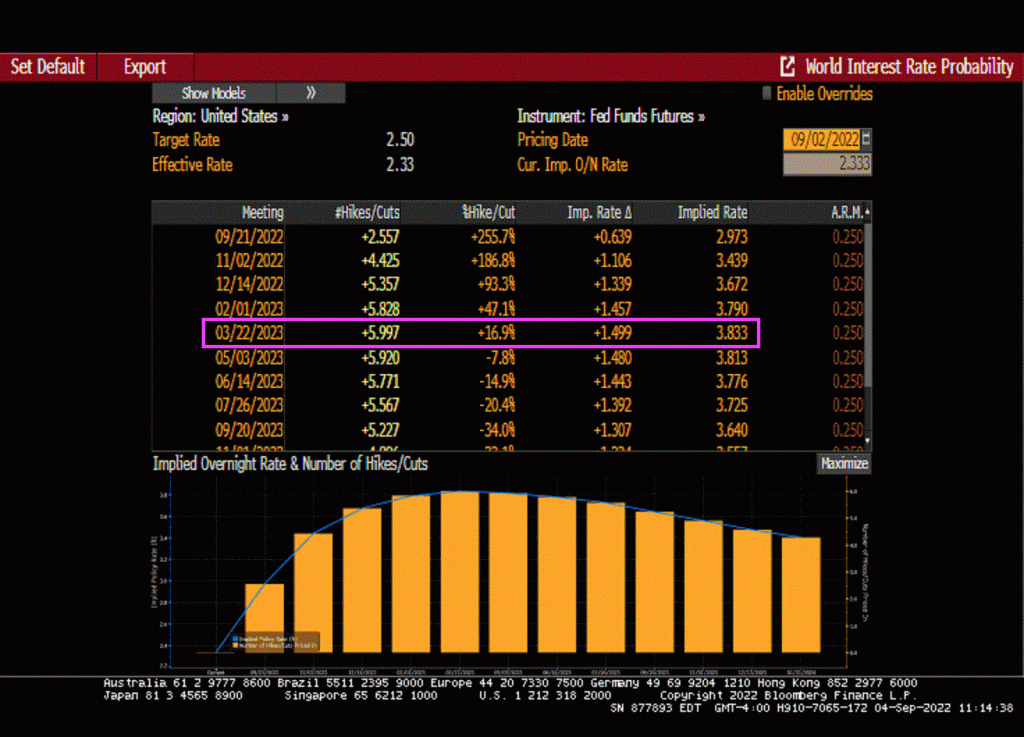
Swaps traders are pricing in a slightly better-than-even chance that the central bank will continue lifting its benchmark rate by three-quarters of a percentage point on Sept. 21 and tighten policy until it hits about 3.8%. That suggests more downside potential for bond prices because the 10-year Treasury yield has topped out at or above the Fed’s peak rate during previous monetary-policy tightening cycles. That yield is at about 3.19% now.
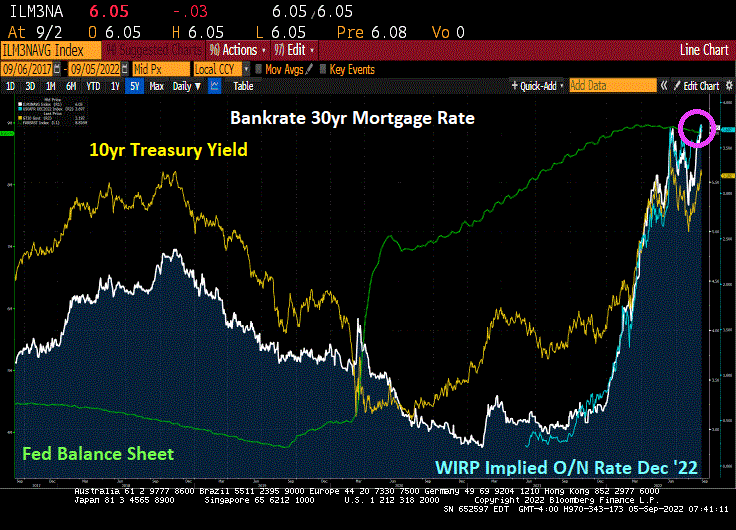
Then we have Bankrate’s 30-year mortgage rate soaring on Fed intervention expectations.
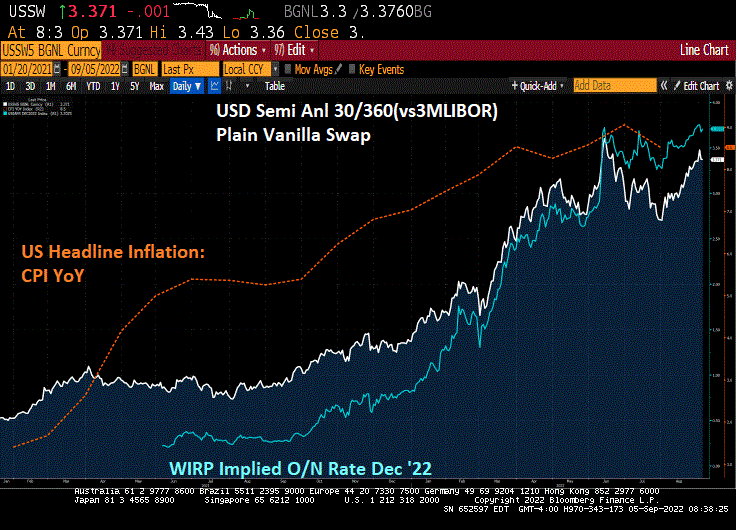
Inflation? US inflation is near its highest in 40 years and the USDollar Plain Vanilla Swap was at 0.50 when Biden first took office as President and is now 3.371 (quite an increase!).
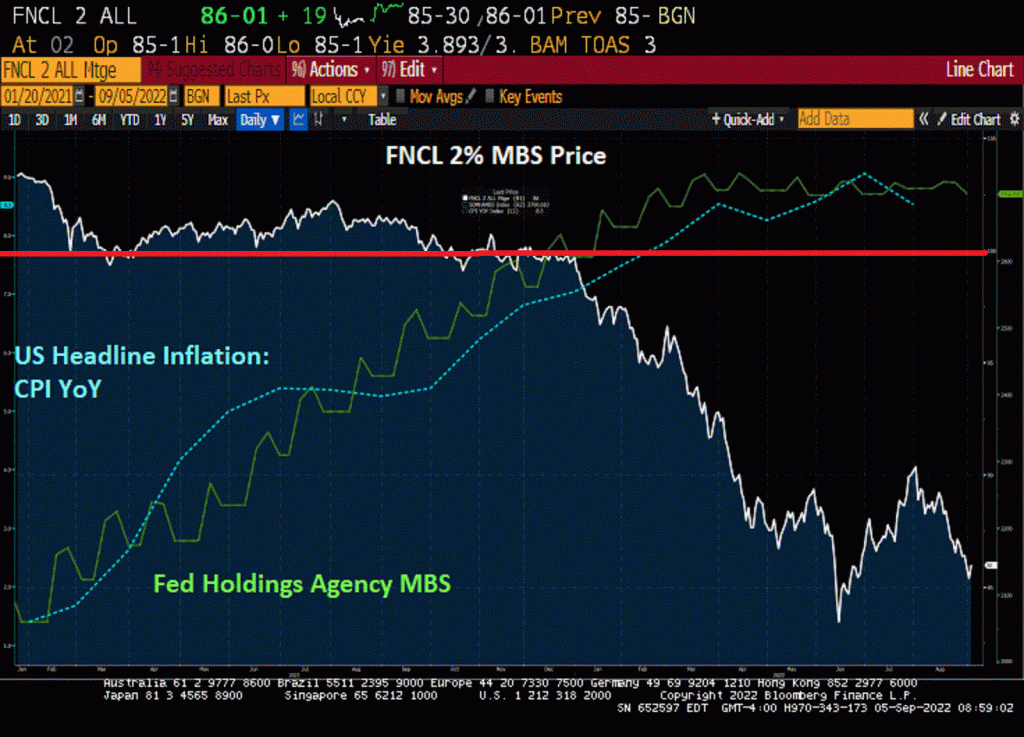
Here is an interesting chart of FNCL 2% Agency MBS.
Thanks to Federal Reserve increases in their target rate, the 30-year mortgage rate has risen above 6%.
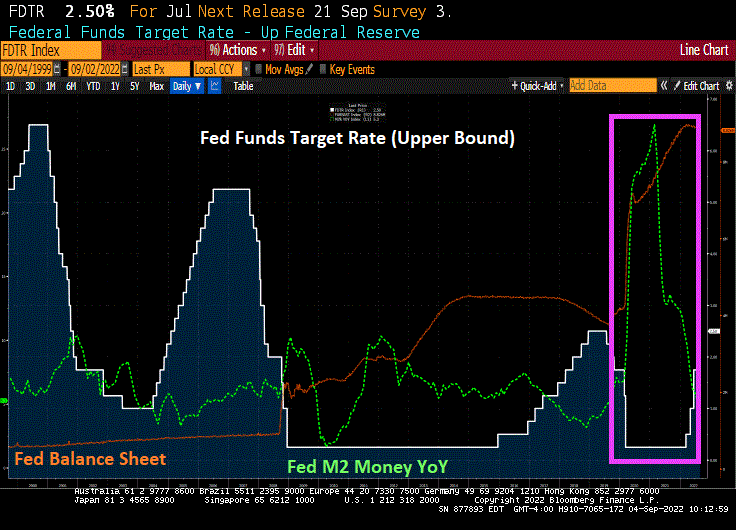
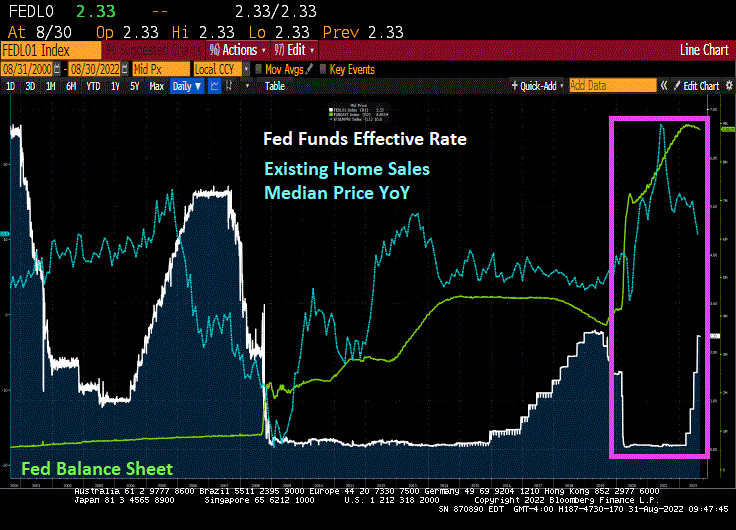
What drives me crazy about The Fed is their failure to removed monetary stimulus following the financial crisis of 2008 when they dropped their target rate to 25 basis points (0.25%) and began assets purchases (orange line). The Fed raises their target rate only once during Obama’s Presidency but then raised rates 8 times after Trump was elected President.
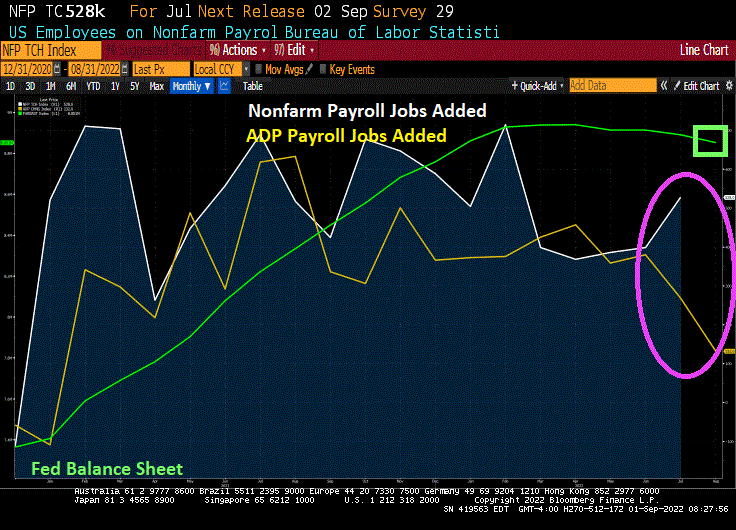
Now we are seeing The Fed NOT shrinking their balance sheet in a meaningful way. However M2 Money growth YoY (green line) has slowed to 5.2%.
While it is a good thing that The Fed is FINALLY reducing some of the monetary stimulus in place since 2008, the bad thing is that mortgage rates are rising rapidly.
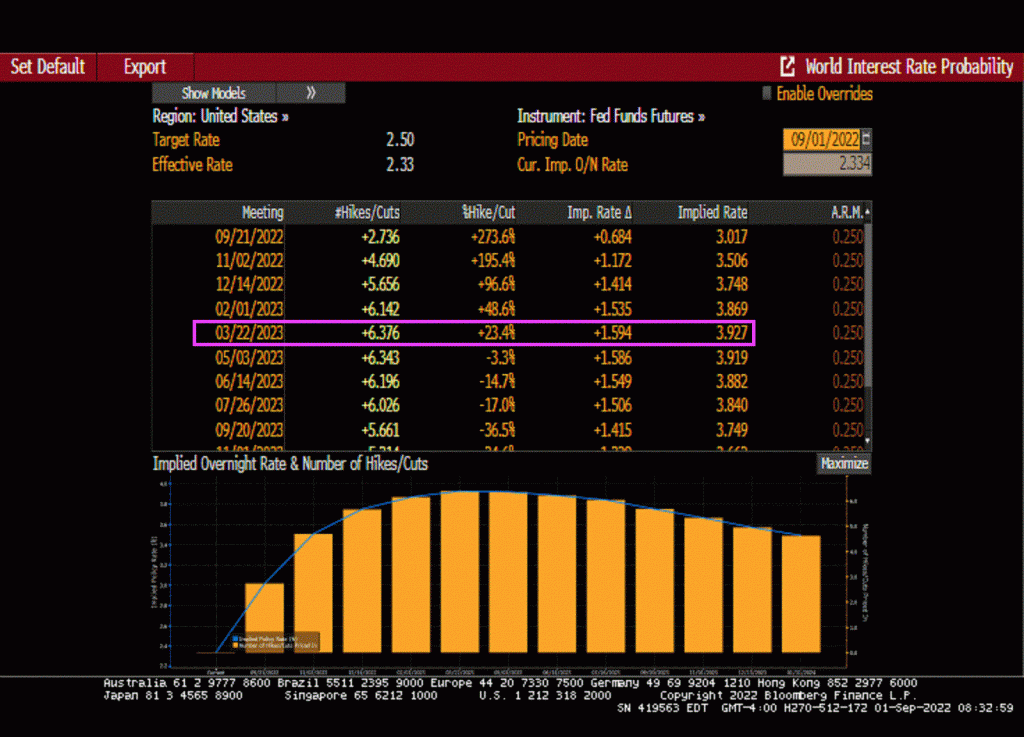
The Fed’s quantheads are predicted to resume easing in March 2023.
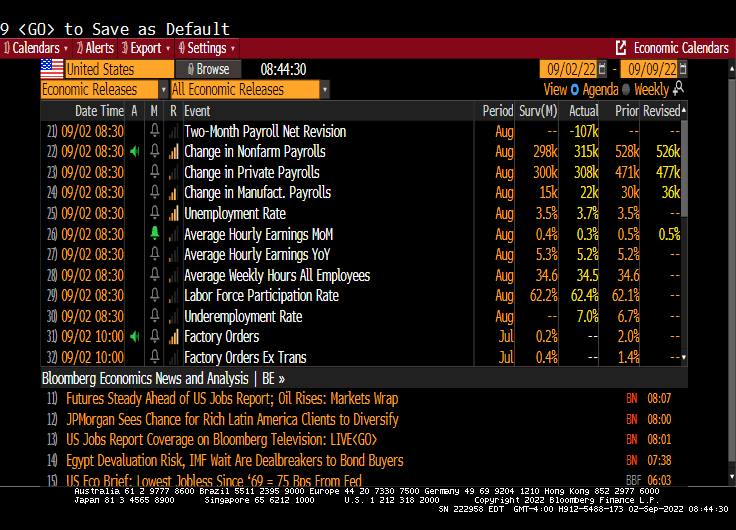
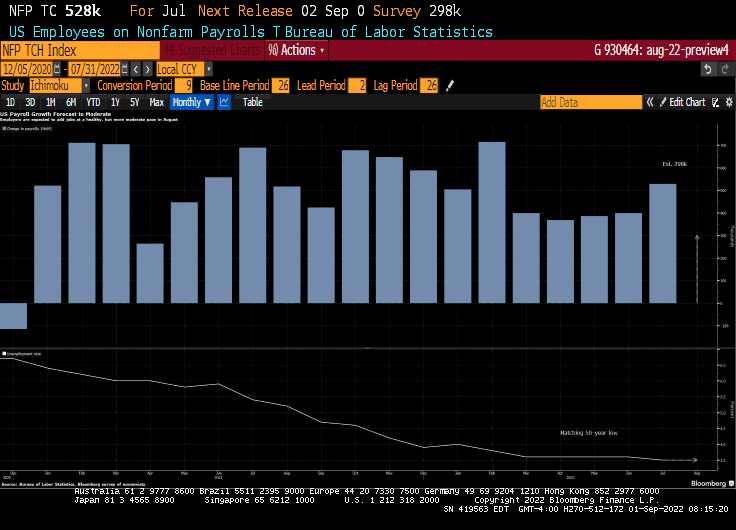
The August jobs report is out. 315k jobs were added, which was considerably higher than the ADP jobs added report of 132k. Hmm.
Be that as it may, US Average Hourly Earnings YoY remained at 5.2%. That’s a shame since the last inflation report had US inflation at 8.5%. That translates to REAL Average Hourly Earnings YoY of … -3.3%.
Labor force participation rose to 62.4%.
This is a decent jobs report and will likely lead The Fed to continue raising rates, particularly when The Fed sees that multiple jobholders has increased to cope with inflation.
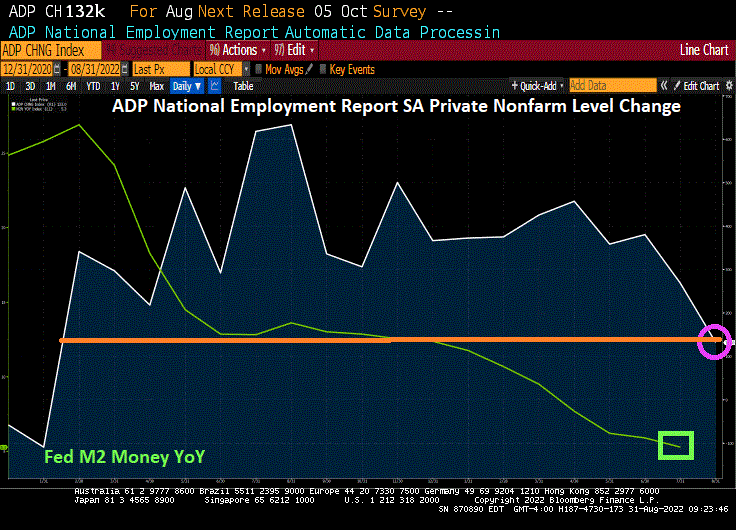
When we look at tomorrow’s US jobs report, it is important to acknowledge that 1) The Federal Reserve has not yet removed the Covid stimulus (green line) and 2) the ADP payroll jobs added was only 132k in August while non-farm payrolls jobs added in July was 528k. That is quite a spread!
(Bloomberg)The hotly anticipated US jobs report has the potential to tip the scales toward a third jumbo-sized hike in interest rates later this month after a wave of data that point to a resilient consumer and high labor demand.
Friday’s report is one of the last marquee releases Fed officials will have in hand before the mid-September policy meeting to help them decipher a complex economic and inflationary puzzle.
Forecasts call for a healthy, yet more moderate 298,000 gain in August payrolls and for the unemployment rate to hold steady at 3.5%, matching the lowest in five decades. Solid wage growth is also expected amid a persistent mismatch between labor demand and supply.
Such figures, in conjunction with a blowout July employment print, improving consumer sentiment figures and a surprise pickup in job openings, could be enough to push the Fed to raise borrowing costs by 75 basis points, extending the steepest interest-rate hikes in a generation to curb an inflation surge.
As of this morning, Fed Funds futures data is still pointing to The Fed Funds Target rate rising from 2.50% to around 4% by the March FOMC meeting. That is still a large jump of another 150 basis points anticipated.
The ADP National Employment Report SA Private Nonfarm Level Change printed this morning confirming what most of us already knew … the US economy is slowing if not already in recession.
The ADP jobs added grew by only 132k in August as The Fed’s M2 Money growth slowed.
Since The Federal Reserve and Federal government overstimulated the economy when Covid surfaced in early 2020, The Fed’s balance sheet expanded to near $9 TRILLION which helped existing home sales median price YoY hit 25.2% in May 2021 but falling to 10.8% YoY in July 2022 as The Fed tightened rates.
It will be a monetary inferno if The Fed decides to actually unwind its $9 trillion balance sheet.
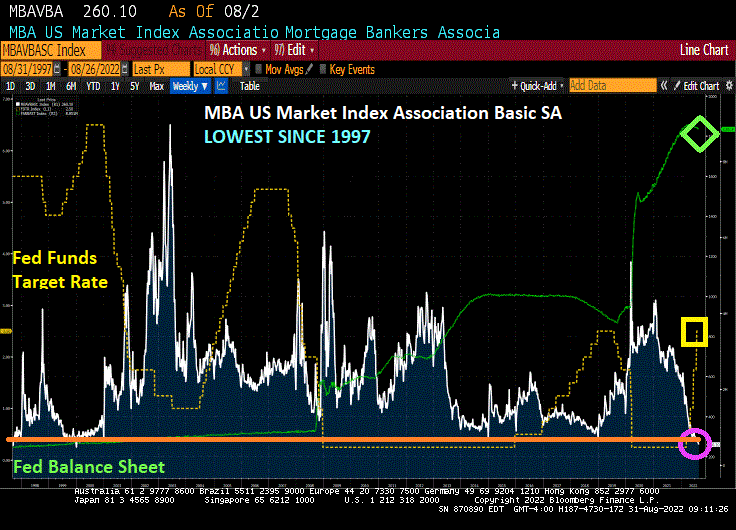
Mortgage application volume dropped and remained at a multi-decade low last week(back to 1997), led by an 8 percent decline in refinance applications, which now make up only 30 percent of all applications. Purchase applications have declined in eight of the last nine weeks, as demand continues to shrink due to higher rates and a weaker economic outlook.
Mortgage applications decreased 3.7 percent from one week earlier, according to data from the Mortgage Bankers Association’s (MBA) Weekly Mortgage Applications Survey for the week ending August 26, 2022.
The unadjusted Purchase Index decreased 4 percent compared with the previous week and was23 percent lower than the same week one year ago.
The Refinance Index decreased 8 percent from the previous week and was 83 percent lower than the same week one year ago.
Just wait for The Federal Reserve to start unwinding its enormous balance sheet!
US home price growth is decelerating as The Federal Reserve let’s some of the air out of the monetary tires.
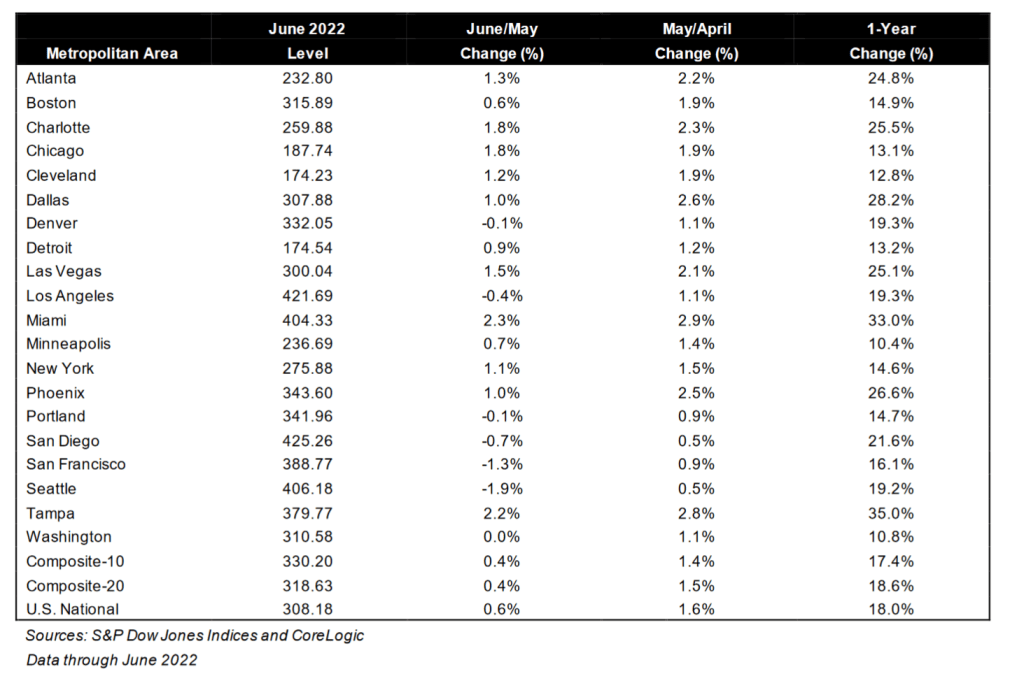
The S&P CoreLogic Case-Shiller U.S. National Home Price NSA Index, covering all nine U.S. census divisions, reported an 18.0% annual gain in June, down from 19.9% in the previous month. The 10-City Composite annual increase came in at 17.4%, down from 19.1% in the previous month. The 20-City Composite posted an 18.6% year-over-year gain, down from 20.5% in the previous month.
Tampa, Miami, and Dallas reported the highest year-over-year gains among the 20 cities in June. Tampa led the way with a 35.0% year-over-year price increase, followed by Miami in second with a 33.0% increase, and Dallas in third with a 28.2% increase. Only one of the 20 cities reported higher price increases in the year ending June 2022 versus the year ending May 2022.
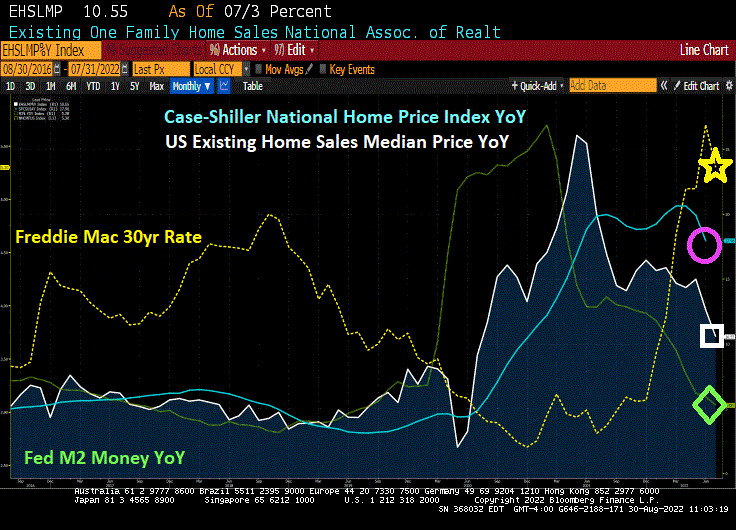
While the Case-Shiller National home price index slowed to 18% YoY in June, the median price for existing home sales slowed to 10.55% YoY in July as The Fed’s M2 Money growth YoY slowed to 5.28% and Freddie Mac’s 30yr mortgage rate rose to 5.3%.
Bear in mind that Case-Shiller is lagged compared to the existing home sales numbers. Much like the New York Yankees manager picking the hottest batter in June to start in September. The Yankees traded poor-hitting Joey Gallo to the LA Dodgers to supplement poor-hitting Cody Bellinger.
In any case, as of June 2022, the 20 metro areas covered by Case-Shiller all grew in price in double digits with alligator-infested Tampa and Miami FL in the 30% rate, rattlesnake-infested Dallas is in 3rd place at 28.2%. Phoenix AZ, where I used to live, slowed to 26.6%. Yes, I had rattlesnakes on my property (a nest of Mohave Rattlers) and a large Diamond-backed Rattler behind my house).
Let’s see how housing holds up with more Fed monetary tightening. Fed Chair Powell is predicting “pain.”
As inflation burns the US middle class and low wage workers, The Federal Reserve reaffirmed at Jackson Hole that they are the NEW Smoky The Bear (only The Fed can fight inflation fire!) But of course, Federal spending and energy policies can drive up prices too.
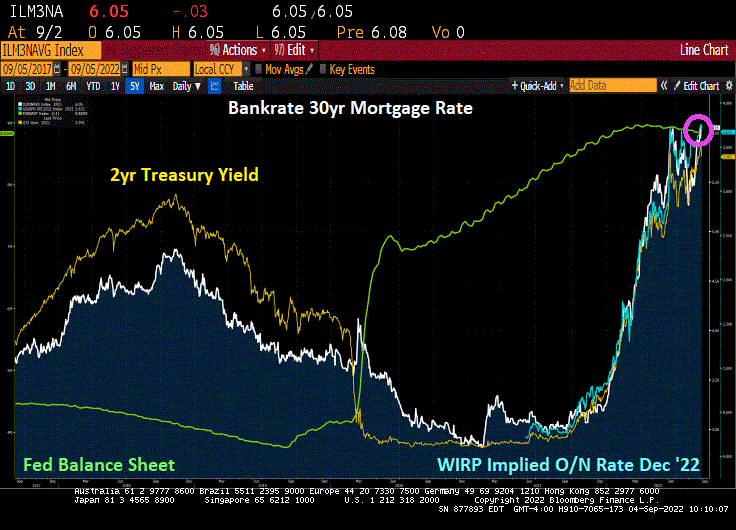
Having said that, the 2-year Treasury yield and 30yr mortgage rate are rising rapidly.
The Fed is trying to cool demand by raising rates after lax monetary policy since late 2008.
While the US 2-year Treasury yield is up only slightly today, the Eurozone is seeing their 2-year sovereign yields spiking by 11-15+%.


You must be logged in to post a comment.