TED refers to the difference between the three-month Treasury bill and the three-month LIBOR based in U.S. dollars, a measure of fear in the market.
The 3-month TED spread is rising awfully fast. A sign of impending recession.
US bank credit default swaps (CDS) are rising fast as inflation gets ugly.
The US Treasury 10Y-3M curve is bumping against the zero barrier.
I am still shaking my head at President Biden chastising gasoline stations for not lowering prices at the pump when refiners are near full capacity and the Biden Administration is doing nothing to increase the supply of US-source non-green energy.
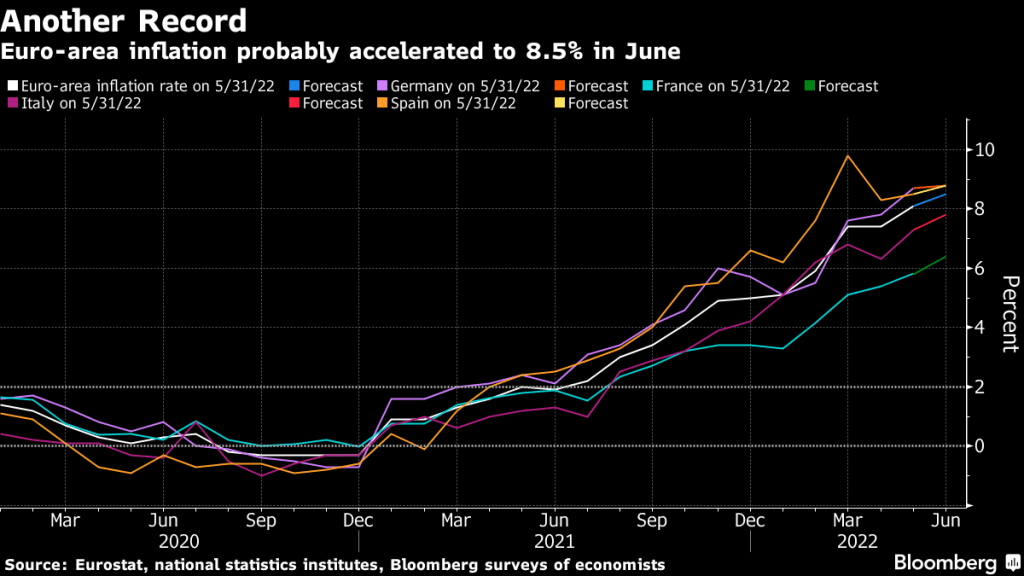
The ECB is planning on a Blitzkrieg Bop, monetary style.
When Lagarde talks about the first line of defense, all I can picture is The Maginot Line in France, a failed defensive line that was easily bypassed by the German Wehrmacht (army).
The European Central Bank will activate the bond-purchasing firepower it’s earmarked as a first line of defense against a possible debt-market crisis on Friday, according to President Christine Lagarde.
Applying “flexibility” to how reinvestments from the ECB’s 1.7 trillion-euro ($1.8 trillion) pandemic bond-buying portfolio are allocated is aimed at curbing unwarranted turmoil in government bonds as interest rates are lifted from record lows to curb unprecedented inflation.
Net buying under a separate asset-purchase program is also set to end on Friday.
In other words, Euro-area inflation has exploded in 2021, just like the USA.
But the US also has an inflation problem caused in part by Covid and the government’s reaction to Covid: economic shutdown and massive Federal monetary and fiscal stimulus. The stimulus is still in play.
The bond market is already anticipating an about-face by The Federal Reserve (implied overnight rate peaking at the March 2023 FOMC meeting, then receding.
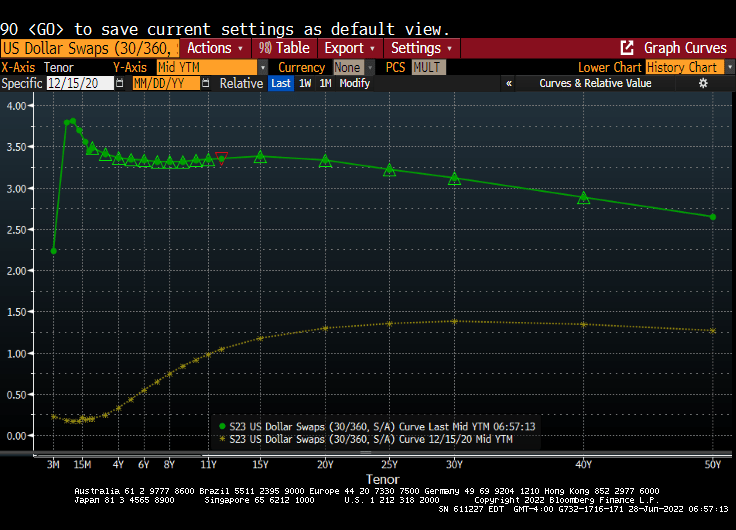
Again, nothing has been the same since the Covid outbreak of 2020 and Fed monetary blitz. Here is the US Dollar Swaps curve before Covid (yellow line) and today’s Fed-enhanced curve (green).
Mortgage rates in the US have climbed to 6% then backed-off slightly. The good ole Back-off Boogaloo as The Fed attempts to unwind its monetary stimulypto.
The French Maginot Line, easily bypassed by German tanks. The Federal Reserve is the US’s Maginot Line. The Yellenot Line??
Consumers are healthy? It is true that the US U-3 uemployment rate is low (3.6% versus 14.70% in April 2020 thanks to government shutdowns over Covid). But even though unemployment is low, consumer sentiment is at its lowest point since 1977.
Generally, consumer sentiment is high when unemployment is low, but not this time around. Currently, inflation is at the highest level since March 1980 even though consumer sentiment bottomed-out in April 1980.
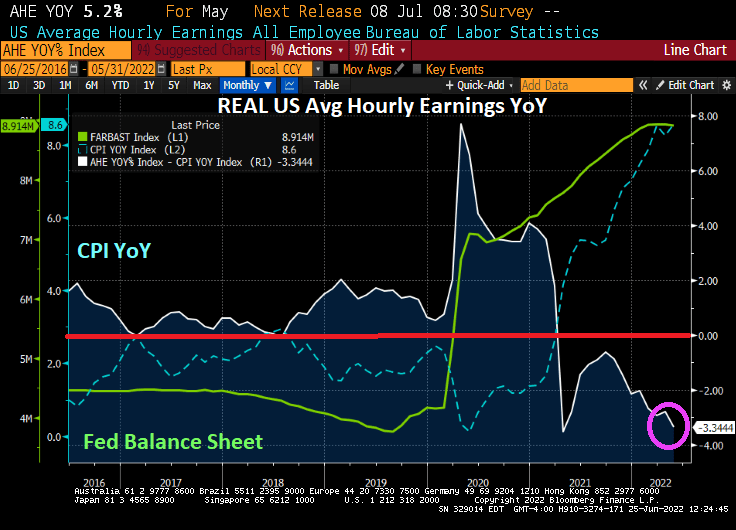
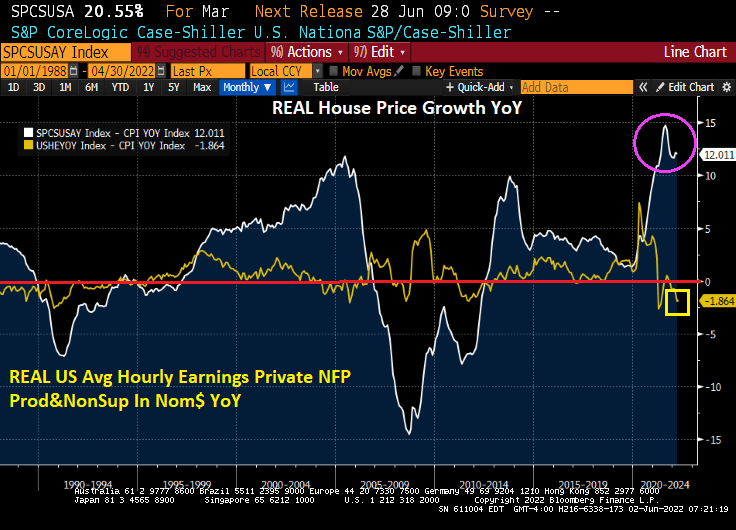
Here is my chart showing that REAL average hourly earnings growth YoY is negative and getting worse, hardly a sign of “healthy consumers.”
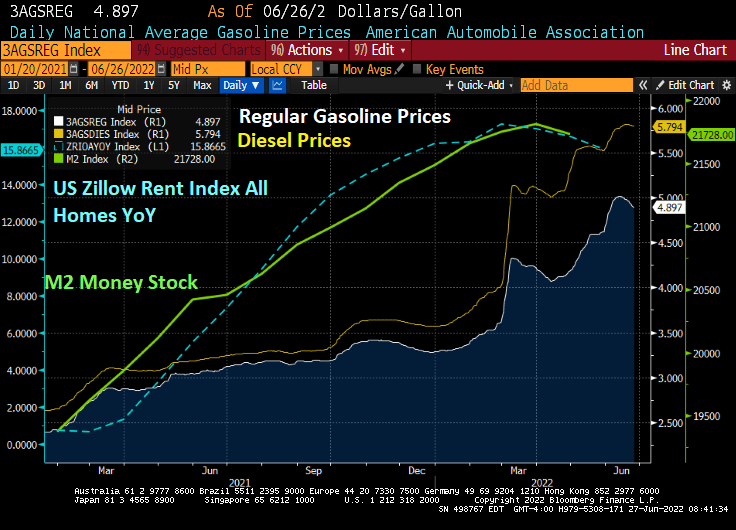
Of course, rising gasoline and diesel prices have risen dramatically since 2021, but are declining slightly thanks to the global economic slowdown (read “lower demand”).
And a M2 Money Stock (green line) declined, US rents (blue line) declined as well.
No problemo, says James “Bully” Bullard, President of the St Louis Federal Reserve. Bullard said that US recession fears are overblown with consumers “healthy.”
Really Jim?
Inflation is so bad they REAL average hourly earnings growth keeps falling and is now -3.34% YoY.
Apparently, real GDP growth of ZERO doesn’t bother Bullard either.
How crazy was The Federal Reserve’s overreaction to the government shutdowns surrounding the Covid epidemic? While most analysts talk about California, I am going to discuss … Cleveland Ohio as an example of how The Fed can destroy markets.
The Case-Shiller home price index for Cleveland rose 31.5% since January 2020 just before The Fed unleashed its massive monetary stimulus on an unsuspecting city.
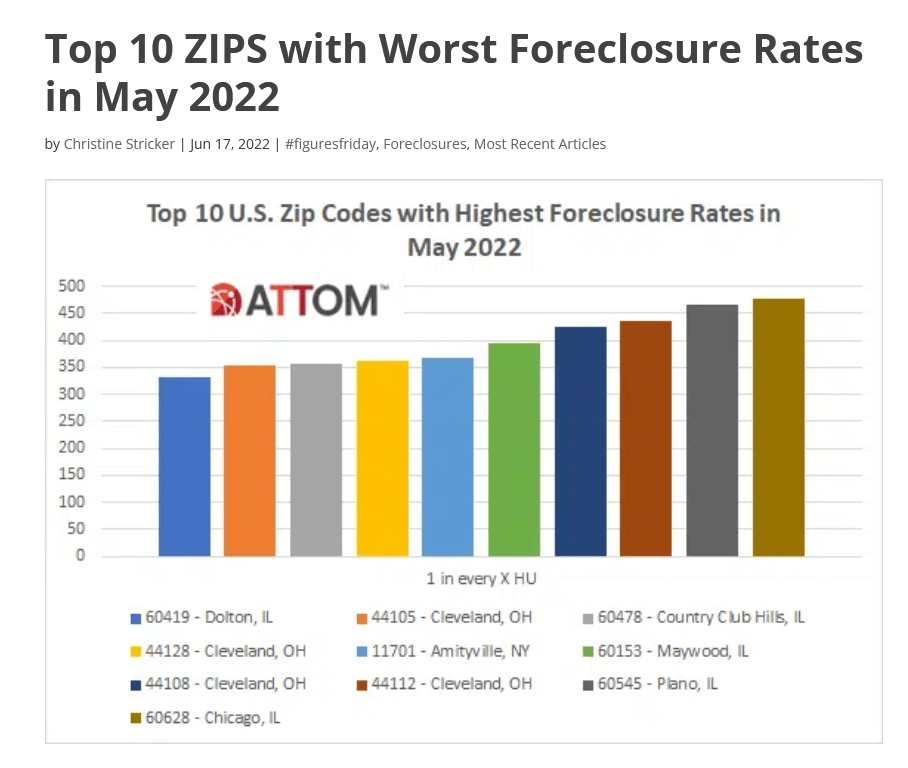
But as The Fed starts to tighten monetary policy after Yellen’s too loose for too long policies followed by Powell, foreclosure rates are soaring in Cleveland. In fact, according to Attom Data, 5 of the top 10 zip codes with the worst foreclosure rates in May 2022 were in Cleveland.
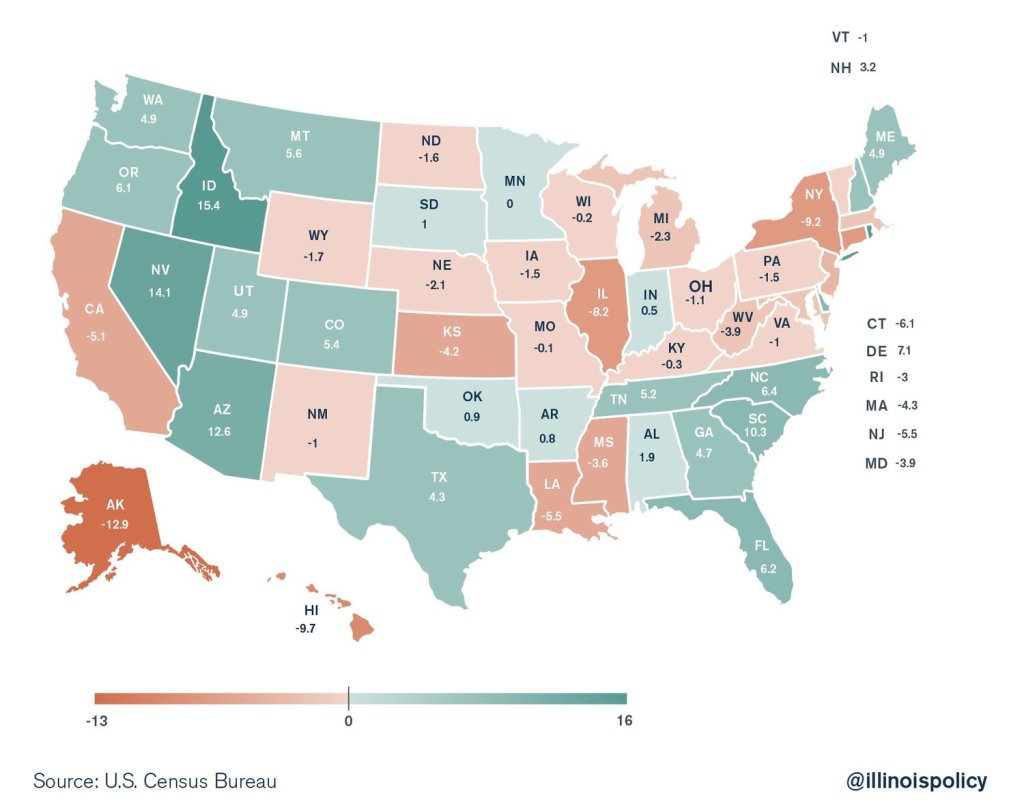
Of course, Cleveland is much like much of the rust belt (except Columbus Ohio). The rust belt is losing population along with heavy tax states like New York and Illinois. Destination states? Texas, Florida, the Carolinas and Tennessee.
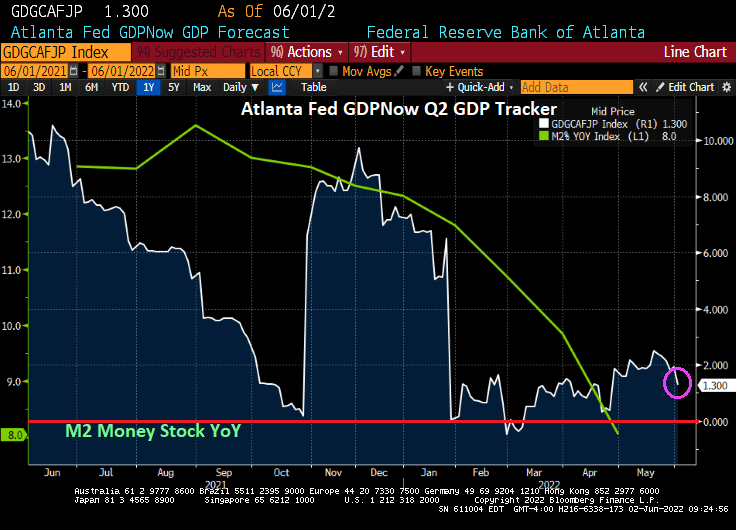
Then at the national level, Atlanta Fed’s GDPNow real-time tracker fell to 0% growth.
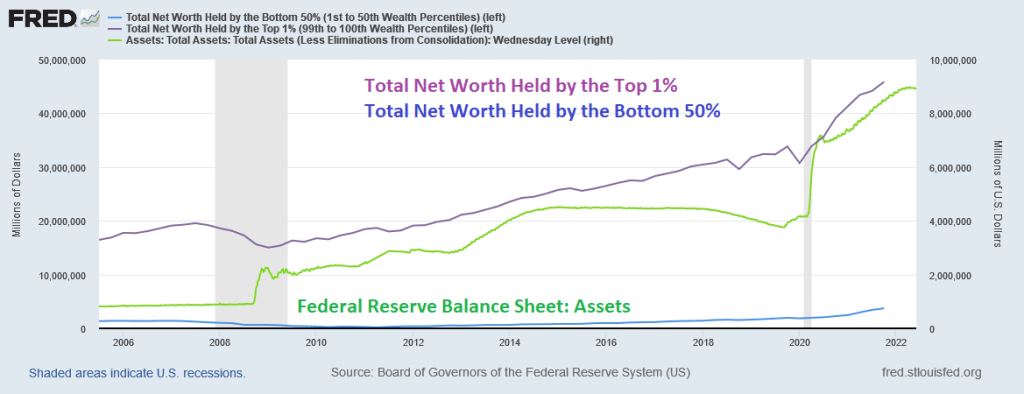
Pennies from Heaven. That is what the bottom 50% received from The Federal Reserve’s massive doses of monetary stimulus (or stimulypto).
There was one big dose of monetary stimulus in late 2008 surrounding the financial crisis and housing bubble burst, another doses (aka, QE 2 and QE3) then the biggest dose of all with the outbreak of Covid in early 2020.
President Biden should have mentioned on Jimmy Dimmel last night that The Federal Reserve has helped the bottom 50% with its endless monetary stimulus.
But if you were fortunate enough to own a home (the top 1% are likely homeowners), then you benefited from The Fed’s monetary stimulypto.
And I noticed that Biden didn’t mention plunging REAL average weekly earnings YoY.
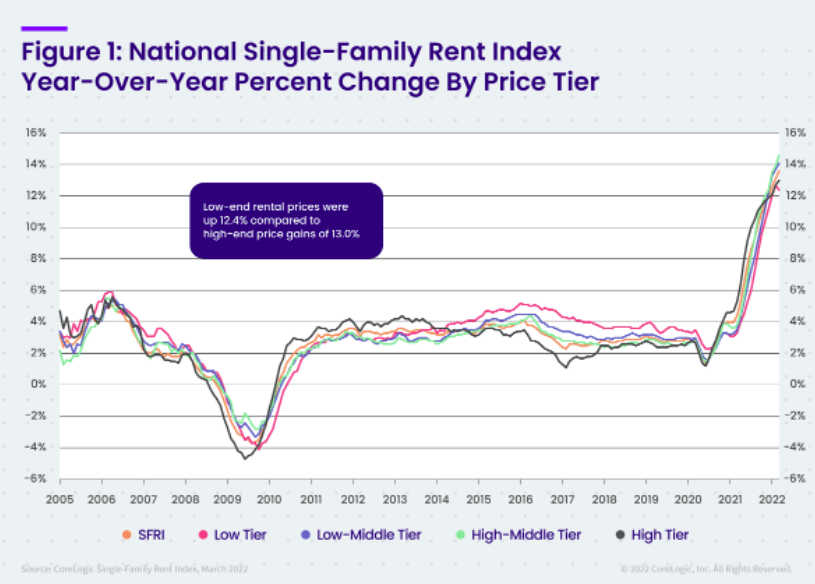
The Federal Reserve’s monetary “policies” have benefited the top 1% and homeowners relative to the bottom 50% (who often rent and got clobbered with 20% growth in rents).
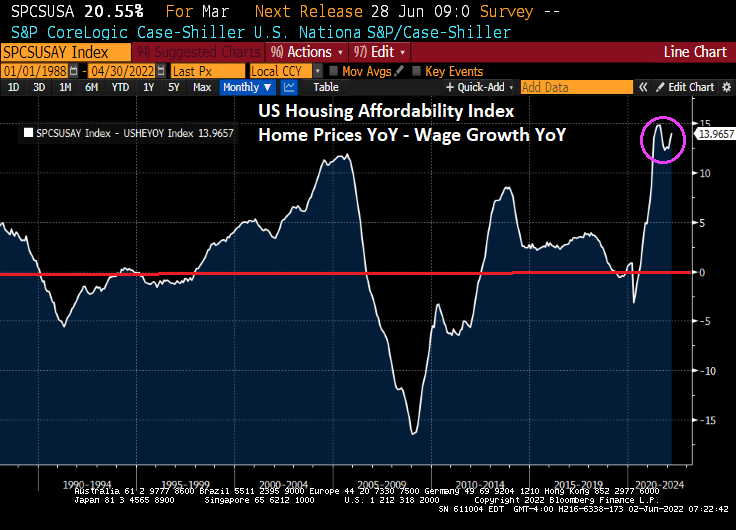
Great job, Fed! Making housing more unaffordable for rents (combine rising rents and declining REAL wages and we have a real affordability problem).
Home affordability for first time homebuyers?
And what is with Biden’s ear lobes? As inflation is rising, his ear lobes are shrinking.
The inflation numbers are out tomorrow. I noticed that Biden and Jimmy Dimmel only discussed gun control, not the sad state of the economy under Biden.
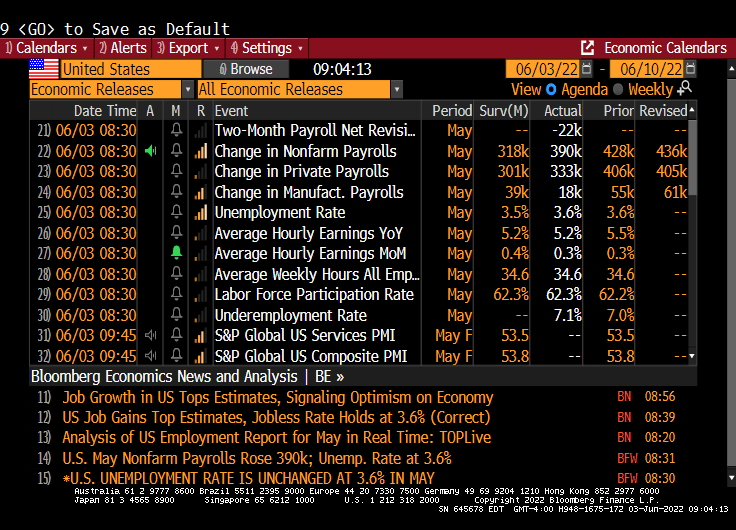
But let’s start with US average hourly earnings growth less inflation (aka, REAL hourly earnings). It printed at -2.8% YoY, meaning that inflation is causing REAL hourly earnings to fall.
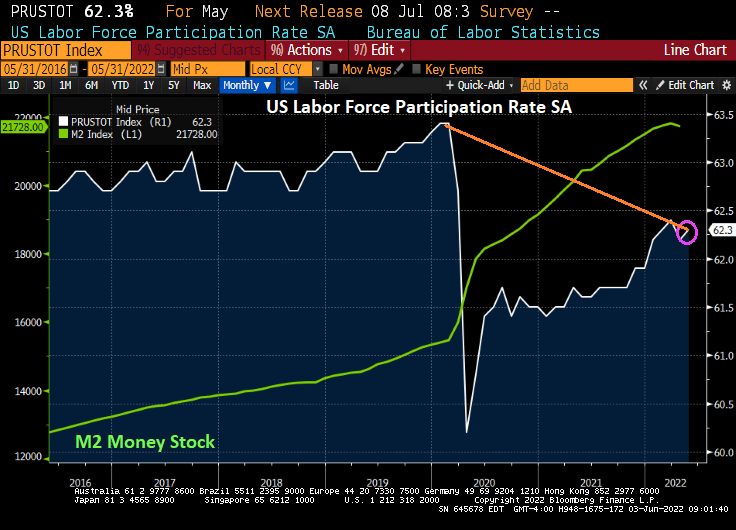
Labor force participation rose to 62.3%, but remains below pre-Covid levels.
The unemployment rate remains the same at 3.6%, but the underemployment rate rose to 7.1%.
Jobs added?
Employment in leisure and hospitality increased by 84,000 in May, as job growth continued in food services and drinking places (+46,000) and accommodation (+21,000). Employment in leisure and hospitality is down by 1.3 million, or 7.9 percent, compared with February 2020.
Employment in professional and business services rose by 75,000 in May. Within the industry, job gains occurred in accounting and bookkeeping services (+16,000), computer systems design and related services (+13,000), and scientific research and development services (+6,000). Employment in professional and business services is 821,000 higher than in February 2020.
In May, transportation and warehousing added 47,000 jobs. Employment rose in warehousing and storage (+18,000), truck transportation (+13,000), and air transportation (+6,000). Employment in transportation and warehousing is 709,000 above its February 2020 level.
Employment in construction increased by 36,000 in May, following no change in April. In May, job gains occurred in specialty trade contractors (+17,000) and heavy and civil engineering construction (+11,000). Construction employment is 40,000 higher than in February 2020.
In May, employment increased by 36,000 in state government education and by 33,000 in private education. Employment changed little in local government education (+14,000). Compared with February 2020, employment in state government education is up by 27,000, while employment in private education has essentially recovered. Employment in local government education is down by 308,000, or 3.8 percent, compared with February 2020.
Employment in health care rose by 28,000 in May, including a gain in hospitals (+16,000). Employment in health care overall is 223,000, or 1.3 percent, lower than in February 2020.
Manufacturing employment continued to trend up in May (+18,000). Job gains occurred in fabricated metal products (+7,000), wood products (+4,000), and electronic instruments (+3,000). Employment in manufacturing overall is slightly below (-17,000 or -0.1 percent) its February 2020 level.
Wholesale trade added 14,000 jobs in May, including gains in durable goods (+10,000) and electronic markets and agents and brokers (+6,000). Employment in wholesale trade is down by 41,000, or 0.7 percent, compared with February 2020.
Mining employment increased by 6,000 in May and is 80,000 higher than a recent low in February 2021.
Employment in retail trade declined by 61,000 in May but is 159,000 above its February 2020 level. Over the month, job losses occurred in general merchandise stores (-33,000), clothing and clothing accessories stores (-9,000), food and beverage stores (-8,000), building material and garden supply stores (-7,000), and health and personal care stores (-5,000).
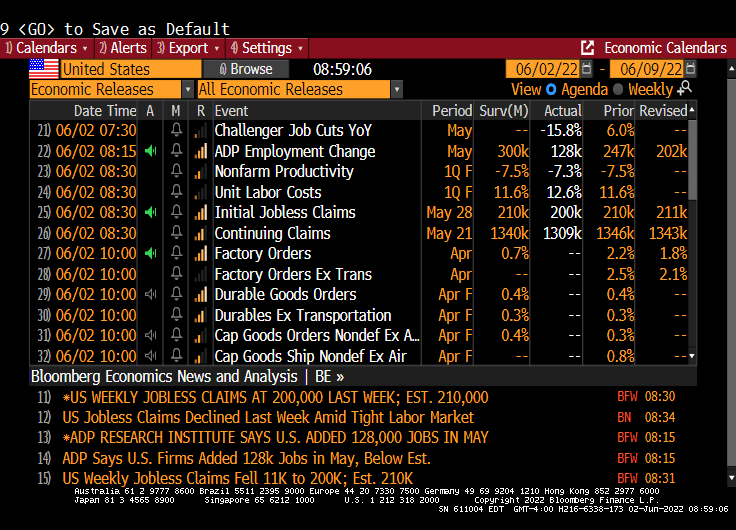
First, ADP US jobs added flopped (only 128.2k jobs added, the lowest reading under Biden and the massive Federal Reserve stimulus). Much lower than the expected 300k. Second, nonfarrm labor productivity fell in Q1 -7.3%. Third, unit labor costs soared to +12.6%.
M2 Money stock YoY is falling, but remains at 8% YoY.
Here is the summary table for today.
And then we have the Atlanta Fed GDPNow, real-time GDP tracker for Q2 at 1.3%.
As M2 Money growth slows, US GDP is slowing as well. Is this a monetary hangover??
And, of course, rents are soaring for the American middle class and low wage workers.
President Biden met with Federal Reserve Chairman Powell to discuss how to control the inflation that is crushing the middle class and low-wage workers.
Here is a good example of why Biden is worried. There is a mid-term election on the horizon and people are angry and scared. Housing, generally the largest asset owned (or rented) by a household is simply unaffordable thanks, in part, to the over-stimulation of the economy by 1) The Federal Reserve in terms of money printing and 2) the Federal government in terms of fiscal stimulus in response to the Covid outbreak in March 2020.
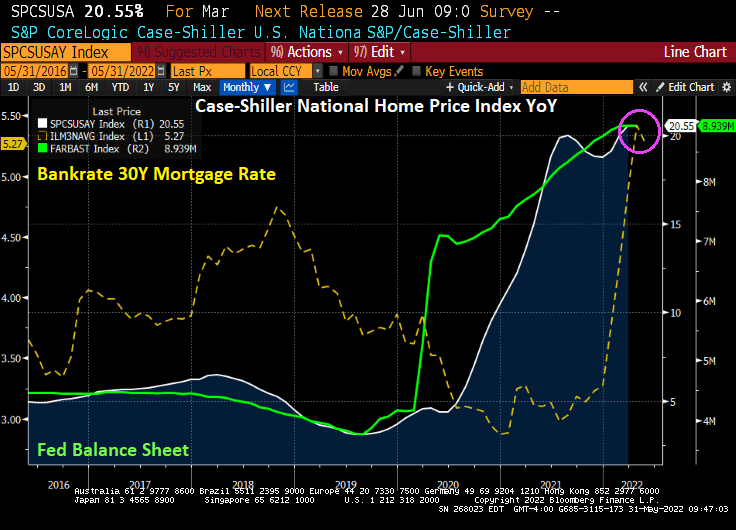
In nominal terms, the gap between US home prices (Case-Shiller National Home Price Index YoY – US Average Hourly Earnings YoY) is near the all-time high.
Yes, home price growth exploded upwards when The Fed rapidly expanded their balance sheet in response to the Covid outbreak … and only now are considering shrinking the balance sheet.
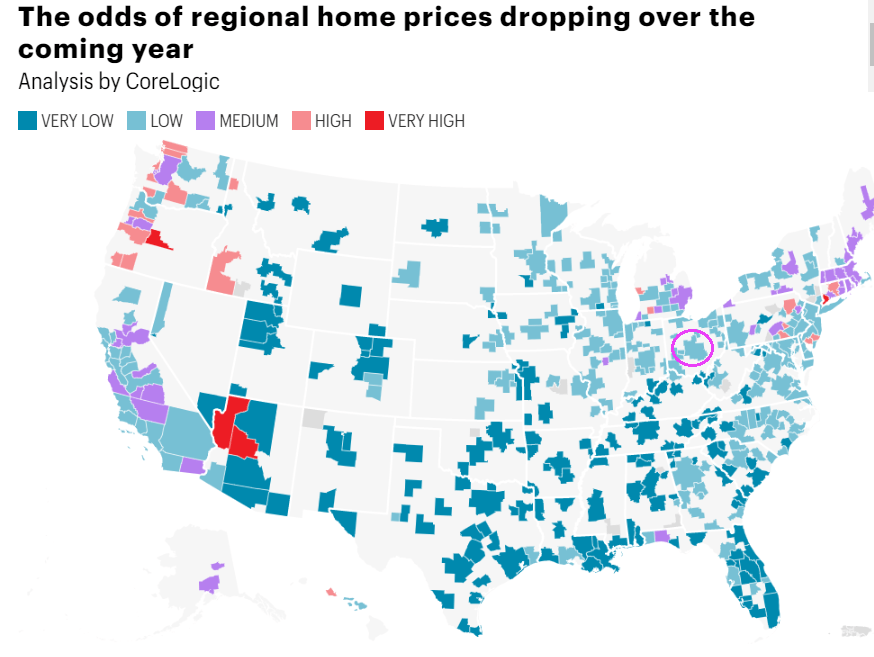
In terms of house prices, CoreLogic has a nice chart depicted the odds of home prices dropping over the coming year. I circled Columbus Ohio because that is where I am moving (knock on wood).
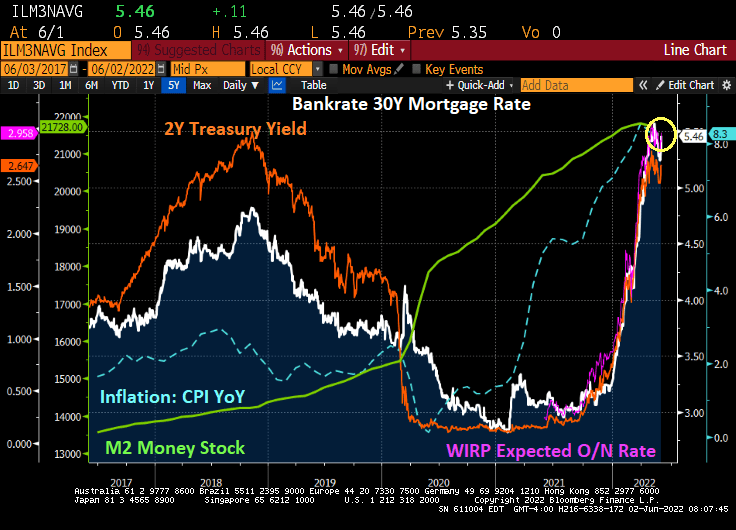
And then we have the 30-year mortgage rate rising with The Fed’s expected tightening of monetary policy. That will certainly make housing even less affordable, unless house price growth cools dramatically.
US mortgage rates are up slightly this morning. Bankrate’s 30-year mortgage rate survey is up to 5.29%.
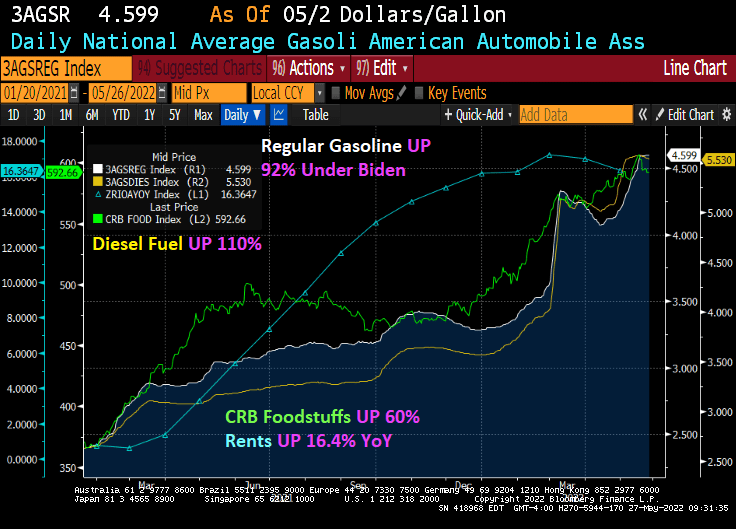
The Biden Scorecard is still a bleak one (for non-elitists). Regular gasoline is UP 92% under Biden, Diesel fuel is UP 110%, foodstuffs are up 60% under Biden, Zillow all-house rents are UP 16.4% YoY.


You must be logged in to post a comment.