I admit, I follow market data to get a signal of what is happening to mortgage rates and I got one. With Putin and Russia invading Ukraine, markets are in turmoil
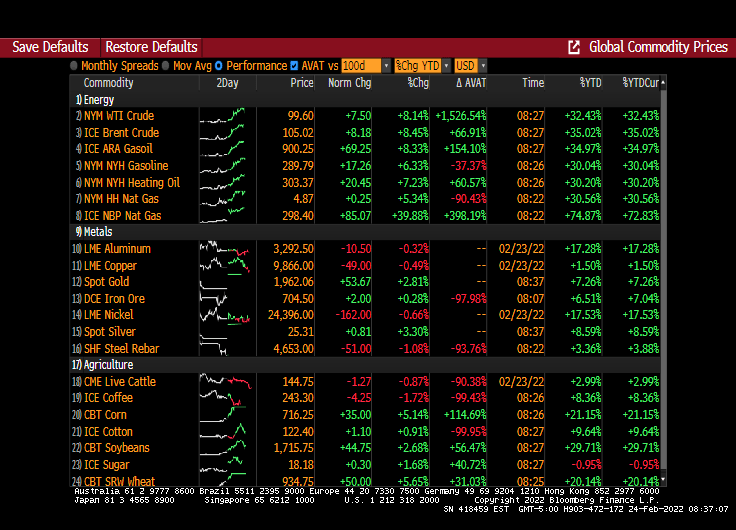
WTI Crude is up 8.14% this morning, Brent Crude is up 8.45% and NBP (UK) Natural gas is up 40%.
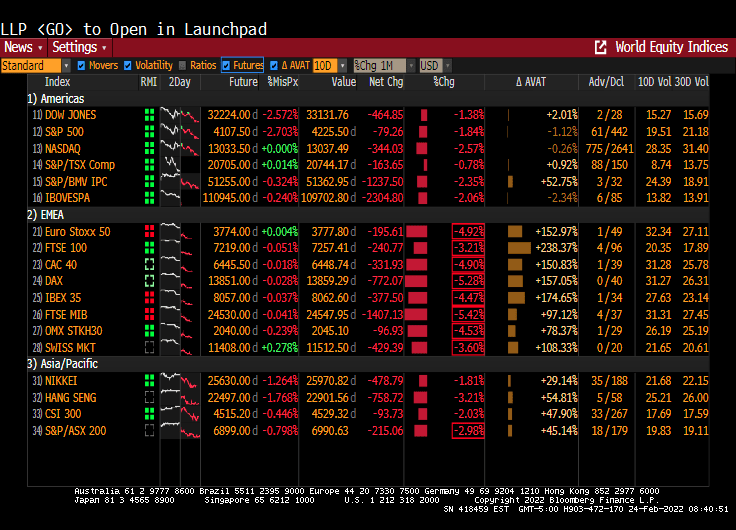
Europe is having a bad day equity market-wise. Eurostoxx 50 was down 4.92%. The US Dow is braced for a 2.5% opening.
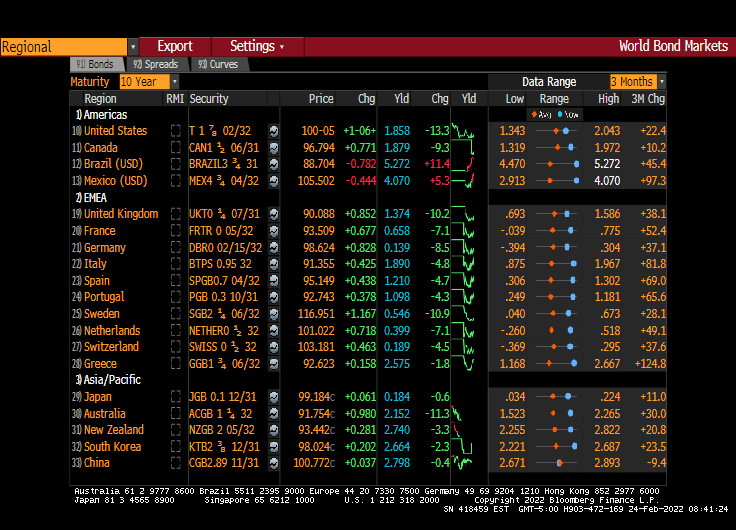
Now to bonds. The 10-year Treasury yield is down 13.3 bps this morning. Sweden and UK are down 10 bps as well.
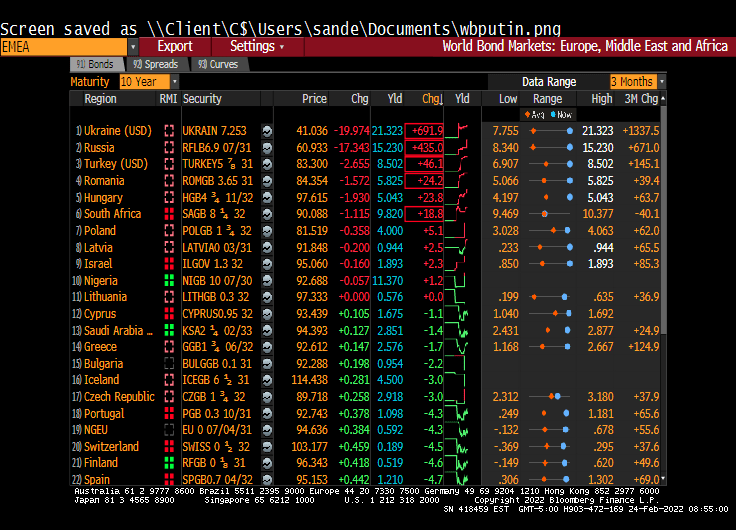
How about the new Russian front? Ukraine’s 10y yield rose 691.0 bps while Russia’s 10Y yield rose 435 bps.
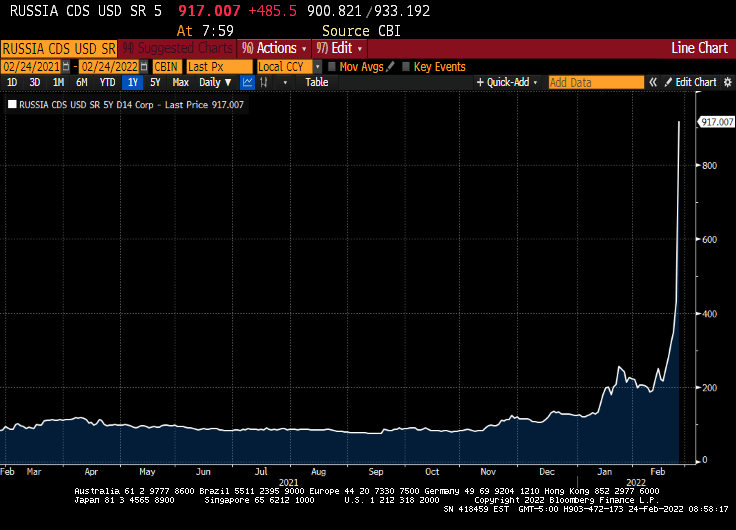
Russian 5Y Credit Default Swaps (CDS) leaped to a Greek-like 917.
Well, it looks like the sanctions imposed by Winken (US VP Harris), Blinken (US Secretary of State) and Nod (US President Biden because he always looks half-asleep) apparently didn’t work as intended.
It is not surprising that applications for a residential mortgage have crashed and burned after The Federal Reserve’s announced intentions to raise their target rate and trim the ballast in the economic tanks. But dang!
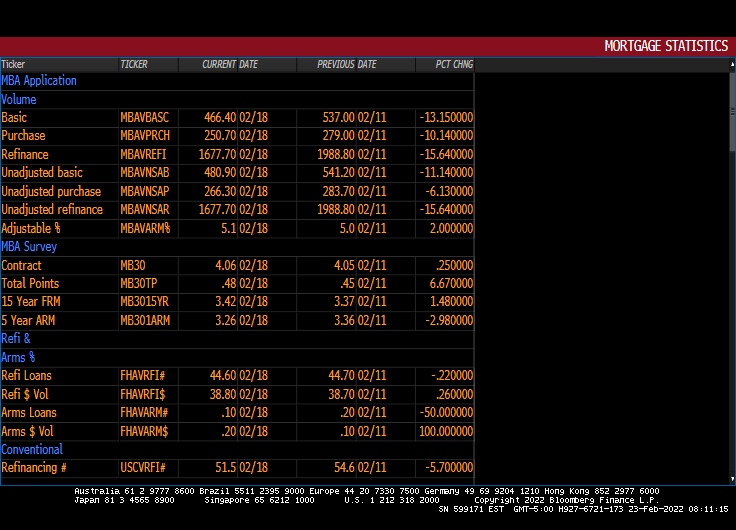
Mortgage applications decreased 13.1 percent from one week earlier, according to data from the Mortgage Bankers Association’s (MBA) Weekly Mortgage Applications Survey for the week ending February 18, 2022.
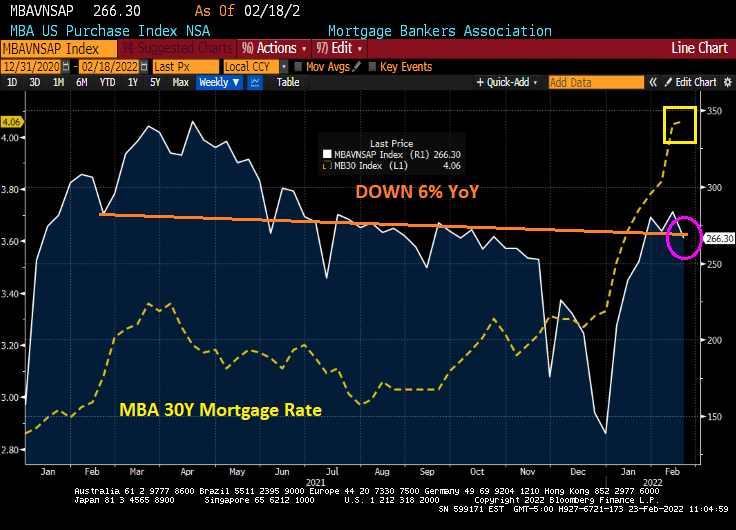
The seasonally adjusted Purchase Index decreased 10 percent from one week earlier. The unadjusted Purchase Index decreased 6 percent compared with the previous week and was 6 percent lower than the same week one year ago.
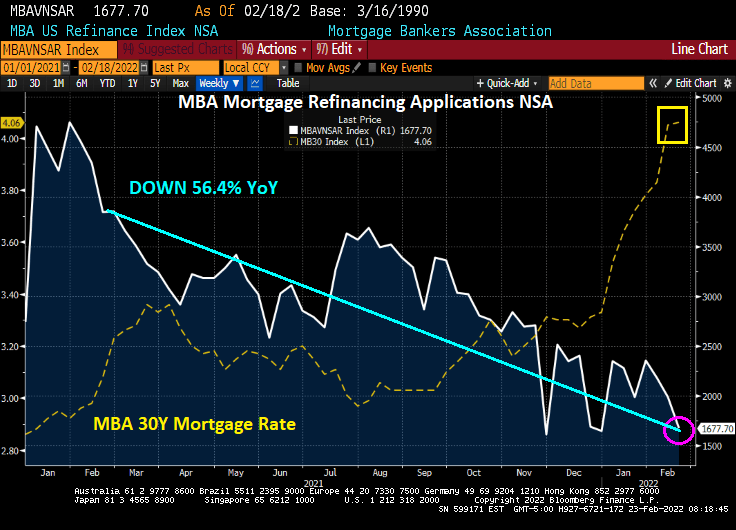
The Refinance Index decreased 16 percent from the previous week and was 56.4 percent lower than the same week one year ago.
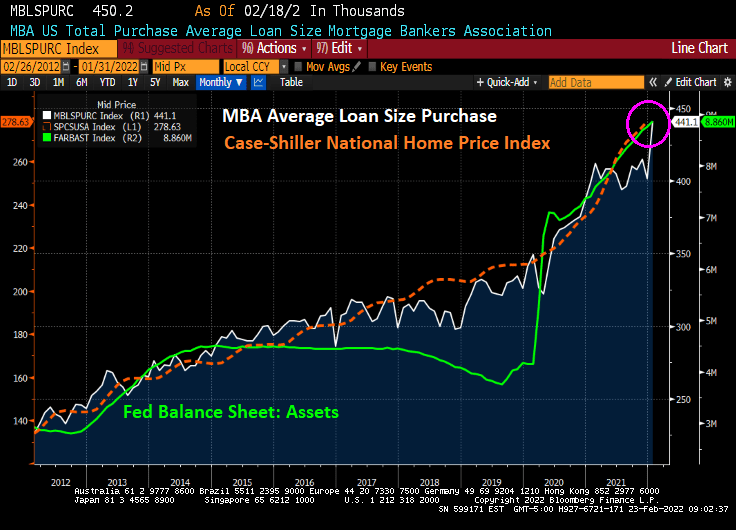
While the average loan size did not increase this week, it remained close to the survey’s record high.
What The Fed giveth, The Fed can taketh away. Let’s see if Thurston Powell The Great Magician can raise rates and NOT crash the housing and mortgage markets.
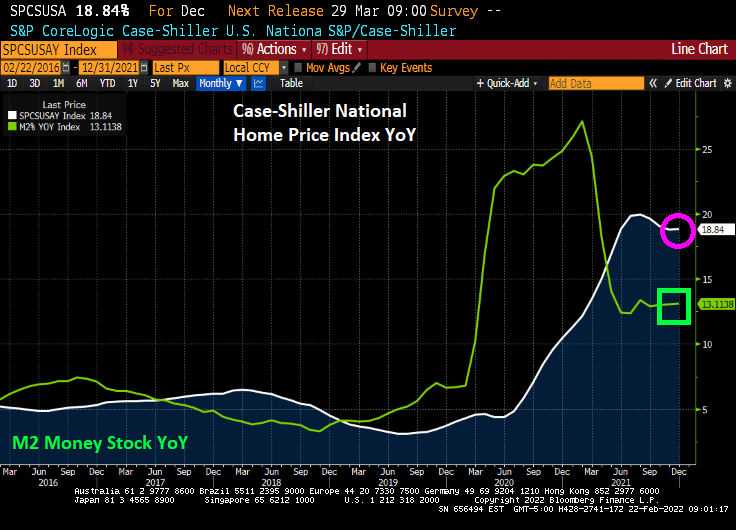
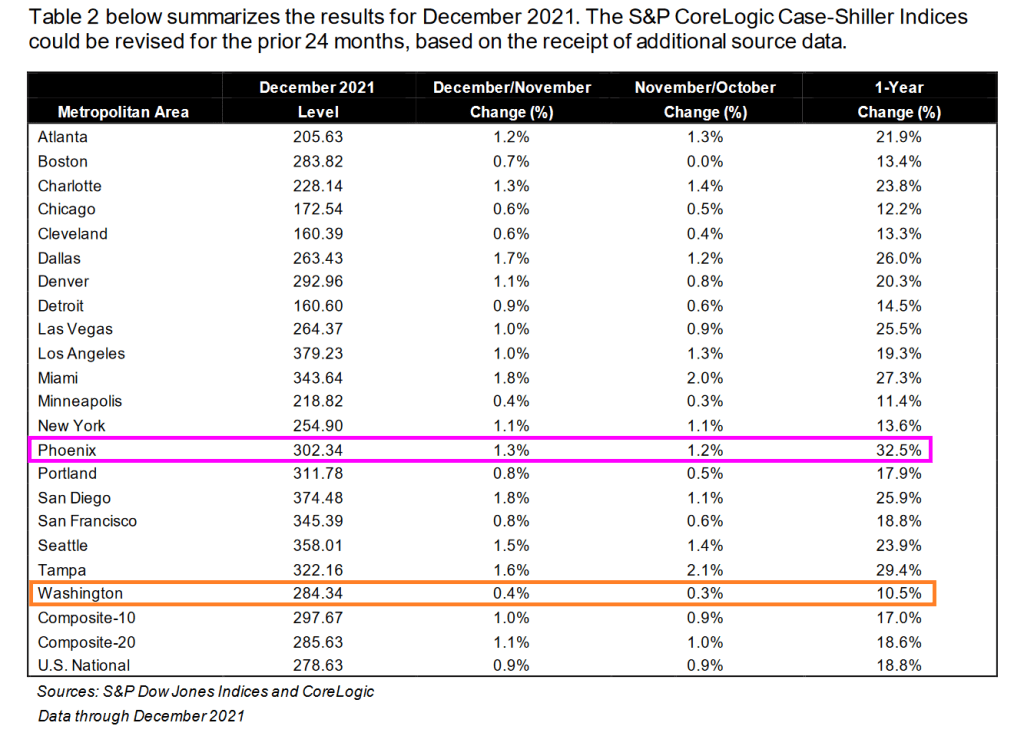
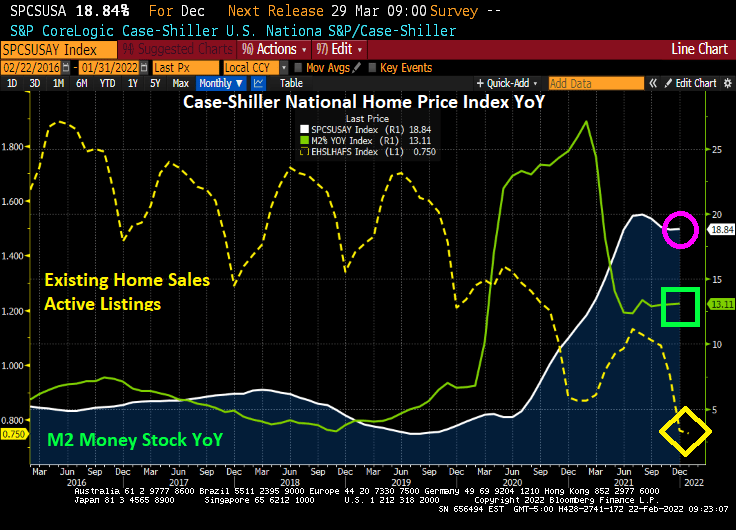
All 20 metro areas in the Case-Shiller 20 index grew at 10% or higher YoY with my former home city Phoenix leading the way at 32.5% YoY house price growth. Washington DC, aka Mordor on The Potomac, was in last place at 10.5% YoY.
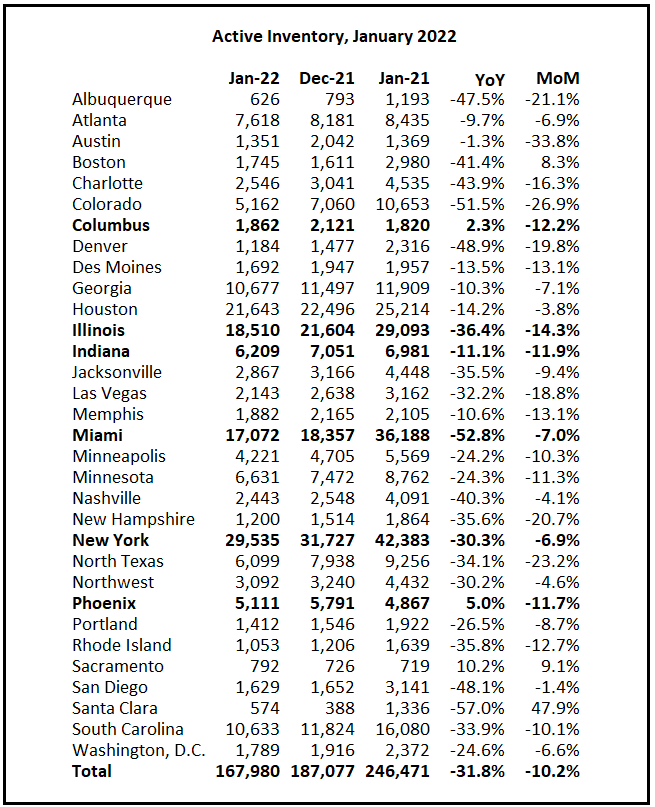
In terms of active inventory of housing, only Phoenix and Columbus Ohio are showing positive growth in active inventory YoY. But even Phoenix and Columbus saw a decline MoM (or month-over-month).
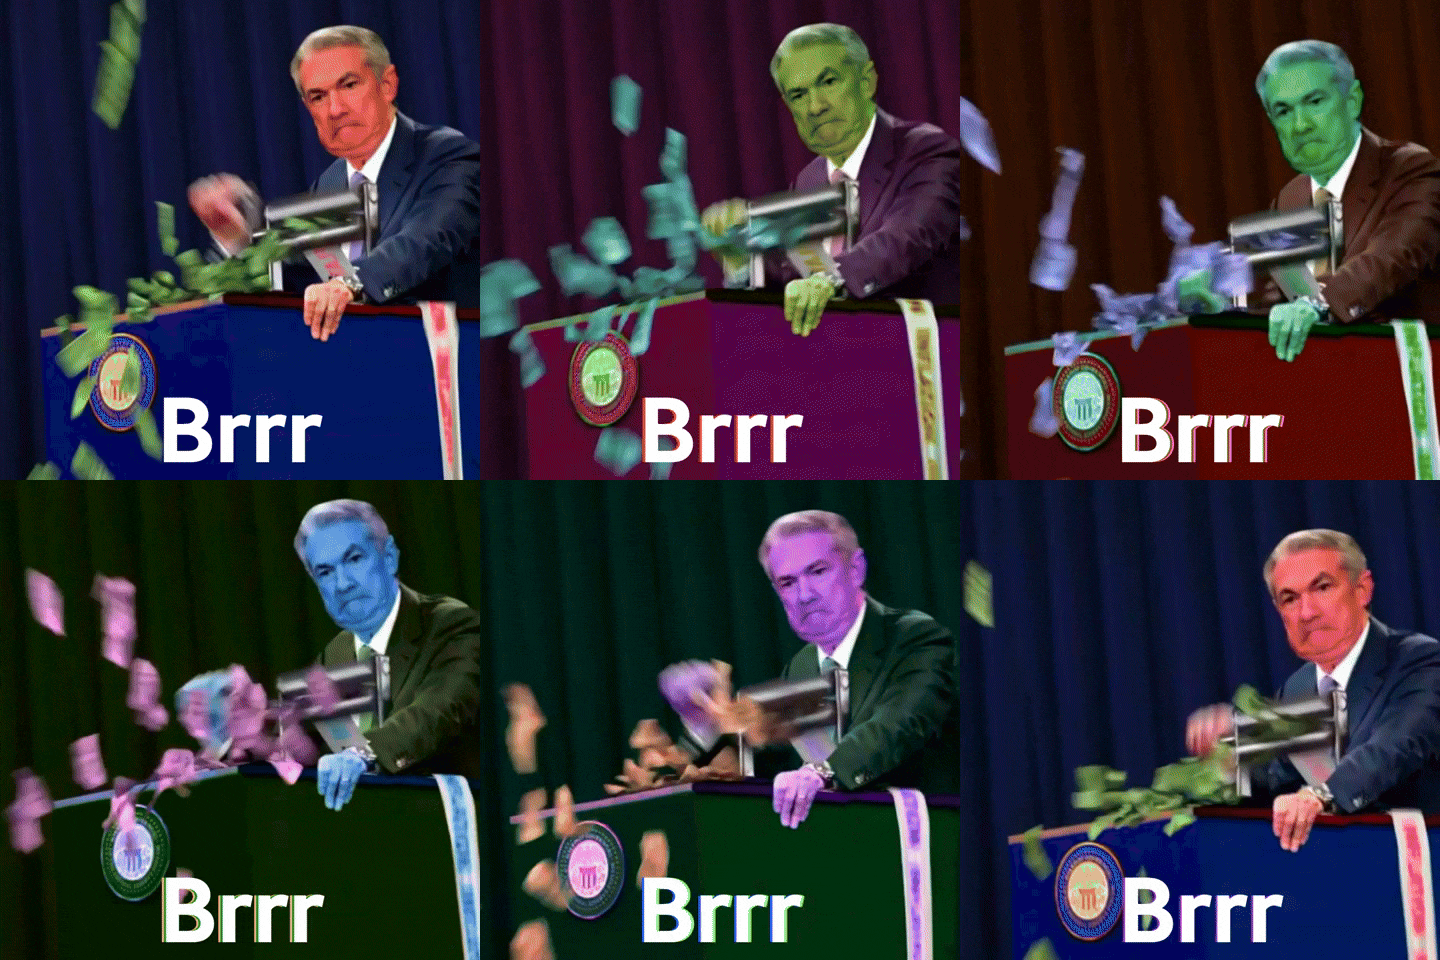
Including Existing Home Sales Active listings in the first chart, we see The Federal Reserve continuing to pump money at at 13.11% clip while active inventory is at an all-time low.
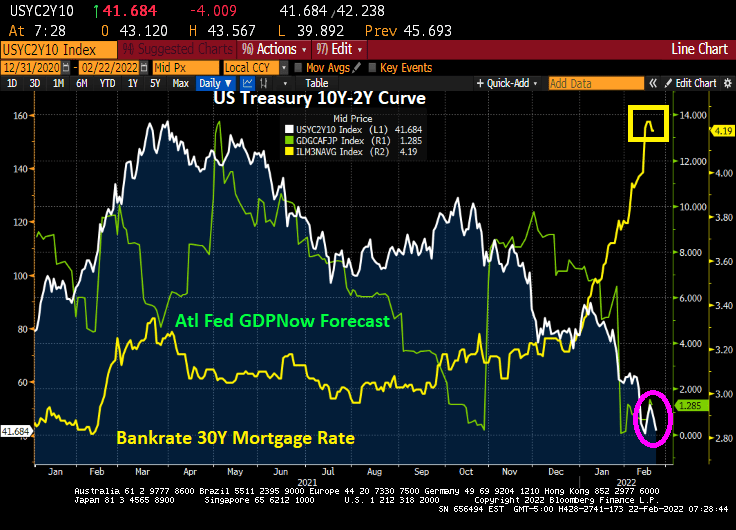
As US/Russian tensions grow over Ukraine, The Federal Reserve may be forced to postpone or reduce planned rate increases and balance sheet trimming.
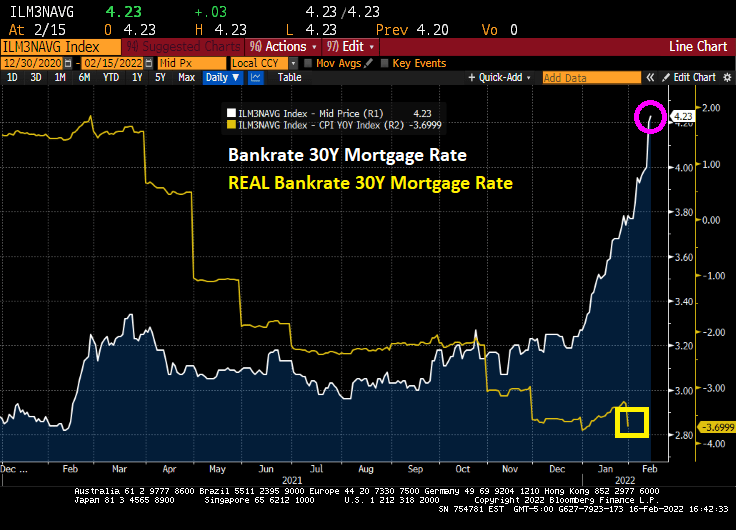
But in addition, we see US GDP slowing to near zero (1.285%) as the US Treasury 10Y-2Y yield curve has flattened to 41.684 BPS. The good news? Bankrate’s 30Y mortgage rate increases have slowed to 4.19%.
On a different note, I noticed the Chicago Bulls logo when turned upside-down looks like a space alien violating a crab.
In January 2020, just prior to the COVID outbreak in the US, the Case-Shiller national home price index was growing at 4% YoY, the Zilliow rent index (all homes) was growing at 2.92% YoY and REAL average hourly earnings were growing at 0.52% YoY.
Then COVID struck and the Federal government dumped trillions of dollars of stimulus into the economy and The Federal Reserve massively expanded its balance sheet. Now the US has home prices growing at a 18.8% rate, rents (for those who can’t afford to purchase a home) growing at 14.91% and REAL hourly earnings growing at -1.80%.
The site Apartment List has an even bleaker view of rent growth, with rents in January 2022 having grown by 18% YoY.
Now that COVID is fading, we see New York City rents growing at 33.5% YoY followed by Florida and Arizona cities at 29.3% and higher rates. Irvine CA is seventh at 28%. The slowest growing city is Oakland, CA is growing at only 0.5%.
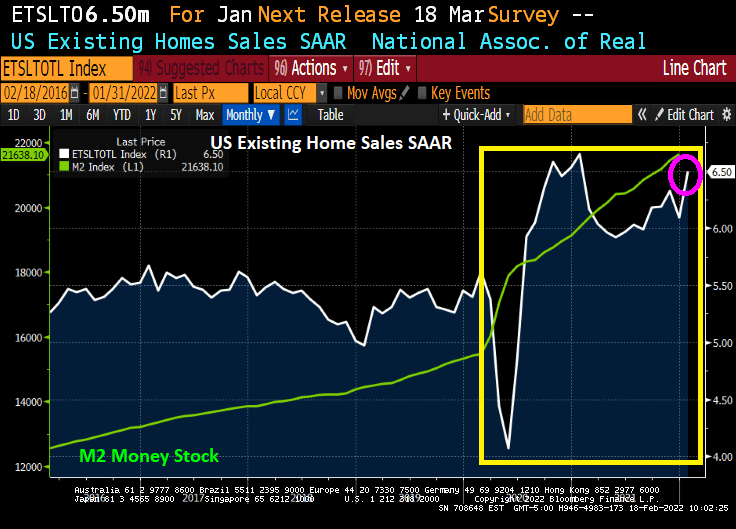
Surprise! US existing home sales in January rose to 6.50 million units SAAR versus the expected 6.10 million units. That is a 6.7% increase over December.
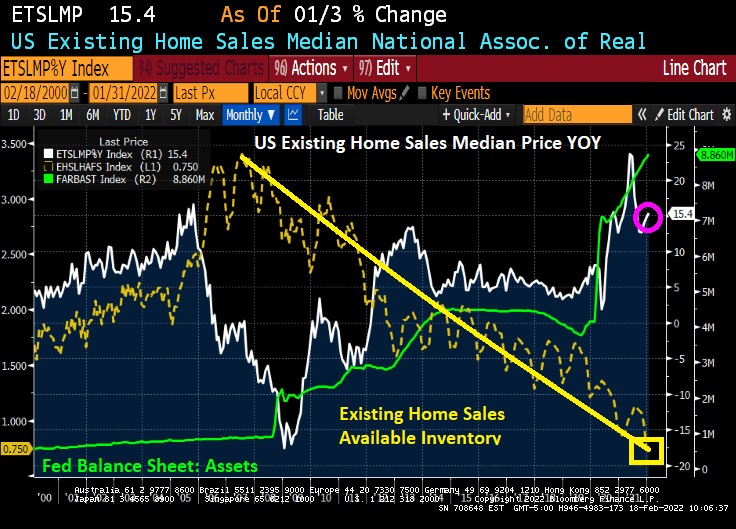
The disturbing news is the continued lack of available inventory that peaked in Q4 2007 and has continued its decline to today … the lowest level of available inventory since 1981. Despite the Fed’s massive stimulus that they allegedly will take away. Median price of existing home sales rose to 15.4% YoY. Making homes affordable should NOT be a slogan for The Federal Reserve, the Biden Administration or Congress.
The massive Federal stimulypto (fiscal and monetary) has helped push existing home sales to 6.50 million units SAAR in January. What will happen after The Fed withdraws it stimulus??
What is surprising is that with declining REAL wage growth, we saw a surge in home buying in January.
If The Fed does its expected “shock and awe” (or shock and awful), it will be more than the stock markets will crash. The housing market could crash too.
Take the current US housing situation with its limited inventory of listings combined with massive Fed stimulypto.
US 1-unit housing starts are down -4.1% in January. But heck, it is January! But on a year-over-year basis, 1-unit housing starts are down -2.4%. But what will happen if The Fed ACTUALLY withdraws its gargantuan monetary stimulus (green line)?
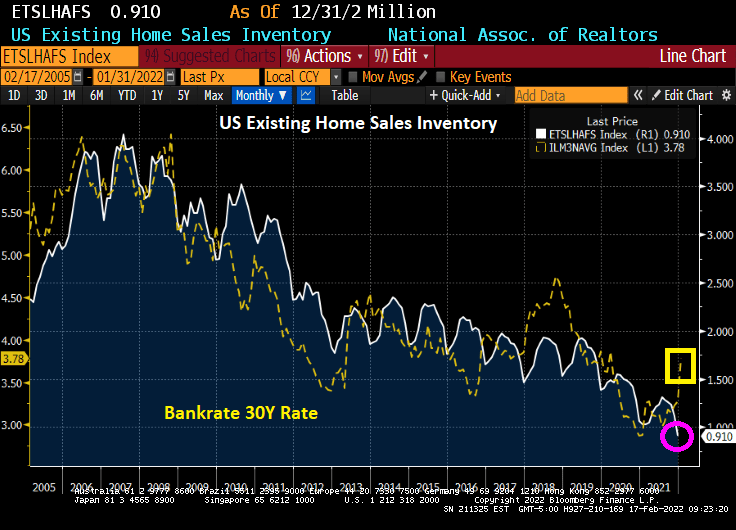
Existing home sales inventory continues to decline as Bankrate’s 30-year mortgage rate starts to climb with expectations of Fed “Shock and Awful.”
Say hello to The Federal Reserve Board of Governors!
Jay “The Revelator” Powell has told us in The Fed minutes that The Fed is ready to raise rates and shrink the balance “soon.” Sort of like saying “Shock and Awe” is coming.
Another effect of The Federal Reserve’s reckless monetary policy coupled with Biden/Congress reckless spending is bad foreign policy. The US is exporting inflation around the globe.
US export price YoY is at 15.1%. The US is importing less inflation at 10.8% YoY.
Here is the export/import stack.
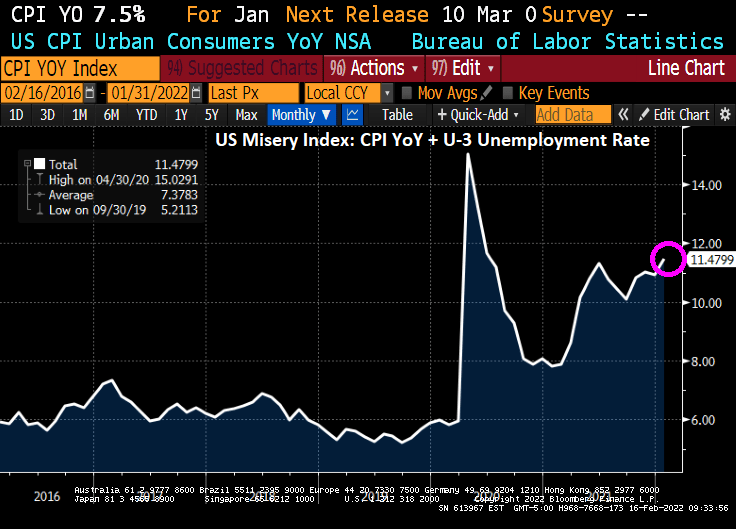
Things are not well in the US either. The misery index keeps rising under Biden’s Reign of Error.


















You must be logged in to post a comment.