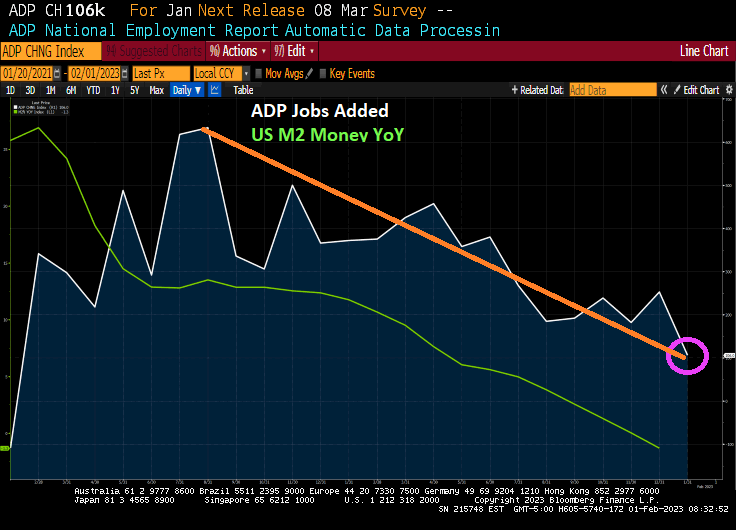
The US economy is slowing down. In fact, ADP jobs added just printed at 106k in January, the lowest reading since August 2021. ADP jobs added follows the slow down of M2 Money growth YoY as The Fed tightens its monetary policy.
Do I detect a trend (orange line)?
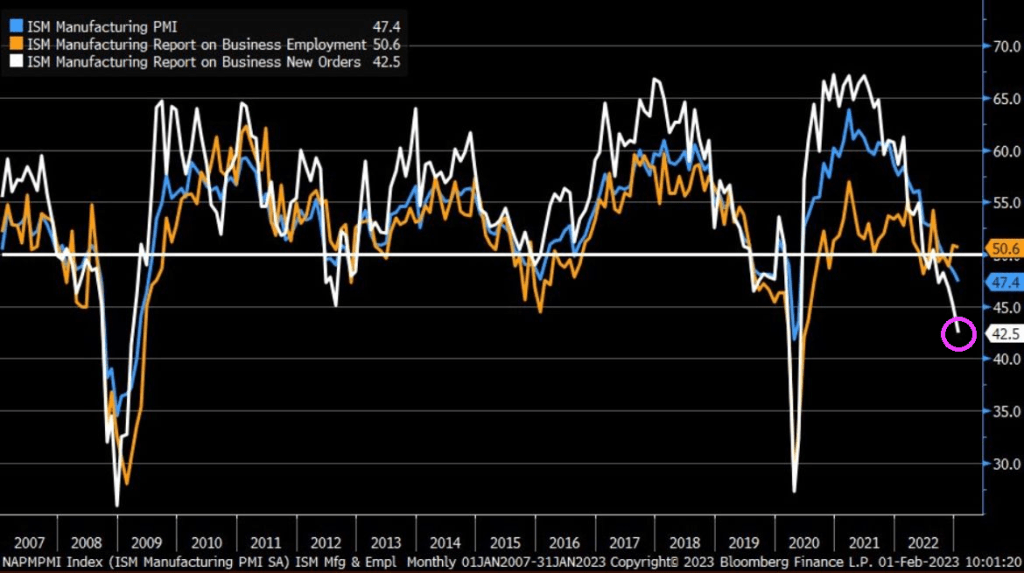
Speaking of trends, check out ISM Manufacturing New Orders. Lowest since Great Recession of 2008 (if I exclude the government economic shutdown Covid recession).
I doubt that January’s ADP report or the ISM Manufacturing report will be mentioned in Biden’s State of the Union address.
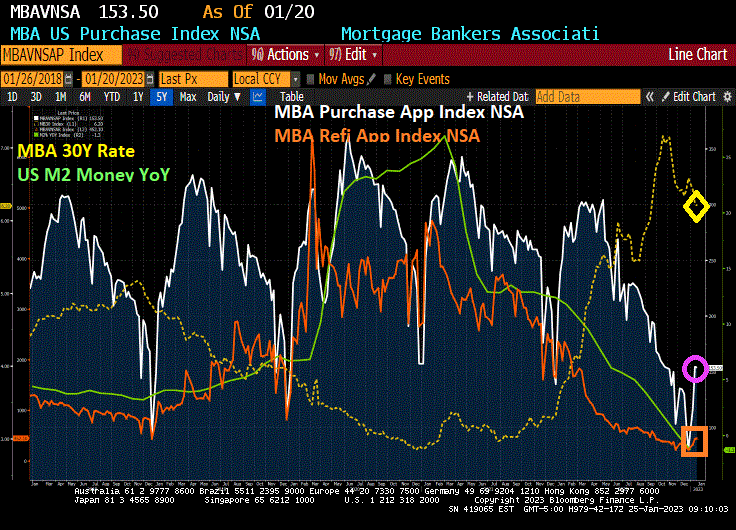
The January mortgage applications book is closed. And we are off to another year of rising applications until May. Then the downhill slide.
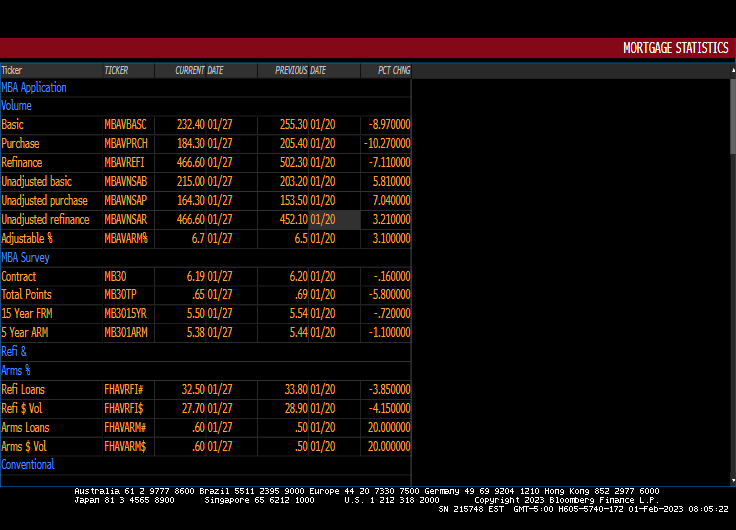
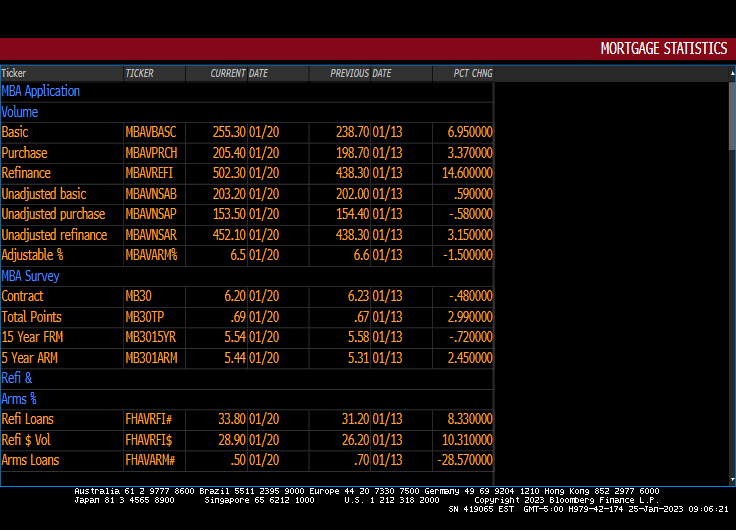
Mortgage applications decreased 9.0 percent from one week earlier, according to data from the Mortgage Bankers Association’s (MBA) Weekly Mortgage Applications Survey for the week ending January 27, 2023.
The Refinance Index decreased 7 percent from the previous week and was 80 percent lower than the same week one year ago. The seasonally adjusted Purchase Index decreased 10 percent from one week earlier. The unadjusted Purchase Index increased 7 percent compared with the previous week and was 41 percent lower than the same week one year ago.
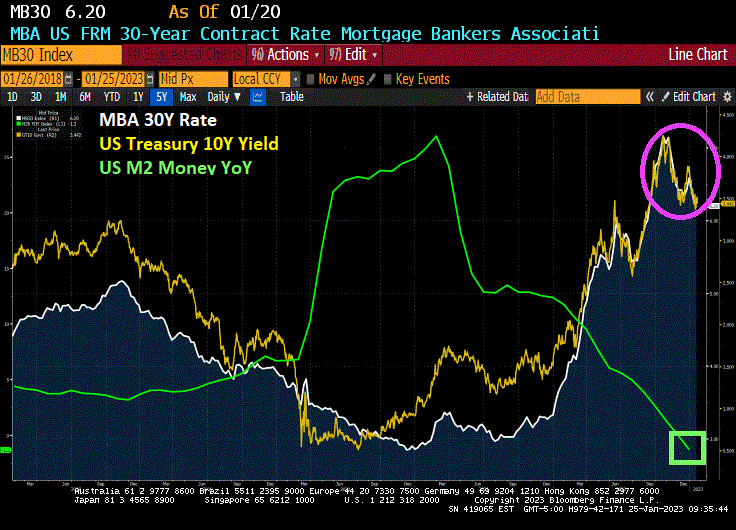
US mortgage rates have been steadily declining since November 2022.
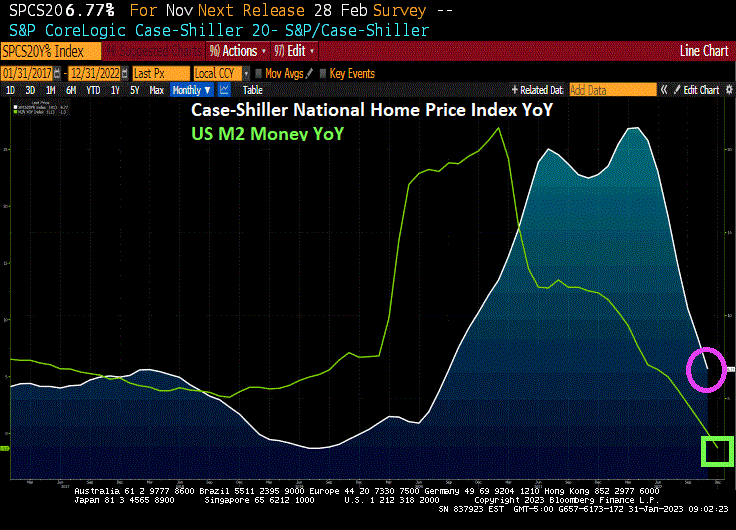
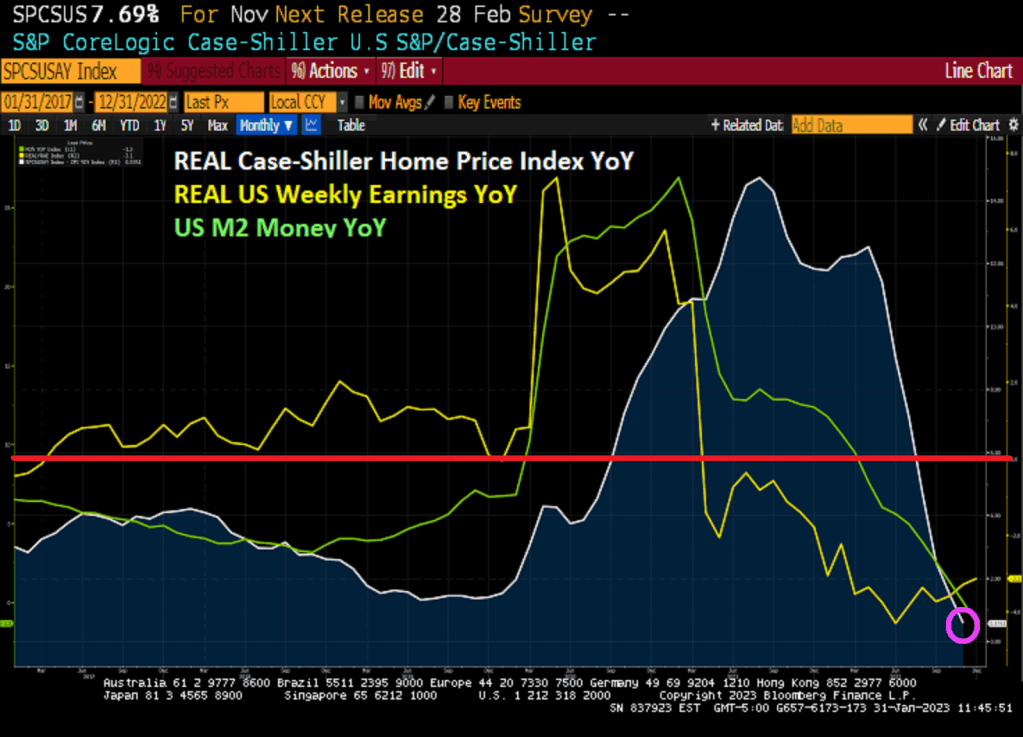
On a year-over-year (YoY) basis, the Case-Shiller National home price index slowed to 6.77%. On a month-over-month (MoM) basis, the CS National index fell -0.54%. That is the 5th straight month of home price declines.
In REAL terms, the Case-Shiller National home price index is up only 0.58% YoY as REAL Weekly Earnings growth is negative at -3.1% YoY.
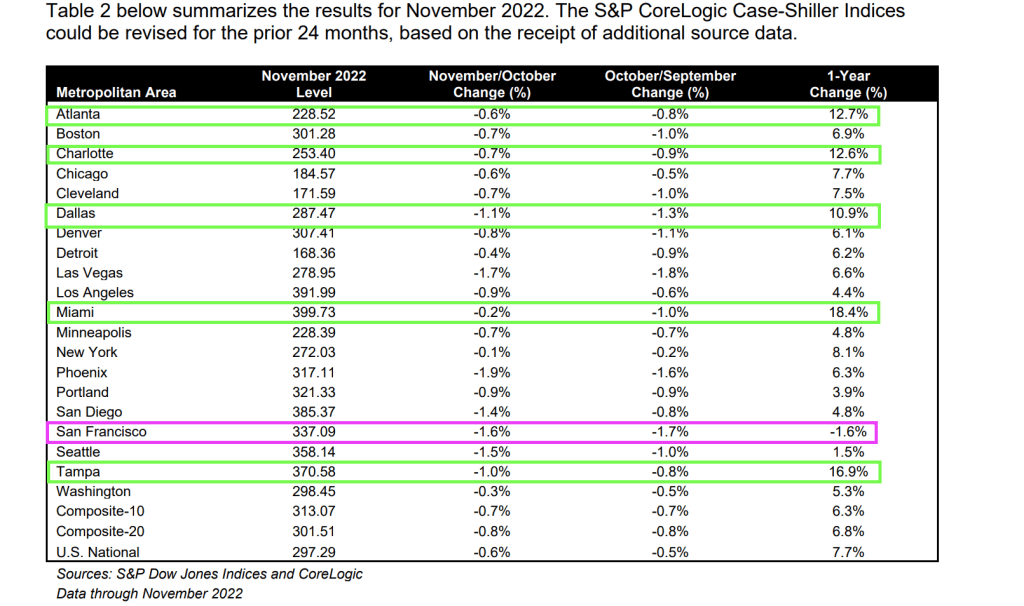
Only San Francisco fell on a YoY basis (down -1.6%). Five metro areas were above 10% and they are all in the South. Atlanta, Charlotte. Dallas, Miami and Tampa.
On MoM basis, every metro area in the Case-Shiller 20 index saw price declines from October to November.
Welcome to the wonderful world of Bidenomics, giving the US 40 year highs in inflation leading The Federal Reserve to remove its enormous monetary stimulus (known as “The Punch Bowl.”
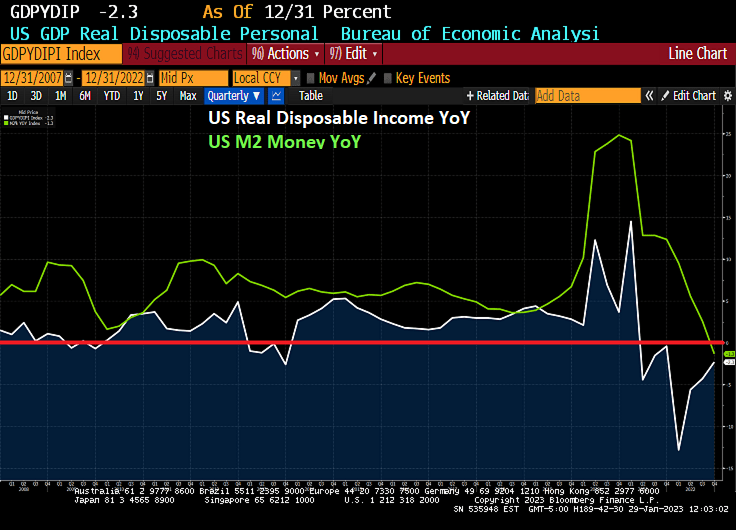
I previously pointed out that US Real GDP was actually less than 1% year-over-year (YoY) in 2022, hardly a fantastic number given the trillions in Biden/Pelosi/Schumer spending (Omnibus, Infrastructure, etc) and Powell/Fed’s whopping monetary stimulus in 2020. But real disposable income, the amount households have left to spend after adjusting for inflation, had been falling for 7 straight months.
In fact, REAL disposable personal income peaked in March 2021, shortly after Biden was sworn-in as President in Janaury 2021 at $19,213.9 billion (or $19.214 TRILLION). As of December 2022, real personal disposable income had fallen to $15,213.0 or $15.213 TRILLION. That is a loss of $4 TRILLION since March 2021. Or a -21% Loss in Real Disposable Income.
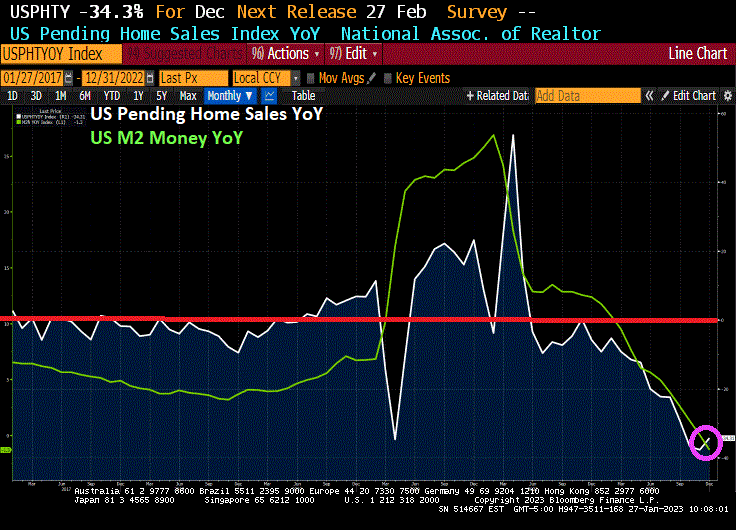
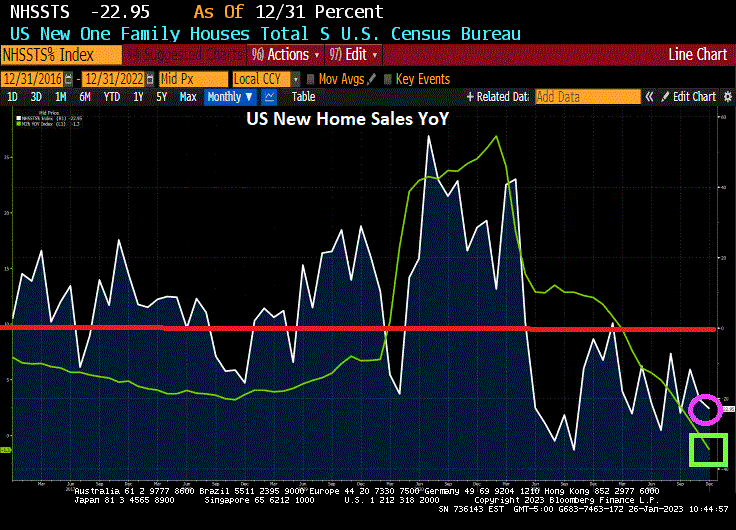
The US housing market continues to struggle as The Federal Reserve continues to fight inflation. Today’s pending home sales are another nail in housing casket.
Pending home sales declined -34.4% year-over-year (YoY) as M2 Money growth went negative (-1.3% YoY).
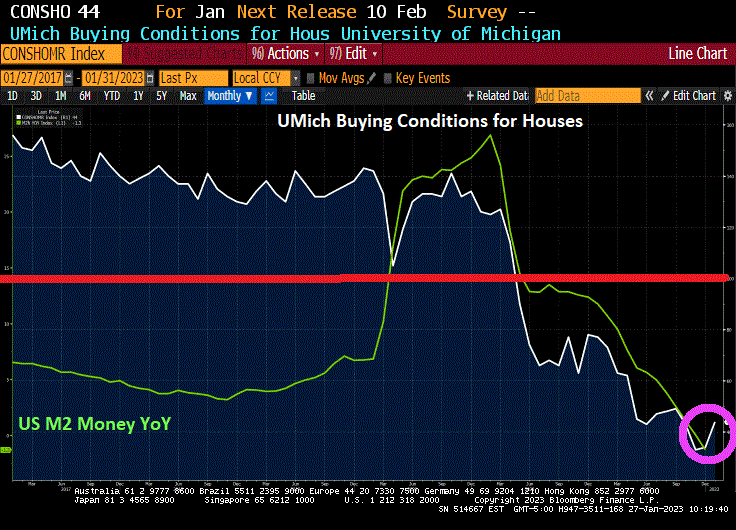
At least UMich buying conditions for housing increased … to 44, well below 100.
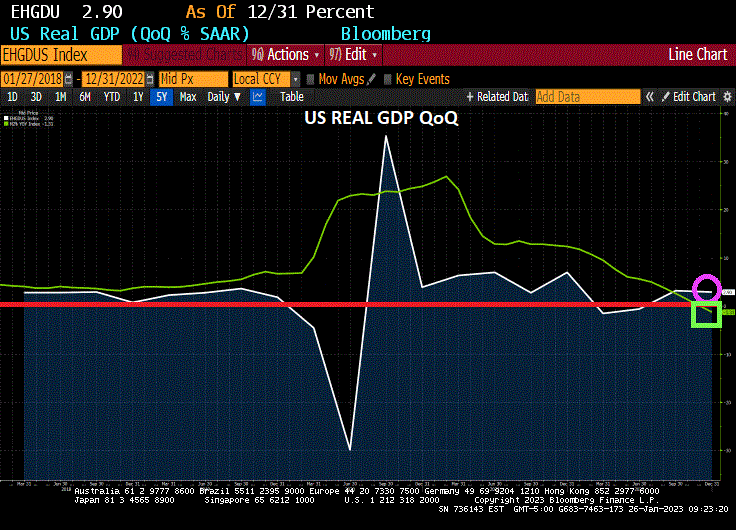
Today’s GDP report from the BEA reminds me of the Peggy Lee song “Is That All There Is?” Between the massive Fed monetary stimulus since late 2008 (and particularly since Covid in 2020) and all the Federal spending (Covid relief, Inflation reduction, Omnipork spending bill, etc.), US real GDP rose by only 2.9% in Q4 from Q3.
But signs of slowing underlying demand mounted as the steepest interest-rate hikes in decades threaten growth this year.
Gross domestic product increased at a 2.9% annualized rate in final three months of 2022 after a 3.2% gain in the third quarter, the Commerce Department’s initial estimate showed Thursday.
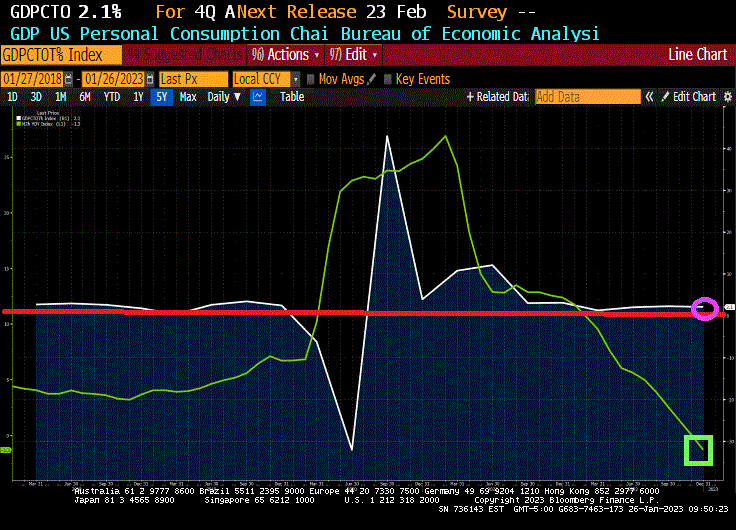
Personal consumption, the biggest part of the economy, climbed at a below-forecast 2.1% pace (forecast was for 2.9%). Again,
The report also showed some signs of stress for American consumers whose wages have failed to keep up with inflation and continued to encourage them to draw down savings accumulated from government pandemic-relief programs. The burden of elevated prices and higher borrowing costs is mounting, pointing to a tenuous outlook for the economy.
A key gauge of underlying demand that strips out the trade and inventories components — inflation-adjusted final sales to domestic purchasers — rose an annualized 0.8% in the fourth quarter after a 1.5% gain.
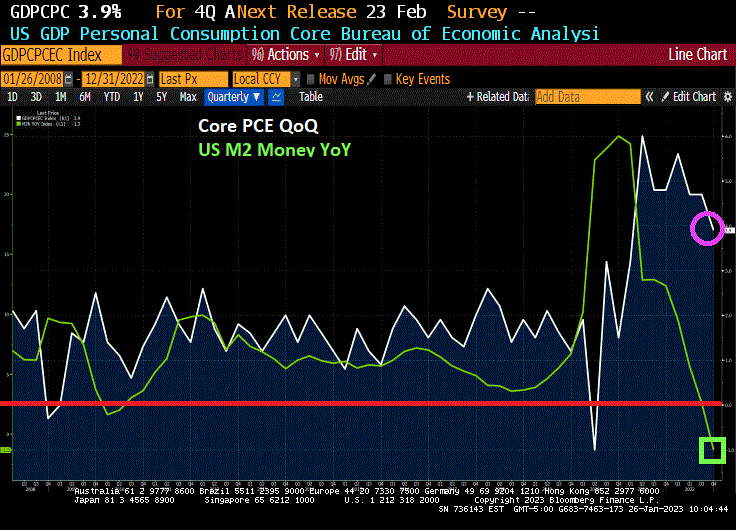
Core PCE growth grew at 3.9%, but is slowing already as M2 Money growth dies.
Stock-index futures and Treasury yields remained higher and the dollar was little changed after the GDP report and better-than-expected weekly jobless claims. Applications for unemployment insurance dropped to 186,000 last week, the lowest since April.
Recent data show cracks are developing more broadly. Retail and motor vehicle sales data showed households are starting to retrench, the housing market continues to weaken and some businesses are reconsidering capital spending plans.
As the Federal Reserve continues to hike interest rates to ensure inflation is extinguished, housing and manufacturing have deteriorated quickly while industries including banking and technology are carrying out mass layoffs.
The GDP report showed the personal consumption expenditures price index, a key inflation metric for the Fed, rose at an annualized 3.2% rate in the fourth quarter, down from a 4.3% pace in the prior three months. The core index that excludes food and energy climbed at a 3.9% rate compared with 4.7% paces in the prior two quarters. Monthly data for December will be released Friday.
The moderation in price pressures is consistent with forecasts that the Fed will further scale back its tightening campaign next week, when it’s expected to raise rates by 25 basis points. Policymakers boosted the benchmark rate by 50 points in December after 75 basis-point hikes at their previous four meetings.
The world’s largest economy expanded 2.1% last year. In 2021, when demand snapped back from pandemic-related shutdowns, the economy grew 5.9% — the best performance since 1984.
The GDP data showed services spending increased at 2.6% annualized rate in the October-December period, the slowest since last year’s first quarter. Outlays on goods rose at a 1.1% pace, the first advance since 2021.
Business investment slowed sharply after a third-quarter surge. Spending on equipment declined an annualized 3.7%, the most since the second quarter of 2020. Outlays for structures rose at a 0.4% pace.
Let’s hope the BEA isn’t padding the numbers like the BLS was caught doing in the first half of 2022.
Lastly, US Real GDP growth YoY FELL to only 0.95925% as M2 Money growth disappears.
Falling mortgage rates are having a predictible effect on mortgage refinancing applications, but not so much for mortgage purchase applications.
Mortgage applications increased 7.0 percent from one week earlier, according to data from the Mortgage Bankers Association’s (MBA) Weekly Mortgage Applications Survey for the week ending January 20, 2023. This week’s results include an adjustment for the observance of Martin Luther King, Jr. Day.
The Refinance Index increased 3.15 percent from the previous week and was 77 percent lower than the same week one year ago.The unadjusted Purchase Index decreased 1 percent compared with the previous week and was 39 percent lower than the same week one year ago.
Generally speaking, declining mortgage rates are due to declining 10-year Treasury yields. And 10-year Treasury yields decline as the economy weakens. Of course, M2 Money growth YoY is now 0% as The Fed tightens.
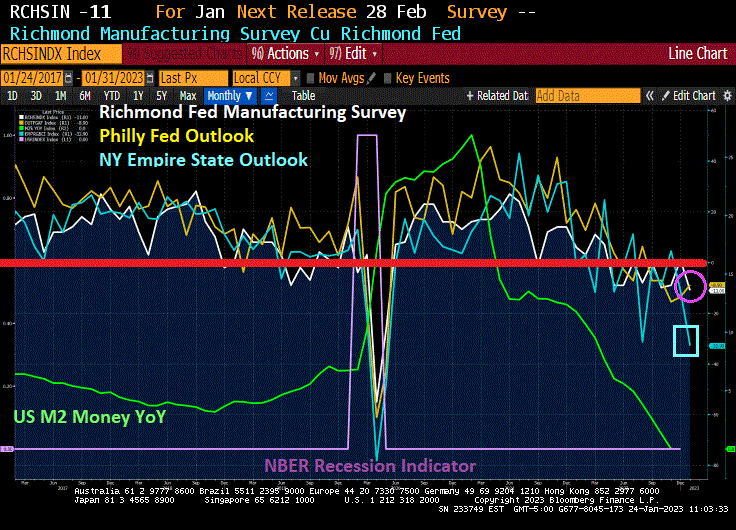
Three regional Fed reports I like to watch are New York’s Empire State Outlook, Philly Fed’s Outlook and Richmond Fed’s outlook. Today, The Richmond Fed released their manufacturing outlook and … it declined to -11.
So the big three are all down (Philly down to -8.9 while NY’s Empire State outlook is down to -32.9.
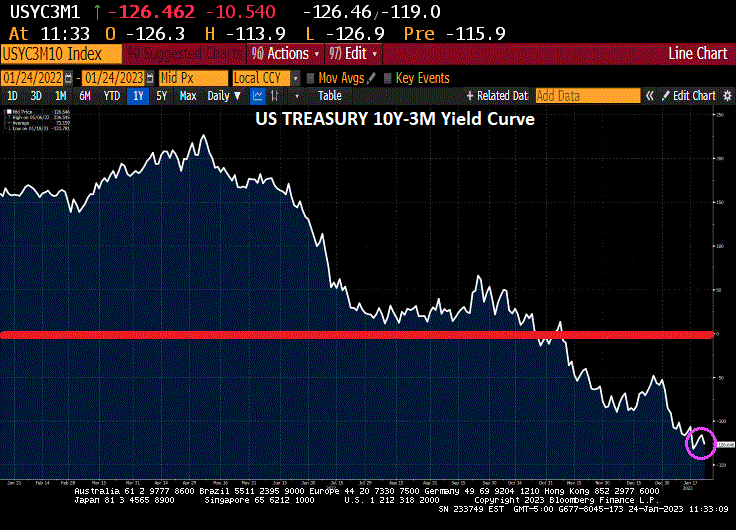
On the Treasury front, the US 10Y-3M yield curve inverted further (a signal of impending recession) just tanked to -126.462 basis points.
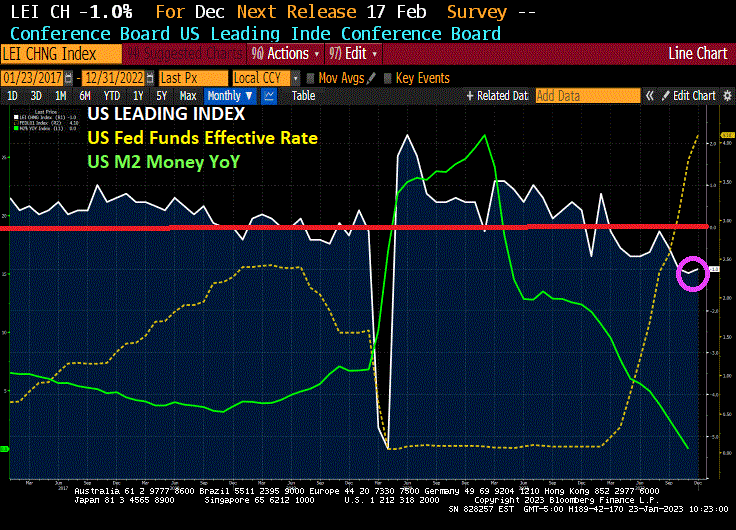
The Conference Board’s Leading Indicator should be called The Bleeding Indicator given that the leading index has declined to 10 straight months. This is happening as The Fed tightens monetary policy to combat inflation.
Leading indicators include economic variables that tend to move before changes in the overall economy. These indicators give a sense of the future state of an economy.


You must be logged in to post a comment.