Gimme (Expensive) Shelter! Headline CPI Hotter Than Expected, Core Remains Above 4.00% (Rent inflation 7.41%!)

Gimme (expensive) shelter!

Following August’s bigger than expected jump  (driven by surging energy prices and healthcare methodology changes)., September’s CPI was expected to slow (+0.3% MoM) with the YoY pace inching back lower (from 3.7% to 3.6%) after rebounding for two straight months.

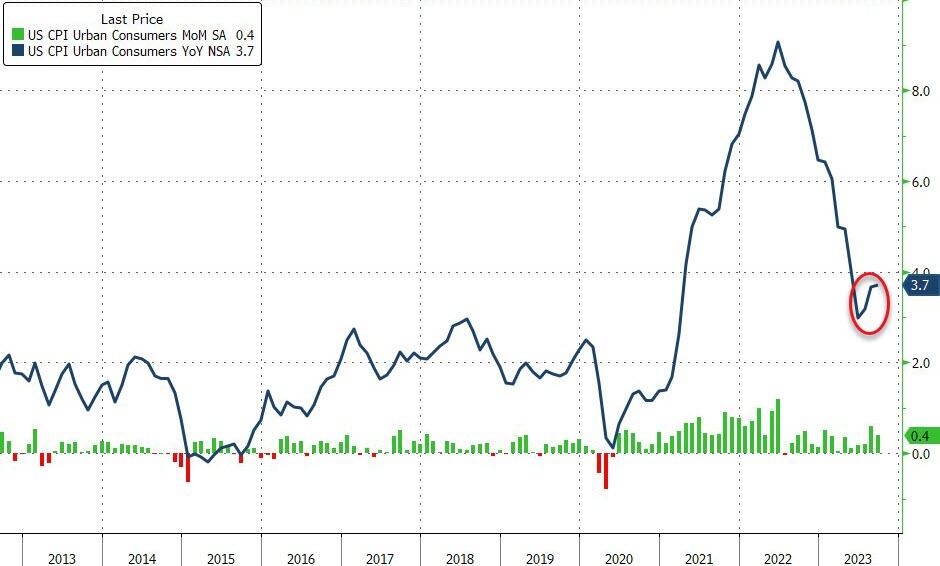
However, headline CPI came in modestly hot at +0.4%, with YoY at 3.7% – that is the 3rd monthly rebound in a row.
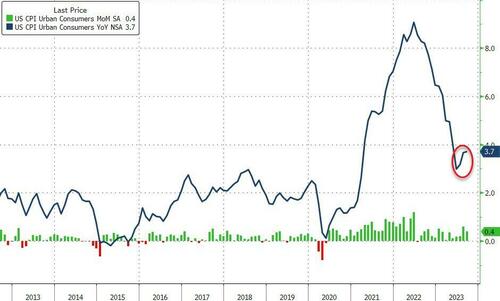
Source: Bloomberg

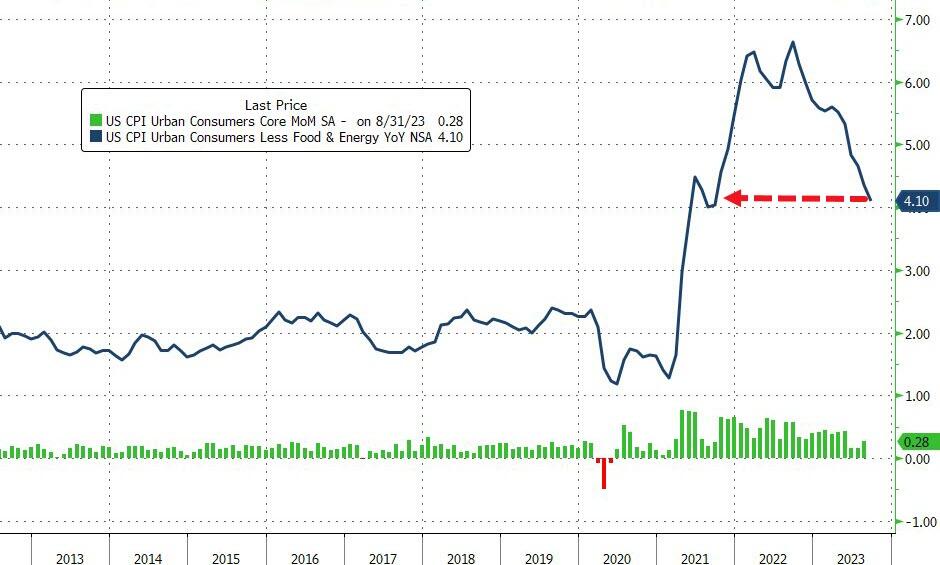
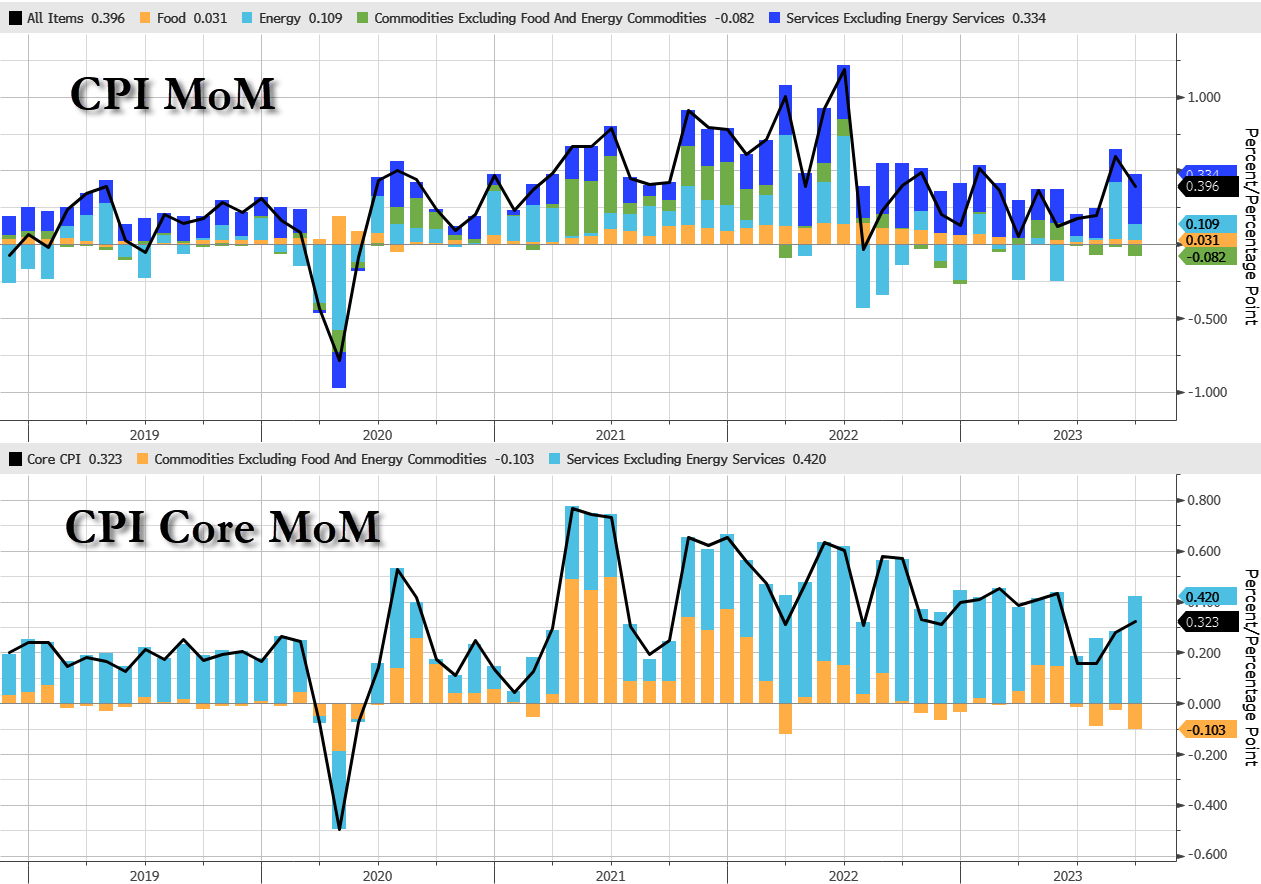
Core CPI rose 0.3% MoM, with YoY sliding to +4.1% YoY (as expected)… it still hasnt been below 4.00% since May 2021….
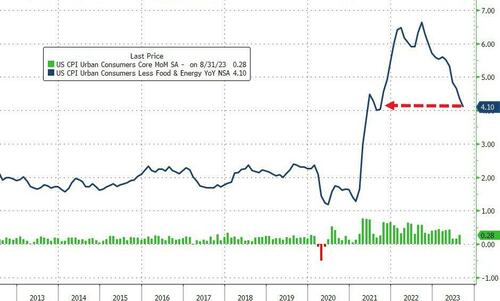
Source: Bloomberg

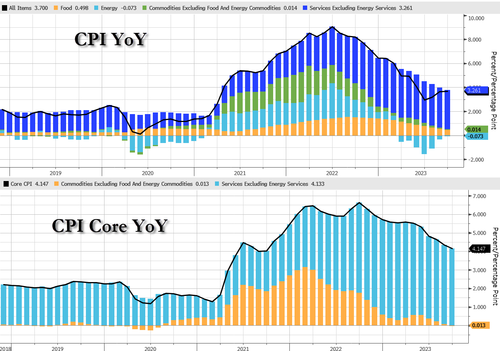
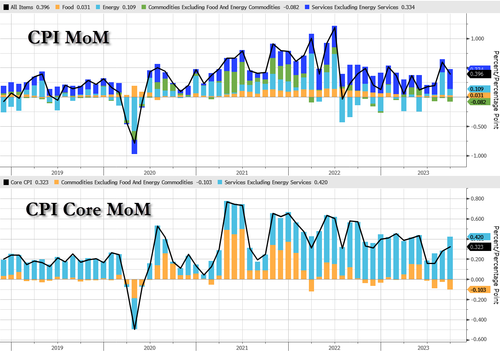
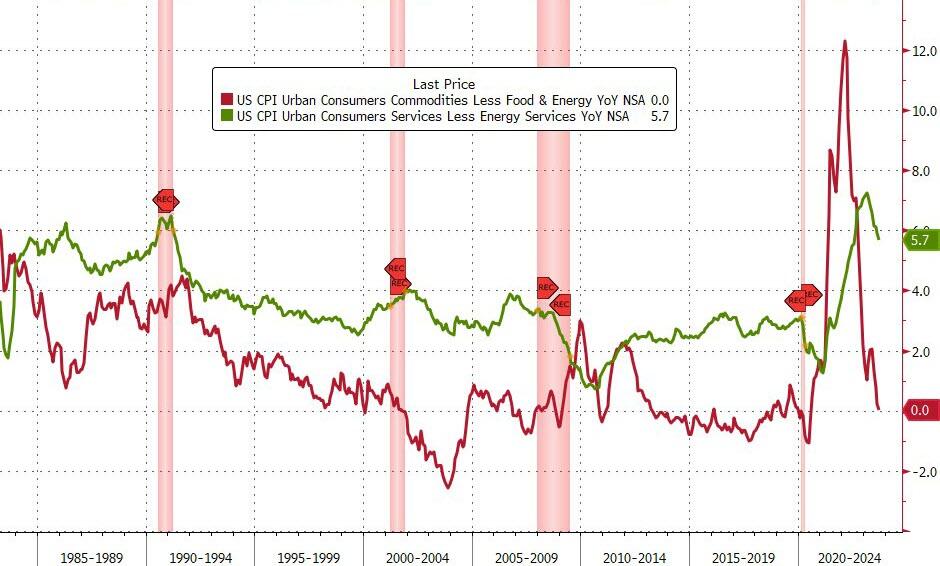
Food and Commodities contribution to YoY CPI slowed while Services increased…

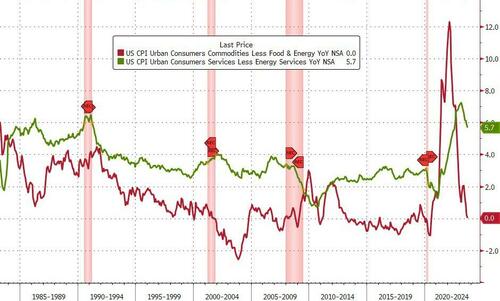
Goods inflation dipped back to unchanged YoY and Services CPI slowed to +5.7%…

Services stands out on A MoM basis…

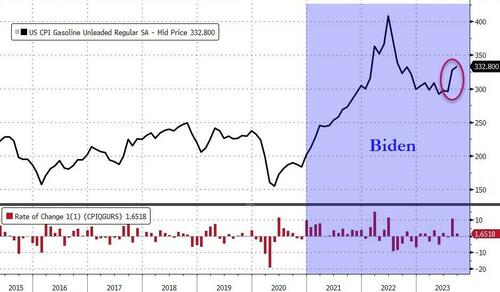
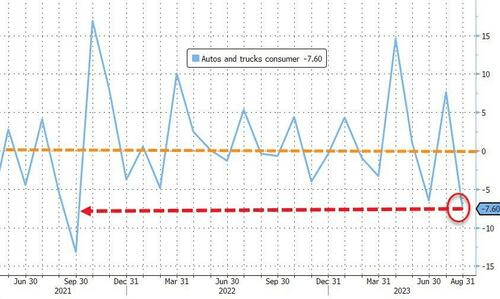
Under the hood, gasoline continues to rise and used car prices drop…

Rent of primary residence and owner’s equivalent rent YoY both exceeeded 7%. Fixing a car/truck rose 10.2% (will people start to notice that repairing EVs is outrageously expensive?).

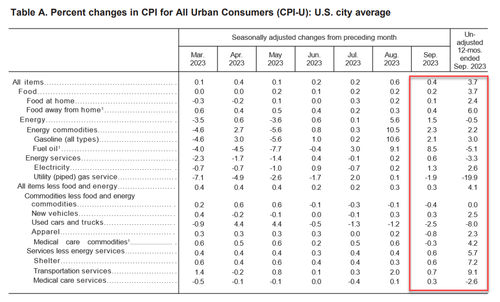
The index for all items less food and energy rose 0.3 percent in September, as it did in August.

  • The shelter index was the largest factor in the monthly increase in the index for all items less food and energy.
  • The shelter index increased 0.6 percent in September, after rising 0.3 percent the previous month. The index for rent rose 0.5 percent in September, and the index for owners’ equivalent rent increased 0.6 percent over the month.
  • The lodging away from home index increased 3.7 percent in September, ending a string of 3 consecutive monthly decreases.
  • Among the other indexes that rose in September was the index for motor vehicle insurance, which increased 1.3 percent after rising 2.4 percent the preceding month.
  • The indexes for recreation, personal care, new vehicles, and household furnishings and operations also increased in September.
  • The medical care index rose 0.2 percent in September, as it did in August.
  • The index for hospital services increased 1.5 percent over the month, and the index for physicians’ services was unchanged.
  • The prescription drugs index fell 0.7 percent in September.
  • The index for used cars and trucks fell 2.5 percent in September, after decreasing 1.2 percent in August.
  • The apparel index declined 0.8 percent over the month, and the communication index was unchanged.

The index for all items less food and energy rose 4.1 percent over the past 12 months.

  • The shelter index increased 7.2 percent over the last year, accounting for over 70% of the total increase in all items less food and energy.
  • Other indexes with notable increases over the last year include motor vehicle insurance (+18.9 percent), recreation (+3.9 percent), personal care (+6.1 percent), and new vehicles (+2.5 percent).

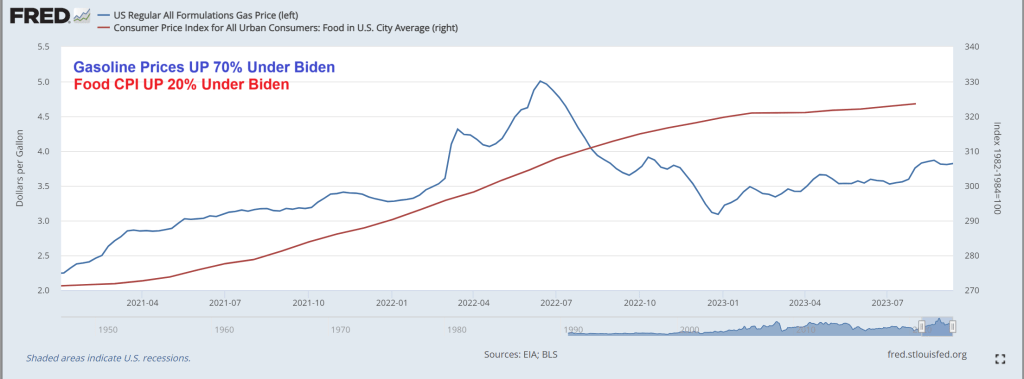
Gasoline prices continue to rise…

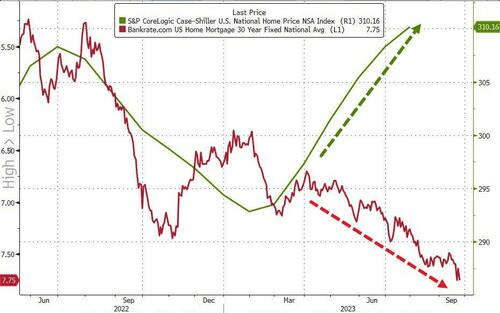
Shelter costs are slowing, but accounted for the largest part of core CPI…

  • Rent inflation 7.41%, down from 7.76% in August and the lowest since Sept 2022
  • Shelter inflation 7.15%, down from 7.27% in August and the lowest since Nov 2022

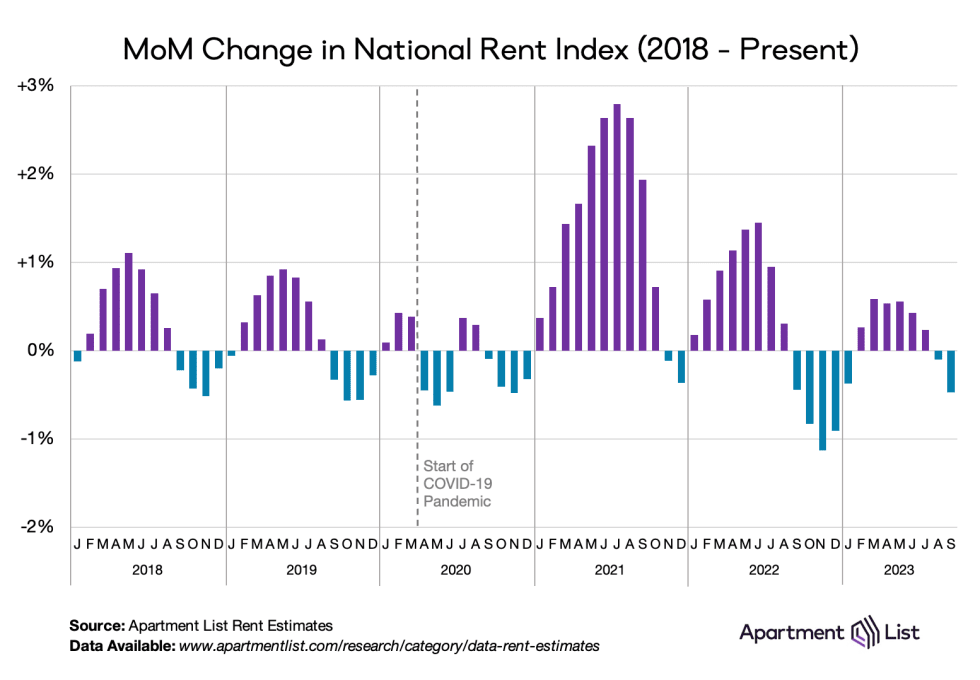
Bear in mind that while CPI very stale data is rising over 7%,  real-time rent indicators are in freefall. Apt List’s Sept rent drop was the biggest on record…

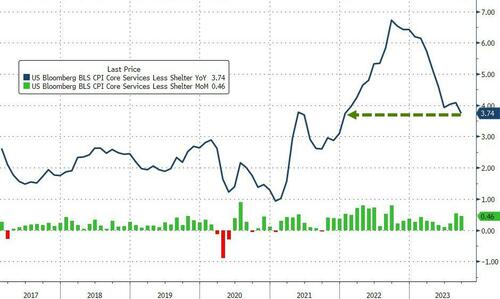
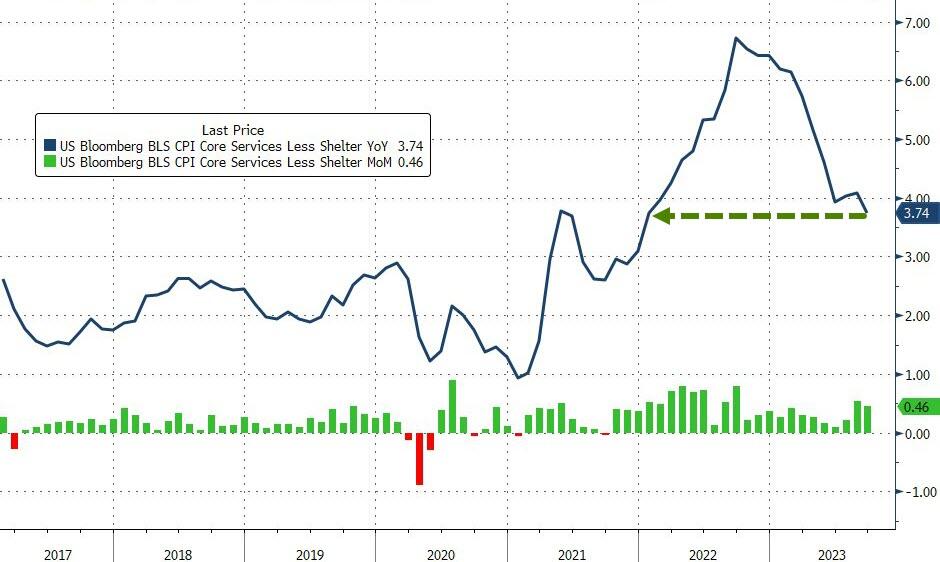
And perhaps most importantly, one silver lining is that The Fed’s new favorite inflation signal – Core Services CPI Ex-Shelter YoY slowed to +3.74% (despite jumping 0.46% MoM). That is the lowest YoY since Dec 2021…

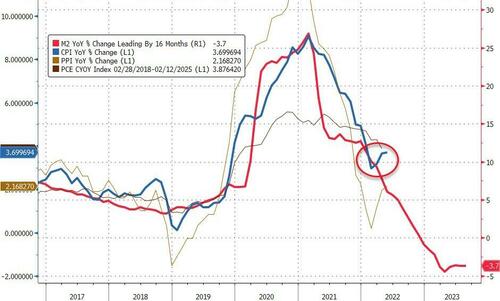
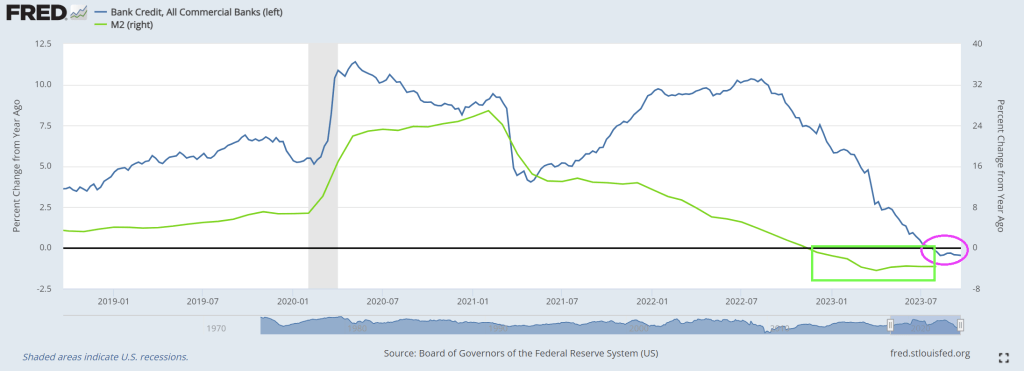
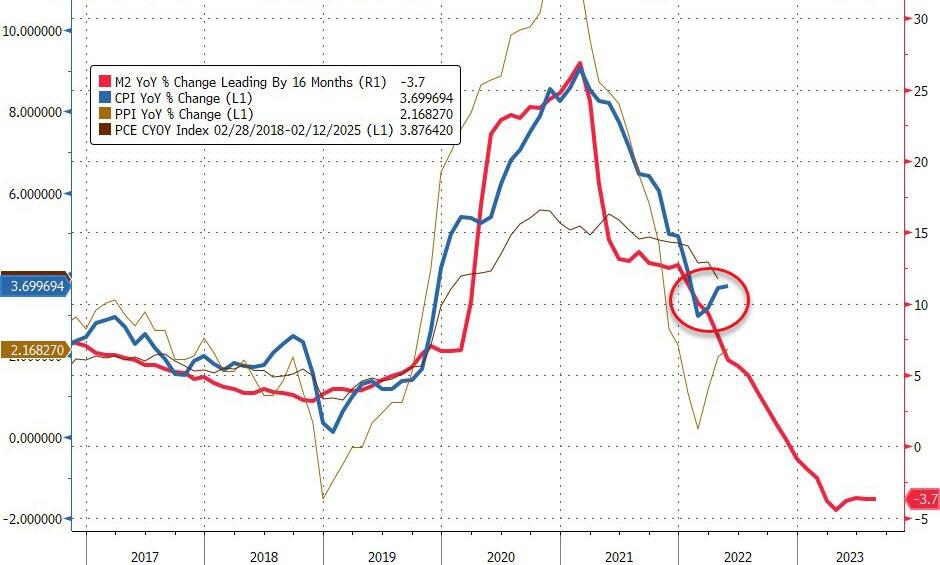
Is this third straight monthly increase in CPI YoY an inflection point? Or is M2 still leading the trend?

Turning from the cost of things to the ability to pay, “real” wages contracted 0.1% YoY (after 3 months positive)…

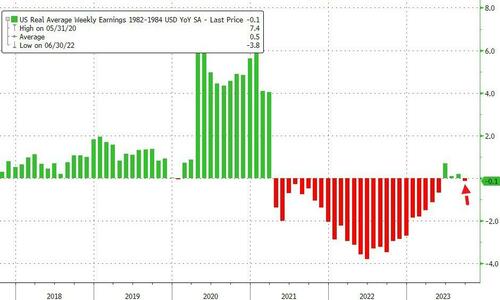
This is not the soft-landing cruise lower in inflation that the market (and The Fed) was hoping for…

Bidenomics Is Working? Economic Outlook Index Plunges To Record Low In IBD/TIPP Poll (Net Savings As % Of Gross National Income Negative For 2nd Straight Quarter)

As Biden sleeps through the Hamas invasion of Israel, that is nothing new. Biden is sleeping through a disastrous downturn in the economy and pretending that Bidenomics is working. It isn’t Joe!

The IBD/TIPP U.S. Economic Optimism Index sank to a 12-year low in October as confidence in the near-term economic outlook crashed to the lowest level in the poll’s history. The survey casts doubt on the Federal Reserve’s justification for turning more hawkish last month: robust consumer spending.

The overall IBD/TIPP U.S. Economic Optimism Index dived 6.9 points to 36.3, the lowest since August 2011. Readings below the neutral 50 level reflect pessimism. The 6-month economic outlook index cratered 9.6 points to 28.7, a record low since the IBD/TIPP Poll began in early 2001.

That means the outlook suddenly appears worse than it was at the depths of the dot-com crash, the great financial crisis and the coronavirus pandemic.

And on the personal savings front, net savings as a percentage of gross national income was negative for the second straight quarter.

Sleepy Joe, wake up! The US economy is slowing down REALLY fast!

The Consumer Just Crashed! Credit Card Spending Unexpectedly Cratered In September At -10.8% While Bank Credit Growth Goes Negative For 9th Straight Week

Coping with inflation caused by Federal spending (and excessive Fed stimulus) is difficult and eventually consumer max out their credit cards. Like now!

Credit card useage nosedived by -10.8% in September, according to Citi. This is the fifth straight month of spending decleration.

Leading the decline was electronics. The leader on the positive sign was … jewelry?? Hey, I thought mobs of people were robbing stores because they were hungry!!

In terms of bank credit, rising rates to fight inflation, bank credit growth Bank credit growth has been negative for nine straigth weeks.

Then we have unrealized losses on bank balance sheets, expected to surge to $700 billion with soaring interest rates.

On a different note, Homeland “Security” head Mayorkas now claims the US has to build a wall to combat the out-of-control immigration on the southern border. Wait! I thought Mayorkas and Congressional members (angrily) claim the border was secure! It doesn’t matter, Mayorkas is simply signalling to blue states that he will build a wall. But how fast is a different question.

Here is a video of tHe Biden Administration arranging for the border wall to be consructed. Mayorkas will likely call O’Reilly the builder to build the border wall.

US Excess Savings Depleted For Bottom 80% Of Households To Cope With Bidenomics (Home Affordability Hits All-time Low!)

Wasting away again with Bidenomics, code for massive Federal subsidies to green energy donors. And incentives to buy impractical EVs. Imagine in an emergency and your car only goes 200 miles (and then you have to wait for an available charger to come open). Well, the top 1% are doing fine. But the bottom 80% of households by income are seeing rapid deplection of savings to cope with the rising costs of Bidenomics.

And then we have shrinking home affordability, now at a record low.

Biden’s Idiocracy! Bank Credit Growth Slows To -0.5% YoY, Every Monthly Payrolls Print In 2023 Has Been Revised Lower (Bidenomics Is The Economic Mutilator!)

Mike Judge wrote and directed a masterpiece of cinema called “Idiocracy” where large corporations convince a progressive government to use Brawndo (a Gatorade clone) to grow vegetables resulting in a Dust Bowl. Why? Because the Progressive leadership determine that plants crave … electrolytes.

But the electrolytes in Bidenomics has resulted in bank credit growth of -0.5% YoY.

On the data front, it has become a running joke: the “strong” Bidenomics economy comes with an expiration date, as it is only “strong” for about a month, at which point the initial “strength” is downgraded, and the data is revised sharply lower.

That has certainly been the case with US labor data, where as we first reported last monthevery single monthly payrolls print in 2023 has been revised lower (see chart below), a 12-sigma probability and virtually impossible unless there was political pressure to massage the data higher initially and then revise it lower when nobody is looking.

But the BLS is not done: as we reported last week, besides the now traditional one-month lookback revisions the ridiculously high monthly payrolls prints accumulated over the past year will also be slowly but surely revised gradually lower at annual benchmark revisions for years to come. As Morgan Stanley chief US economist Ellen Zentner explained (full note available to pro subscribers)…

Payrolls get revised too, and we expect a downward revision. Payrolls have an annual benchmark revision that is published in February each year. The revision adjusts the level of payrolls through March of the prior year. For example, a new revision will be published in Feb-24, adjusting payroll levels from April-22 to Mar-23. And a preliminary estimation of the upcoming revision points to a decrease in payroll YoY% growth rates of -0.2pp.

But while downward payroll revisions under Bidenomics are as certain as death and taxes, what we wanted to discuss here are the just as striking downward revisions to US consumption which hit this morning alongside the comprehensive once every-five-years historical revisions to GDP. As a reminder:

Today’s release presents results from the comprehensive update of the National Economic Accounts (NEAs), which include the National Income and Product Accounts (NIPAs) and the Industry Economic Accounts (IEAs). The update includes revised statistics for GDP, GDP by industry, GDI, and their major components. Current-dollar measures of GDP and related components are revised from the first quarter of 2013 through the first quarter of 2023. GDI and selected income components are revised from the first quarter of 1979 through the first quarter of 2023.

Earlier today we already noted the disaster that was Q2 Personal Consumption: instead of the 1.7% unchanged print from the second estimate of Q2 GDP, the final number was a dire 0.8%, a 9-sigma miss to estimates…

… and the worst quarterly increase since the Covid collapse in Q2 2020.

But what about other historical data? After all today’s revision impacted all data from Q1 2013?  Therein, as the bard says, lies the rub.

Let’s start with personal consumption, and compare the latest post-revision current data (link) with the most comprehensive pre-revision data as of last month (link). It should come as no surprise to anyone that with the (slight) exception of just Q4 2022, personal consumption in every single quarter since the start of 2022 – when the Fed aggressively started tightening and hiked rates by the most since Volcker – has been revised lower, and in some cases dramatically so.

Bloomberg also picks up on the GDP revision and looking at revisions to the historical data, writes that “the pandemic contraction is seen as being a bit less severe than previously thought: GDP is now reckoned to have dropped at a 28% annual clip in the second quarter of 2020, instead by 29.9%, as the government shut down swathes of the economy to fight the spread of the virus. But the recovery since then has been somewhat slower, according to the update. Growth last year was revised to 1.9% from 2.1%.” And of all GDP components, consumption was the weakest.

So not only was the Fed hiking at a time when personal consumption would grow much less period to period than previously expected, but the US economy was generally weaker than previously expected (as discussed here).

There’s more.

When looking at the composition of the US household’s income statement – the summary of economic accounts – we find just what we had expected: US savings were in fact far lower than previously expected.

In the latest negative revision, US households saved $1.1 trillion less than previously thought over the past six years…

… and indeed as the BEA chart below showsAmericans stashed away an average 8.3% of their disposable income annually from 2017 through 2022, down from a previously estimated 9.4%.

The reduction stems from an accounting adjustment that lowered personal income from mutual funds and real estate investment trusts. Additionally, as Bloomberg notes, much of the reduction in personal savings seen in the revised data occurred prior to the pandemic, so its implications for how much extra cash Americans may feel they still have now is not clear cut.

Whatever the reason for the statistical adjustment, however, one can say goodbye to even the faintest speculation that US households have any excess savings left… why they don’t, of course, because even when using the previous methodology which artificially inflated total savings, JPM calculated that excess savings had already run out…

… which means that if Q3 GDP was bad and consumption was “revised” sharply lower (odd how economic data is never revised higher under Joe BIden), Q4 – when savings are virtually non-existant – and where we also get the i) return of student loan payments; ii) the UAW strike; iii) the government shutdown and iv) oil at almost $100 and gasoline at one year highs, is about to fall off a cliff.

Yes, Bidenomics is a form of Brawdo, the economic mutilator!

Bidenomics In Action! US New Home Sales Crashed -8.7% MoM In August As Mortgage Rates Surge

Biden’s press secretary Karine Jean-Pierre said that Biden was laser focused on reducing inflation. At least he isn’t laser focused on little girls … for the moment. But he still does seem laser focused on providing Ukraine with billions of dollars.

After months of soaring in the face of higher mortgage rates (and higher prices), new home sales hit a wall in August, crashing 8.7% MoM – the biggest drop since Sept 2022 (and four times worse than the -2.2% MoM expected)…

But at least new home sales were up on a YoY basis.

hat is the lowest SAAR since March…

The median sales price of a new home edged lower to $430,300 (average home price rose), according to the Commerce Department’s report.

Despite the decline, that’s still well above pre-pandemic levels.

As a reminder, according to a report released Friday by Redfin Corp, nearly 60,000 deals to purchase homes fell through in August (roughly 16% of homes that went under contract last month, the biggest share of cancellations since October).

“I’ve seen more homebuyers cancel deals in the last six months than I’ve seen at any point during my 24 years of working in real estate,” Jaime Moore, a Redfin agent, said in the report.

“They’re getting cold feet.”

A potential silver lining is the rising in supply (but now much that is driven by a decline in the denominator – homes sold – vs numerator – homes available; is unclear)…

Is the catch-down to reality about to begin?

Source: Bloomberg

They should, given that homebuilders can’t be filling this gap – between the current 30Y mortgage rate and the effective rates that borrowers are currently paying on their home loans – (i.e. subsidizing new home sales) forever…

Source: Bloomberg

And investors are starting to wake up too…

Is Jay Powell about to get the ‘affordability’ compression he was hoping for?

Making America Unaffordable Again (MAUA)? US Home Prices Rise 1% YoY In July (After 0% Growth In June) Las Vegas Leads Downturn In Home Prices Followed By Zuckerburgh (San Francisco)

Thanks to rampant Federal spending and overstimulus by The Federal Reserve, US housing prices are simply unaffordable for many. Particularly since the Covid epidemic (Wuhan China Flu).

The S&P CoreLogic Case-Shiller U.S. National Home Price NSA Index, covering all nine U.S. census divisions, reported 1.0% annual change in July, up from a 0% change in the previous month.

Yes, home prices grew in July despite rising mortgage rates. As CS Lewis wrote “That Hideous Strength” but this is about how The Fed doesn’t understand what they have done.

At the metro level, Las Vegas leads in YoY price declines at -7.2%. In a close second is San Francisco at -6.2%. Portland and Seattle also declined.

Here is Screamin’ Joe Biden. You know Biden is lying when he gets angry.

Alarm! 3rd Consecutive Year Of Negative Returns On 10-year Treasuries Which Has Never Happened In History (10Y Yields Up 308% Under Biden, Mortgage Rates Up 156%)

Alarm! US 10-year Treasury yields are soaring along with mortgage rates.

The US Treasury market is witnessing another significant selloff, pushing the 10y UST yield close to the 4.50% mark. The surge in real rates is remarkable, reaching 2.12% for the 10y, a level not seen since 08’. While this might appear attractive in real terms compared to historical benchmarks, could we be on the brink of a third consecutive year of negative performance for US Treasuries? To put this into perspective, such a scenario has never occurred in history.

The conforming mortgage rate is at 7.3%, up 156% under since Biden’s coronation as El Presidente of the United Banana Republics of America. Where political opponents are indicted prior to elections.

In Biden’s Banana Republic economy, the US Treasury 10y-2y yield curve remains inverted.

And then we have Mish’s chart on debt as a percentage of GDP from CBO. Remember, we used to worry about the US breaking the 80% debt to GDP level. It is now projected to be 181%. Wow.

This isn’t good!

El Presidente Billions Biden.

UAW’s 20% Wage Hike Demands Just Coping With Bidenonomics (Gasoline Prices UP 70% Under Union Joe While Food CPI Up 20%)

The Big Three auto companies and the UAW are suffering under Bidenomics (code for massive green energy payoffs to large donors). As I pointed out yesterday, the auto industry suffered a large decline of -7.60% in Q2 as a result of rising car prices (going electric is EXPENSIVE) and increasing consumer debt to cope with Bidenomics.

So when we consider the UAW’s demands of $20 an hour hike in pay, you have to consider that under “Union Joe” gasoline prices are up 70%, and food CPI is up 20%. So a 20% pay hike won’t even cover the cost of commuting and will just cover the increased food costs.

The shortened work week to 32 hours? How European of the the UAW.

But perhaps they will have the extra time to travel to Paris France to eat some beef au poivre at Le Bistrot Paul Bert.

US Credit Default Swaps Price Now Above Spain As US Debt Gets Close To $33 TRILLION And $194 TRILLION In Unfunded Federal Promises (Joy To The Globalist Elites!)

I ain’t never been to Spain, but the US under Biden is like Spain in terms of default risk.

Actually, I have to Spain numerous times and love visiting Barcelona. But the US debt fiasco under Biden and Congressional spending sprees has led to … US credit default swap being priced worse than Spain’s CDS.

With Biden/Congress orgy of spending (and a declining economy in many important respects), the US is seeing Federal debt near $33 TRILLION and even worse, unfunded Federal liabilities (promises, promises) are at $193 TRILLION, almost 6 times the current Federal debt load.

If you are into archaelogy and fossils, Nancy Pelosi (83) has announced that she is running for re-election to The House. Hasn’t San Francisco suffered enough under Feinstein, Newsom and Mayor Breed?

Or as 3 Dog Night sang, “Joy to the globalist elites!”