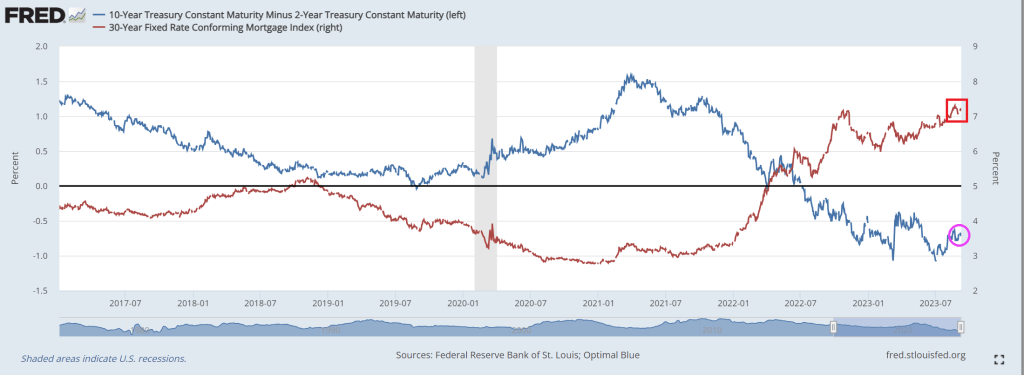
But back in the USA (while Biden does his humiliate the US tour of Vietnam, India, etc, and ignores the tragedy of the 9/11 attacks), we see mortgage rates still up above 7% as the US Treasrury 10Y-2Y yield curve
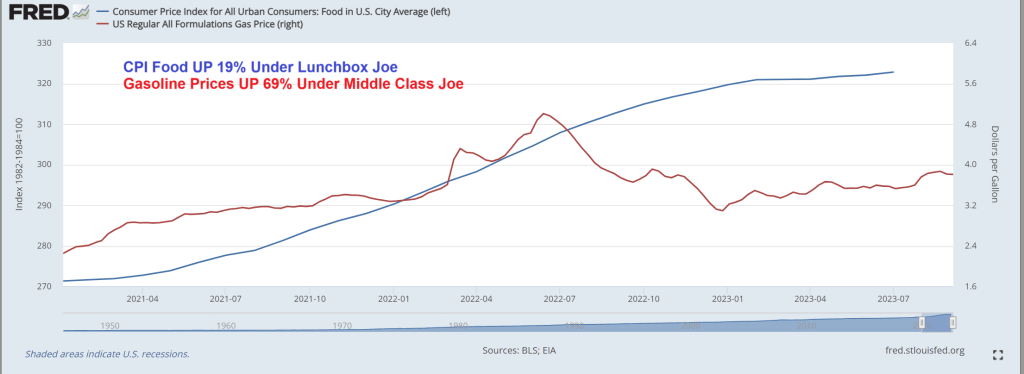
CPI food prices are up 19% under “Lunchbox Joe” and up 69% under “Green Joe”. True, the American middle class is far worse off under Bidenomics, but it is all about marketing Bidenomics at this point.
Of course, being a true RINO (Republican in name only), he won’t follow Biden around criticising him. Just critcising Trump. He is part of the Globalist Romney RINO Party (GRR).
Bidenomics is terrible! Just a huge payoff to be big donors (the donor class) for green energy, Big Pharma and Big Defense. Now Biden is considering using ankle monitors to prevent illegal immigrants from leaving Texas and traveling to welfare-friendly blue states like California and New York rather than just enforcing the border. The middle class is truly wasting away with Bidenomics.
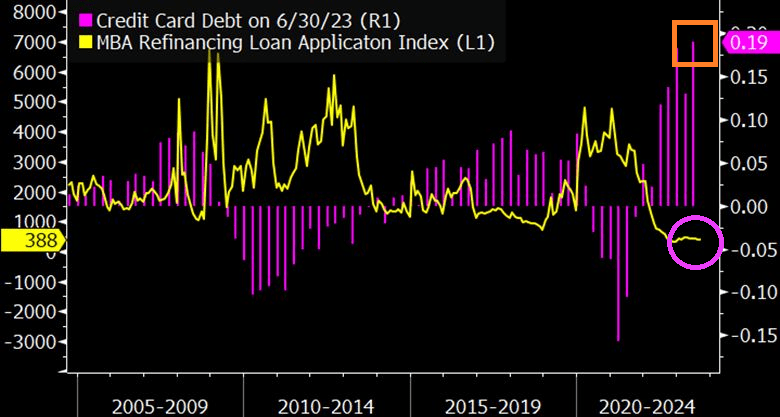
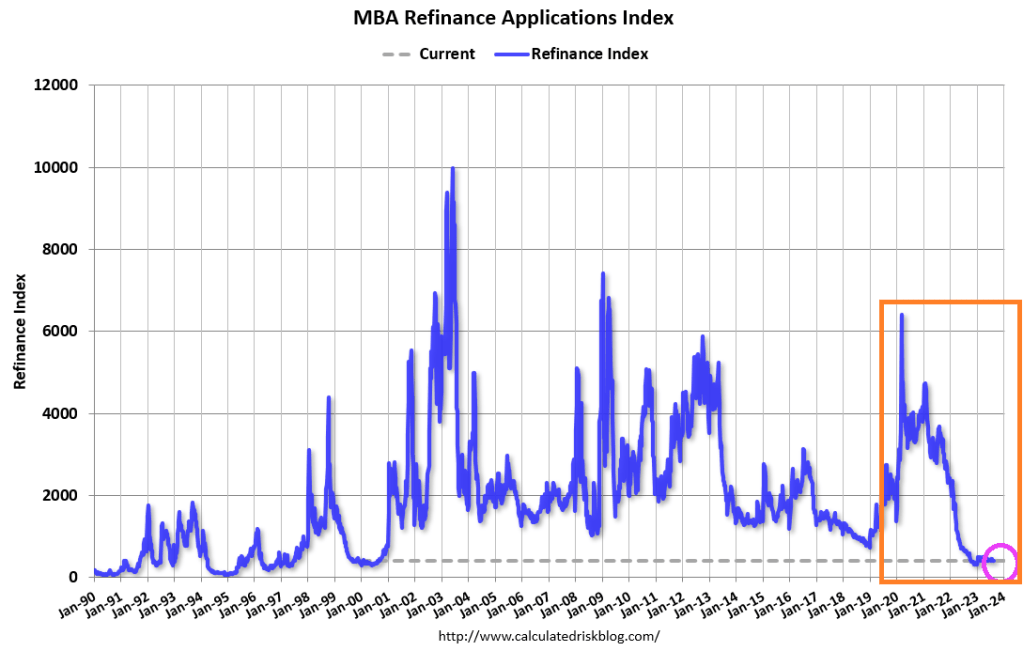
Let’s start with crashing mortgage refi demand as consumers load up on credit cards to afford rising prices thanks to Bidenomics.
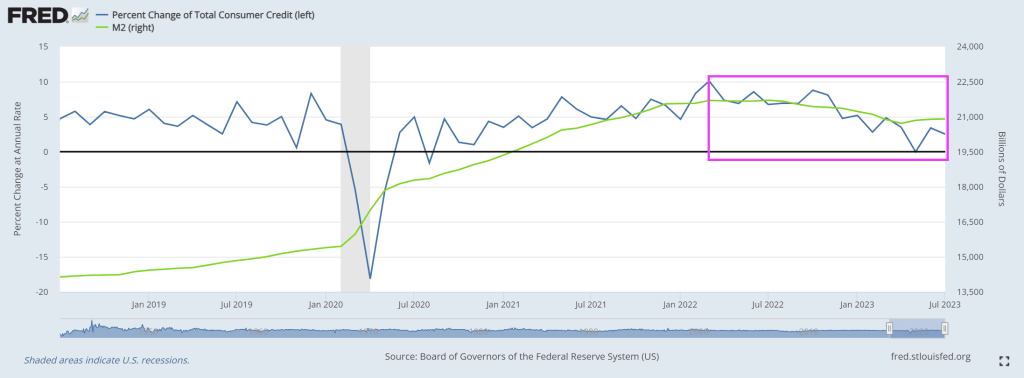
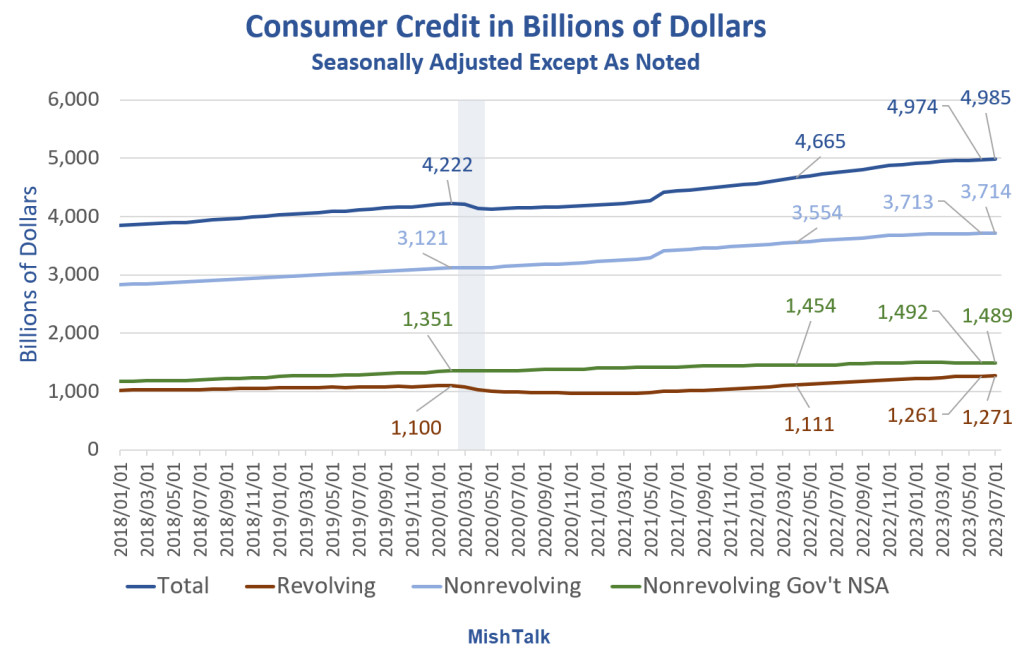
The Fed reports dramatically weakening consumer credit with negative revisions too.
Consumer Credit data from the Fed, the last two months labeled are May and July, chart by Mish
Consumer Credit Report Revisions
Consumer Credit data from the Fed, chart by Mish
Revision Key Points
Most of the revisions are in nonrevolving, but that impacts the totals.
Nonrevolving credit rose $1 billion in July, from a negative $22 billion adjustment in June. The Fed revised a reported $3.735 trillion down to $3.713 trillion.
In turn, nonrevolving impacted the totals.
Total credit rose $11 billion in July, from a negative $23 billion adjustment in June. The Fed revised a reported $4.997 trillion in June down to $4.974 trillion.
Nonrevolving Consumer Credit in Billions of Dollars
Nonrevolving consumer credit data from the Fed, chart by Mish
Nonrevolving Credit Implications
Assuming the data is accurate (unlikely) or at least the revision direction is accurate (likely), mortgage and existing home sales data is suspect.
Real (inflation adjusted) nonrevolving credit peaked in June of 2021.
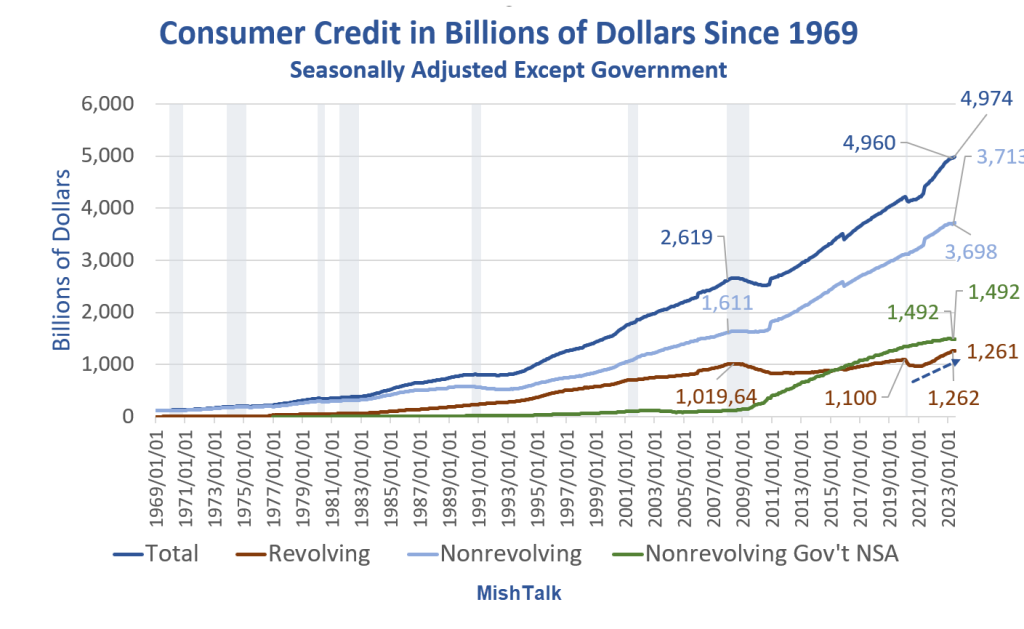
Consumer Credit in Billions of Dollars Since 1969
Consumer Credit data from the Fed, chart by Mish
Consumers have generally done a pretty good job of avoiding credit card debt thanks to three rounds of fiscal stimulus.
However, inflation kicked in and the stimulus money has been spent. The result is the steep rise in credit card debt as noted by the blue arrow. Let’s hone in on that.
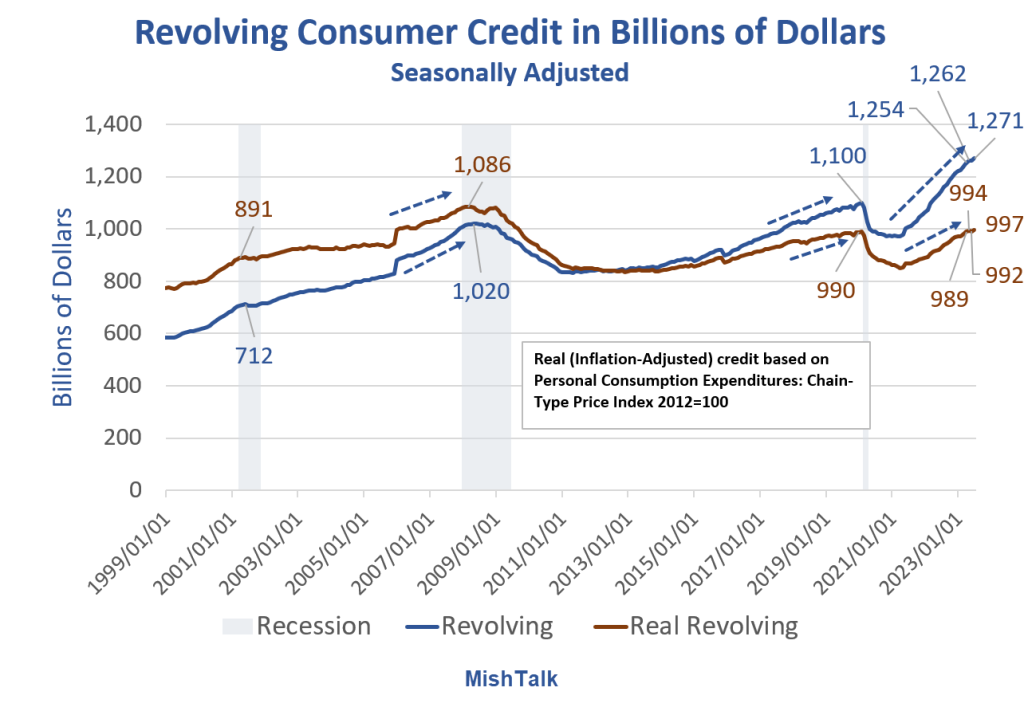
Revolving Consumer Credit in Billions of Dollars
Consumer Credit data from the Fed, Real (inflation adjusted calculation) and chart by Mish
Stunning Steepness in Credit Card Debt Accruals
The speed at which consumers are going into credit card debt is stunning.
It’s hard to maintain lifestyles with rising inflation unless wages keep up.
The BLS and Fed believe the rate of increase in inflation is falling. Assuming the data is correct, consumers are struggling anyway.
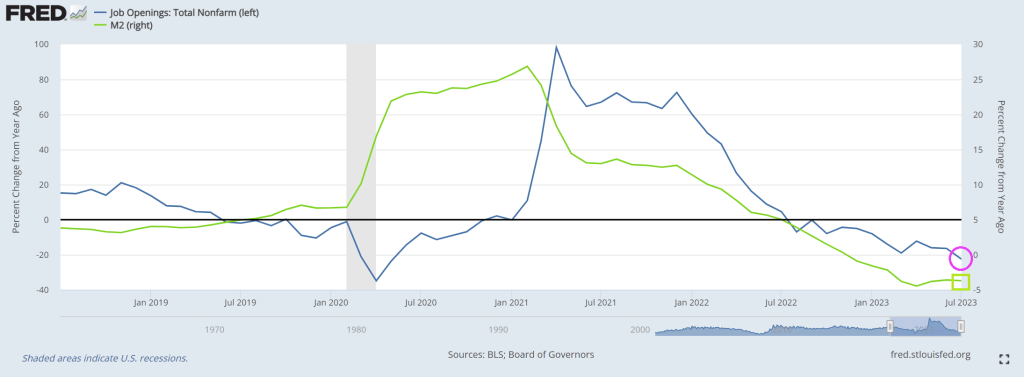
What Happens if Jobs Take a Dive?
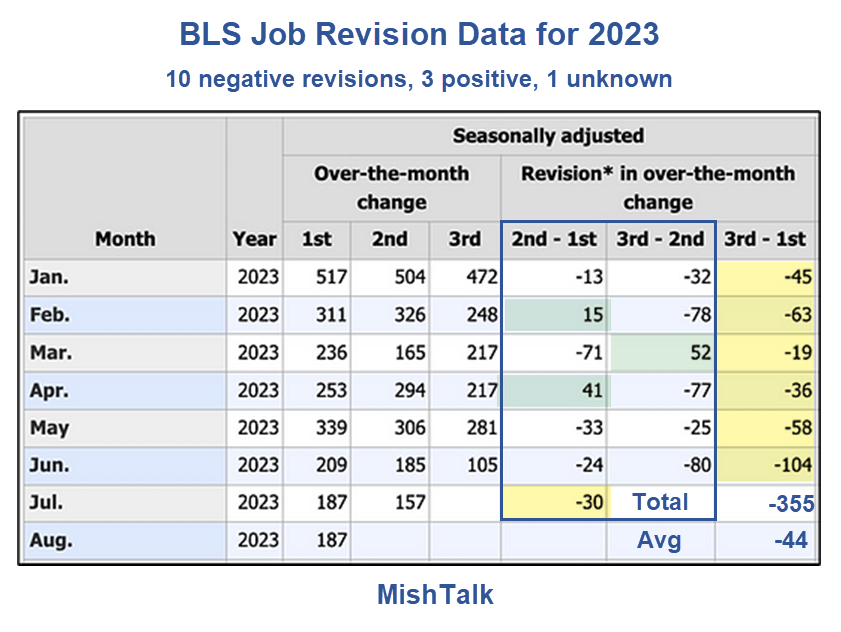
That’s actually the wrong question. Job revisions (there’s that word again) have been steeply negative.
BLS Job Revision Data from the Philadelphia Fed
Jobs are still positive, assuming (there’s that word again) you believe the numbers and more negative revisions (there’s that word again) are not in the works.
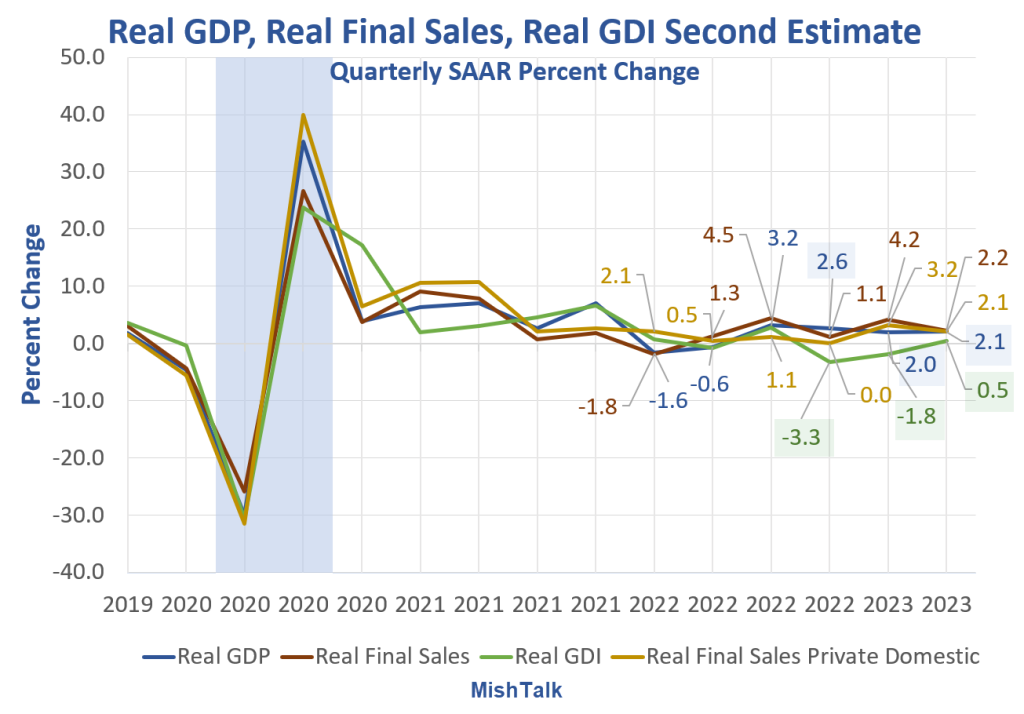
As long as you are making assumptions, if you are rah-rah on the strength of the Biden economy, you may as well assume GDP numbers are correct as well.
My assumption is GDP is flat out wrong and Gross Domestic Income (GDI) numbers are far more likely to be correct than GDP numbers. GDP and GDI are supposed to be the same but aren’t.
Thanks to Bidenomics, code for massive Federal spending on green energy initiatives and payoffs fo large donors, we have agonizing inflation and consumers are borrowing more and more to cope with inflation. And with the increased use of debt comes …. drumroll … delinquenices!
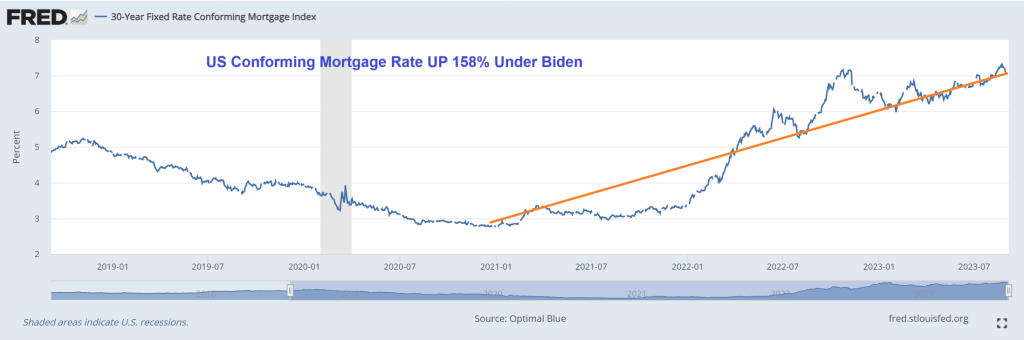
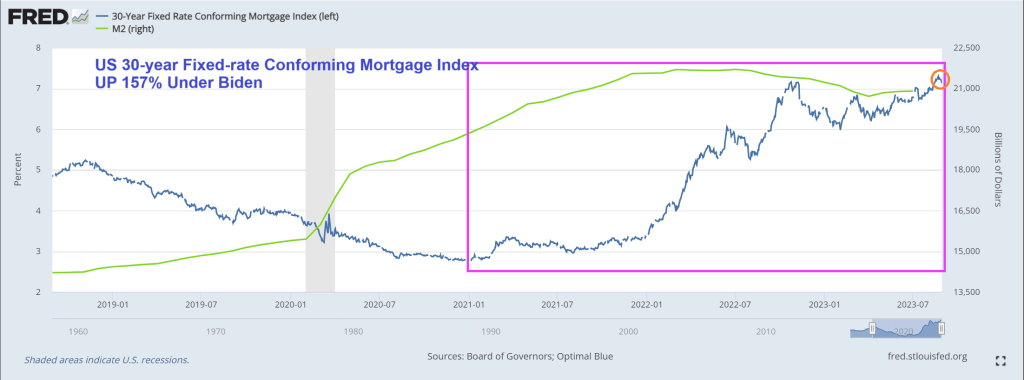
The US conforming mortgage rate is UP 158% under Bidenomics.
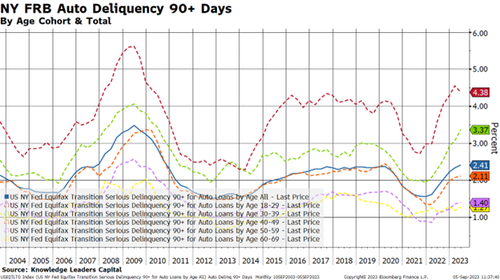
Let’s move on to some forms of consumer loans, where the story is a little more daunting.
Auto loans are definitely the epicenter of the credit cycle. While the overall average is a still somewhat tame 2.41%, younger borrowers are not keeping up. Younger borrowers have delinquency rates that are 1-2% higher than the average while the inverse is true for older borrowers. Eighteen-to-thirty-nine year-old borrowers have the highest delinquency rate in 13 years.
Somehow, I sense that used car lots are going to start filling up again as these vehicles get repossessed. This should put downward pressure on used car prices, bringing that element of inflation down. This is one of the channels through which monetary policy works.
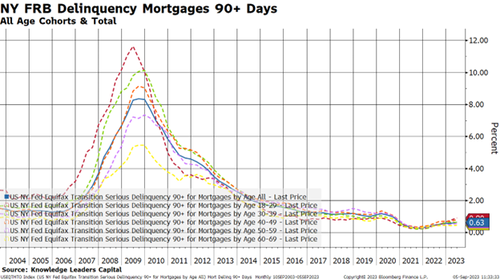
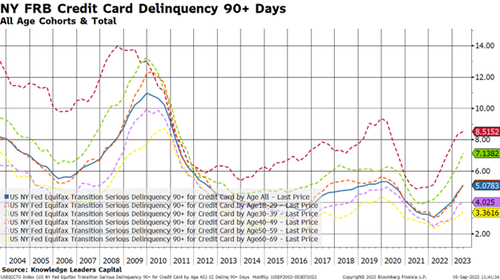
Lastly, I’ll take a look at credit card delinquencies.
Here is where we can really see the stresses building.
First, the overall delinquency rate has about doubled from 2.5% to 5% over the last couple years.
Second, older borrowers have seen a tick up in delinquency rates, a feature we don’t really see in other credit products.
Third, one in 12 younger 18-29 year-old borrowers are 90+ days late making their credit card payments.
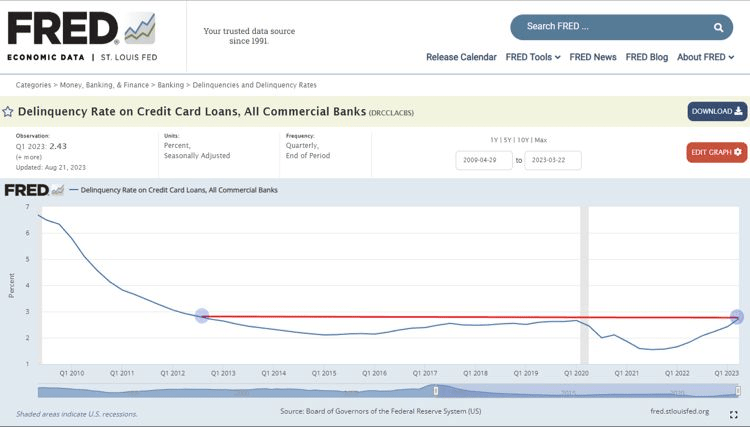
Credit Card Delinquency Rate across all commercial banks hit 2.77% in the 2nd quarter, the highest level in more than a decade.
In conclusion, we are in the early days of a consumer credit cycle. Younger borrowers are the weakest link in this analysis, and this makes me wonder where rates go when student debt payments turn back on at the end of the month.
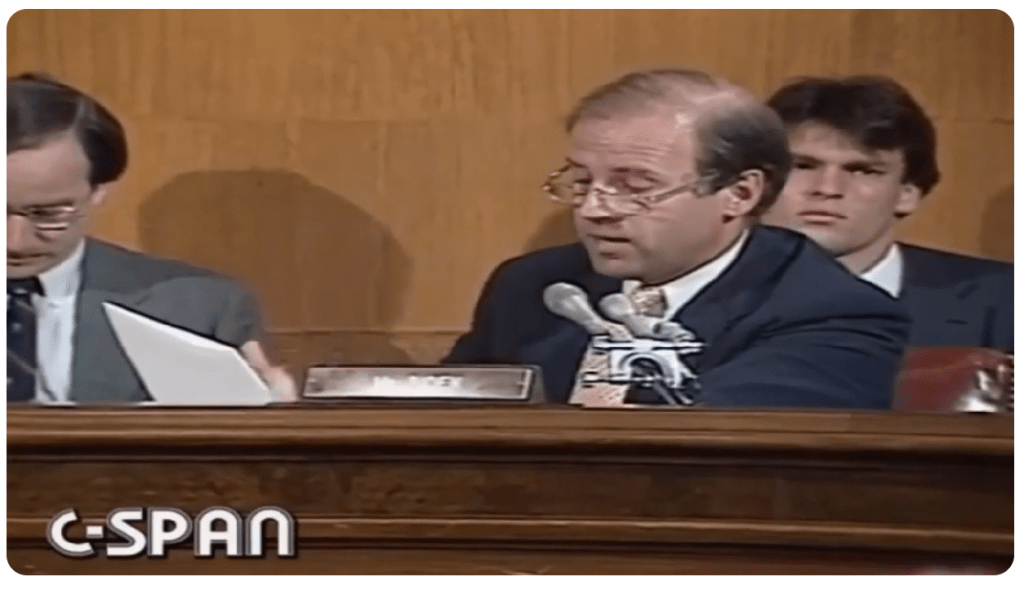
Billions Biden, the President who loves to (recklessly) spend taxpayer money (mostly on large donors). is going to have difficuly spinnig the latest employment figures.
I wonder if Biden will use his writeboard to brag about the 30-year mortgage rate rising 157% under his economic Reign on Error? Aka, Bidenomics.
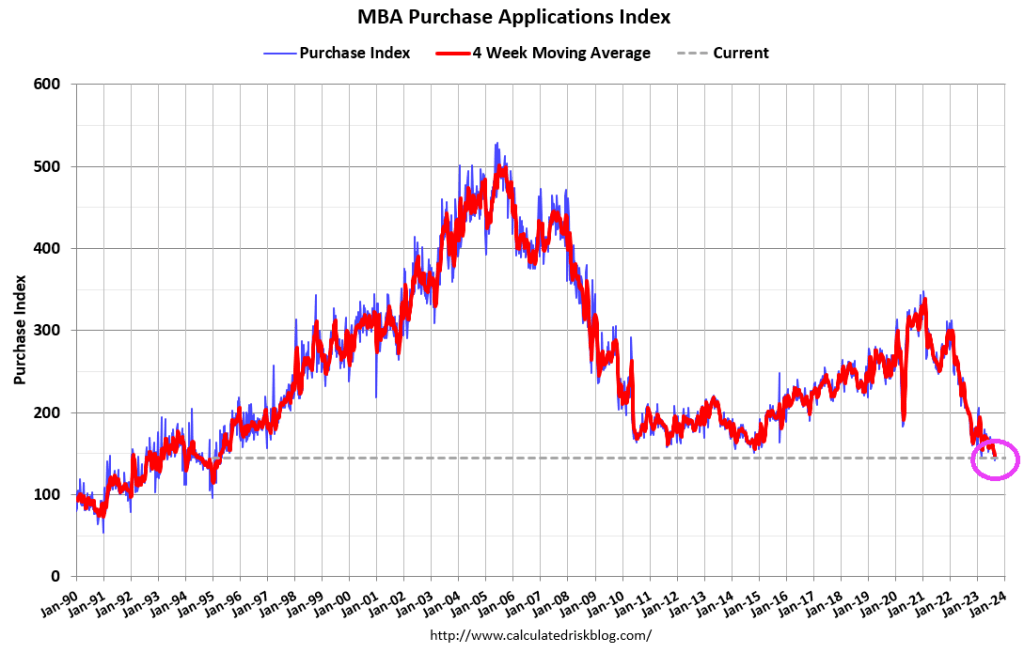
Mortgage applications increased 2.3 percent from one week earlier, according to data from the Mortgage Bankers Association’s (MBA) Weekly Mortgage Applications Survey for the week ending August 25, 2023.
The Market Composite Index, a measure of mortgage loan application volume, increased 2.3 percent on a seasonally adjusted basis from one week earlier. On an unadjusted basis, the Index increased 1 percent compared with the previous week. The Refinance Index increased 3 percent from the previous week and was 28 percent lower than the same week one year ago. The seasonally adjusted Purchase Index increased 2 percent from one week earlier. The unadjusted Purchase Index decreased 0.3 percent compared with the previous week and was 27 percent lower than the same week one year ago.
Joe Biden will always be remembered for lying about never raising taxes on households making under $400,000. Inflation is a permanent tax, mostly on those making under $400,000 per year. And household essentials are up substantially under Biden: gasoline prices are up 72%, rent CPI of Primary Residence is up 16%, and food at home CPI is up 20%! That is a HUGE tax on the middle class.
When CPI falls this does not mean that prices on goods and services are going down, it only indicates that prices are rising slower than they were the month or the year before.
Another misconception about CPI is that it measures the inflation rate accurately for regular consumers on common purchases. In reality, the CPI represents mean average price rate increase for a vast basket of goods; over 94,000 items and services with over 200 separate categories. Most of these items and services you will never use or rarely purchase in the span of a year. In other words, inflation declines in uncommon goods can dilute the numbers, making it seem like inflation is dropping while prices on daily necessities continue to spike.
The CPI is weighted according to consumer spending patterns, which is where the calculations can be “adjusted” to a certain extent in an arbitrary manner. Then there is outright government manipulation through various means. As we witnessed recently with the Biden Administration’s claims that “Bidenomics” has defeated the inflation threat, what these reports don’t mention is that Biden has been dumping US strategic oil reserves on the market for the past year. And since energy prices effect the inflation of so many other categories, Biden has artificially manipulated the CPI down using one key resource.
Now that his ability to dump oil reserves has ended, CPI will rise once again along with energy prices.
The point is, it’s impossible to get a sense of the real damage from inflation without looking at the cumulative inflation in necessities (the goods and services that people are required to purchase on a regular basis to live day to day). If we throw out the CPI distraction and look at common necessities since 2020, the economic picture is far more bleak.
Overall food prices have soared by 25%-30% in only three years (again, this means that you are now paying 30% more this year for food than you were paying at the beginning of 2020). Chicken is up from $3 per pound to $4 per pound. Beef is up from $3.50 to $6 per pound. Corn is up from $3.50 per pound to $4.70 per pound. Wheat is up from $5 per pound to $7 per pound. In 2019 the average American household was spending $8100 on food annually; with a 30% increase, in 2023 Americans will be spending at least $10,500 per household.
By the end of 2019, the average rental price of a single family home was around $1450 per month. This year the price is around $2000 per month. At the beginning of 2020, the median cost of a home was $320,000; by 2023 the price skyrocketed to an average of $416,000.
For gasoline, the price in early 2020 was around $2.50 per gallon. The price has fluctuated dramatically due to Biden’s manipulation of the market using strategic reserves, but still remains high today at $3.80 per gallon.
The cost of electricity has risen swiftly, holding steady around .13 cents per kilowatt hour for a decade, then spiking to at least .17 cents per kilowatt hour by 2023.
Remember, most of these costs are static and are difficult to reduce through household spending cuts. These are not items that are easily removed from a monthly budget and the expenditures add up to considerable pressure on consumer accounts. This is probably why around 74% of the public in polls say that the economy is getting worse, not better. It’s because government statistics are not highlighting the true inflationary crisis.
When we look at the cumulative climb of prices in necessities since before the inflation crisis officially began, the truth is that Americans now have to increase their wages by at least 25%-30% on average to maintain the same standard of living they had three years ago. This is a disaster not seen since the stagflationary event of the 1970s and early 1980s. If you have a strange feeling like your bank account is being rapidly drained in recent months, that’s because it is.
And the 30-year mortgage rate is up 163% under Middle Class Joe.
Mortgage demand (applications) decreased 4.2 percent from one week earlier, according to data from the Mortgage Bankers Association’s (MBA) Weekly Mortgage Applications Survey for the week ending August 18, 2023.
The Market Composite Index, a measure of mortgage loan application volume, decreased 4.2 percent on a seasonally adjusted basis from one week earlier. On an unadjusted basis, the Index decreased 6 percent compared with the previous week. The Refinance Index decreased 3 percent from the previous week and was 35 percent lower than the same week one year ago. The seasonally adjusted Purchase Index decreased 5 percent from one week earlier. The unadjusted Purchase Index decreased 7 percent compared with the previous week and was 30 percent lower than the same week one year ago.
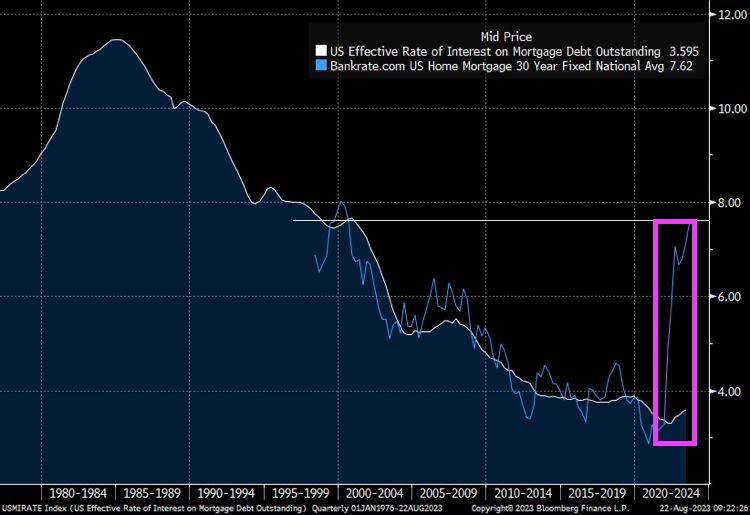
The spread betweenn Bankrate’s 30 year rate at 7.62% and the effective rate on mortgage debt outstanding at 3.595% has exploded as mortgage rates jump.
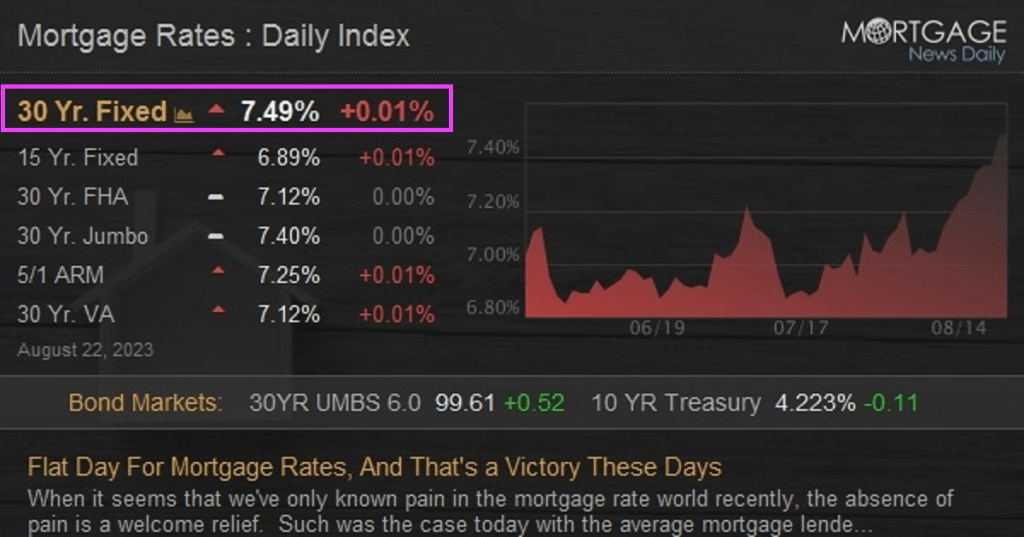
Today’s mortgage rates are up to 7.49%. OMG!
Bidenomics (code for making large donors wealthier and the middle class getting the boot) and catch-up for Yellenomics (rates too low for too long), and Powell are helping to burn down the housing market.
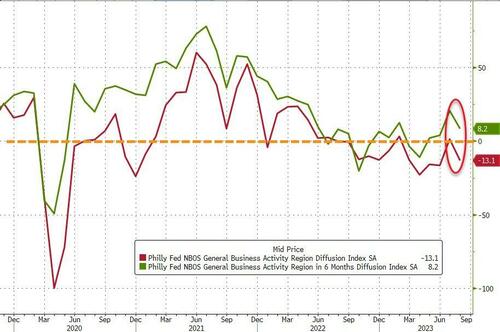
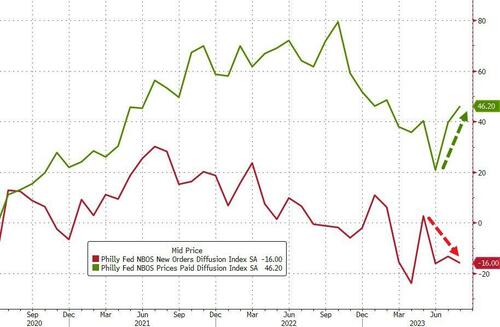
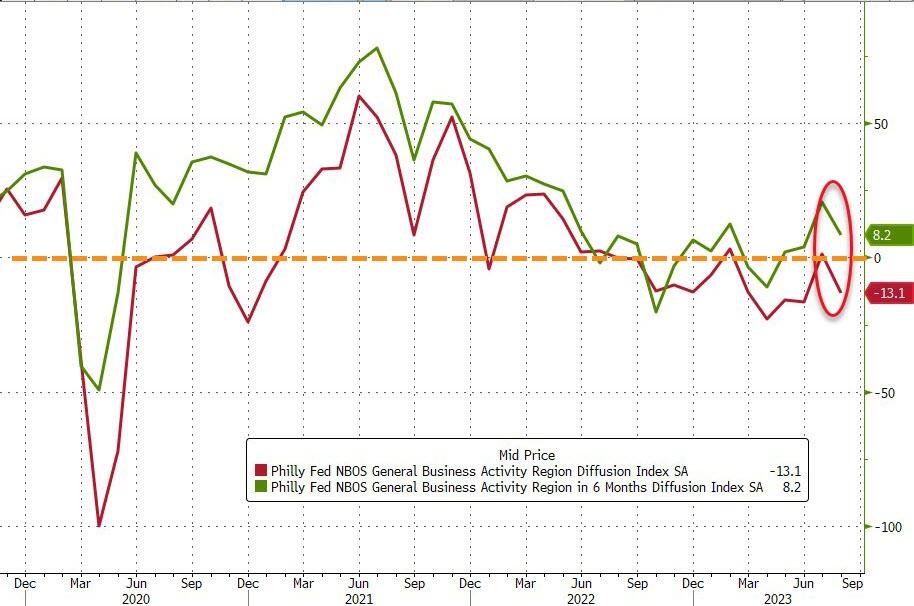
It’s NOT always sunny in Philadelphia. Particularly when the Philly Fed non-manufacturing survey screams stagflation (a nauseating combination of economic slowdown and inflation).
On a non-seasonally-adjusted basis, the Philly Fed Services survey plunged to -20.0 – practically its lowest level since the COVID lockdowns…
Source: Bloomberg
Under the hood it’s even uglier with stagflationary impulses rearing their ugly heads.
Price indicator readings suggest continued increases in prices for inputs and the firms’ own goods and services.
The prices paid index increased 7 points to 46.2 this month. More than 50 percent of the firms reported increases in input prices. Regarding prices for the firms’ own goods and services, the prices received index rose from 7.8 to 14.6.
At the same time the indexes for sales/revenues and new orders both recorded negative readings this month
Source: Bloomberg
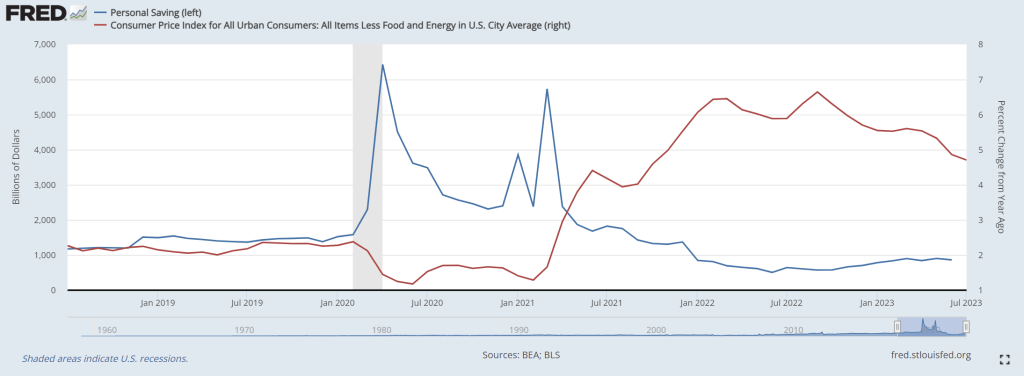
Is the ‘Services’ side of the economy finally catching down to the reality of the ‘Manufacturing’ side as savings run dry?
US personal savings are being exhausted as The Fed raises rates to fight inflation. I call this phenomenon “low riding” where consumers are being punished by The Federal Reserve and Biden Administration.
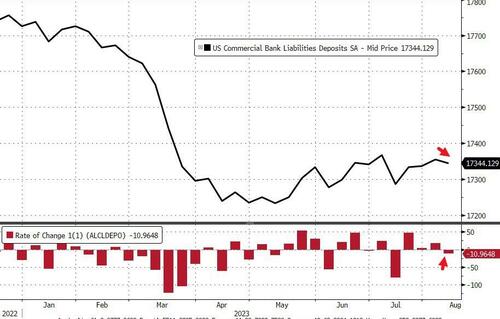
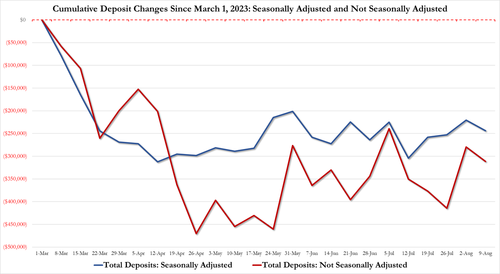
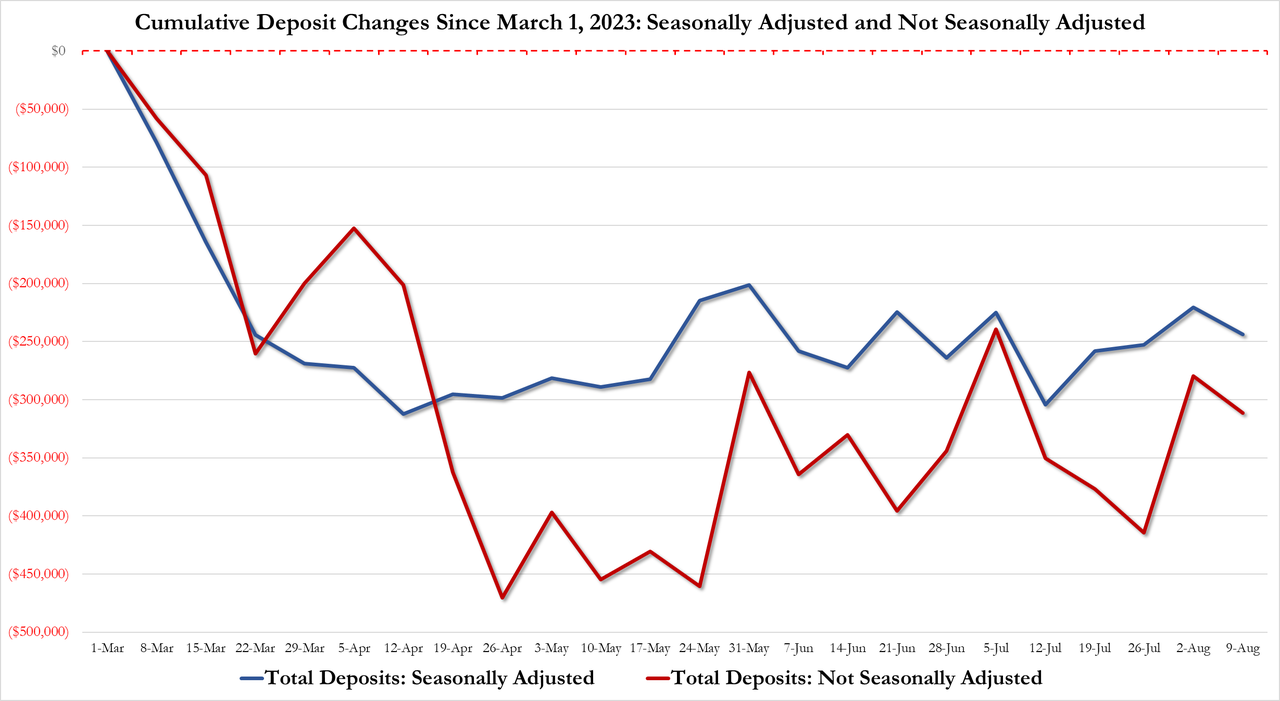
On a seasonally-adjusted basis, The Fed says that total deposits dropped $11BN last week (the first decline in 4 weeks). We also note that the prior week’s inflow was revised higher…
Source: Bloomberg
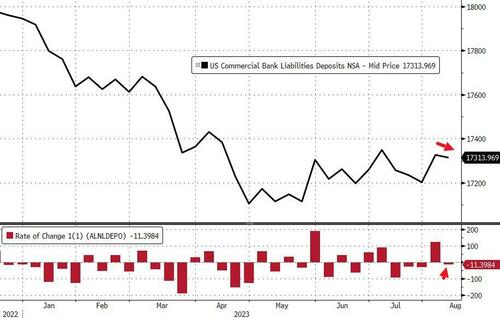
After last week’s enormous $121BN NSA deposits inflow, last week saw an $11BN outflow (on a non-seasonally-adjusted basis)…
Source: Bloomberg
The gap between SA deposits and NSA deposits remains more manageable (until the next time The Fed decides to fiddle)…
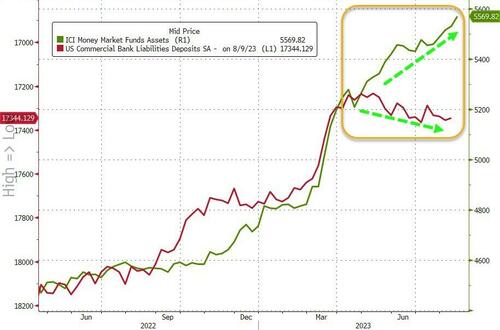
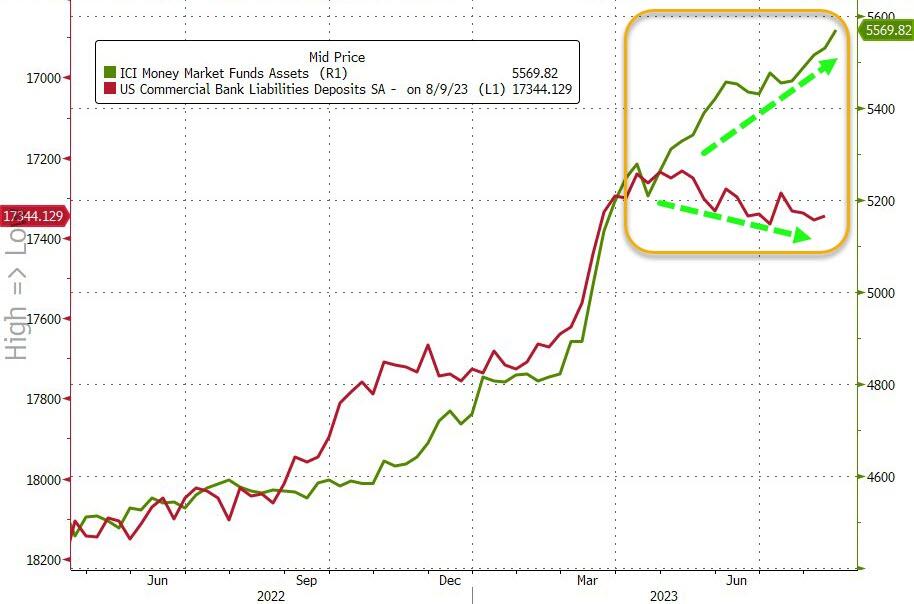
The divergence between money-market fund assets and bank deposits remains extreme…
Source: Bloomberg
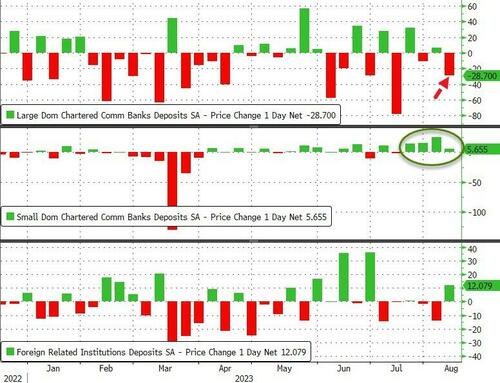
On a seasonally-adjusted basis, Small Banks saw $5.6BN deposit inflows last week while Large Banks suffered $28.7BN outflows (with foreign bank inflows of $12BN making up the difference)…
Source: Bloomberg
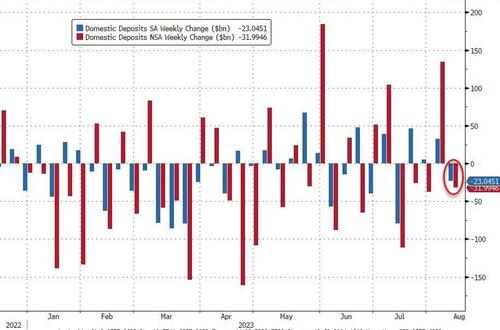
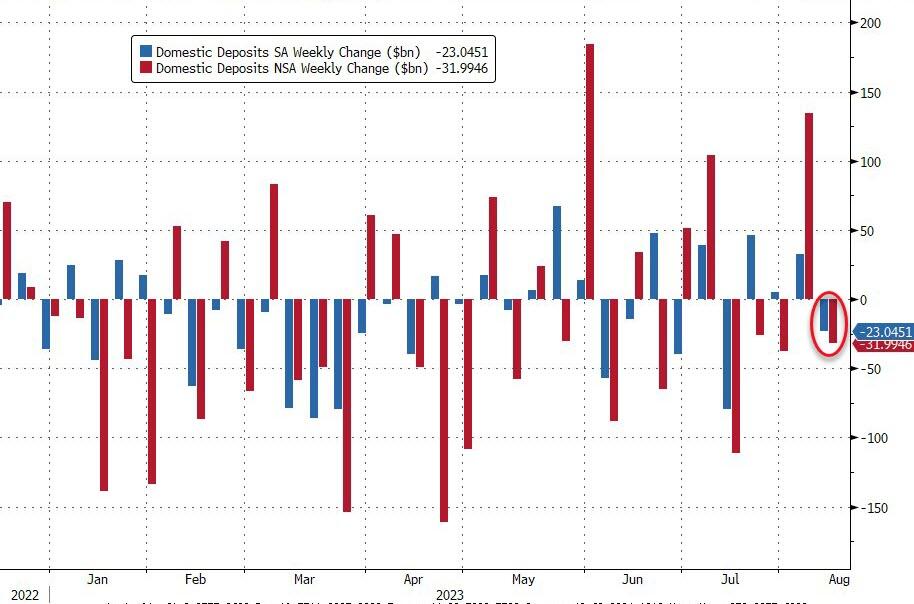
And so, for a nice change, everything is tidy with domestic US banks seeing deposit outflows on an SA and NSA basis…
Source: Bloomberg
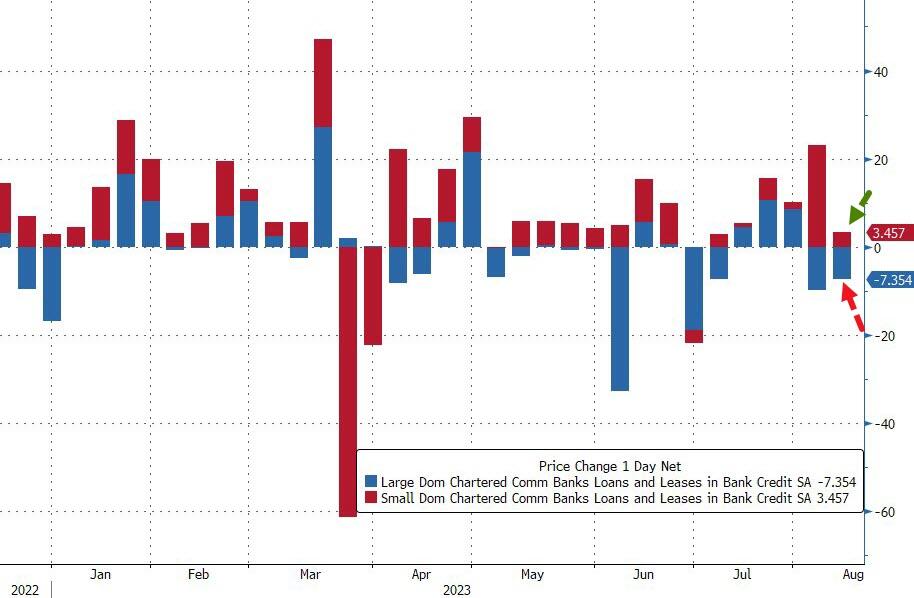
On the other side of the ledger, small banks continued to pump out loans (+$3.56BN, sixth straight week of increases), while large banks saw a $7.4BN contraction in loan volumes…
Source: Bloomberg
So, if The Fed’s data is to be believed, Small banks are ‘winning’ – deposit inflows and making loans; while large banks are leaking – deposit outflows and shrinking loans. All while Treasury prices tumble, stressing small bank balance sheets.
Just remember, the sitting US President Joe Biden goes under several psuedonyms like Robert Peters, Robin Ware, and JRB Ware in his email conversations about Ukraine with his son Hunter. But don’t forget another pseudonym: The Reverend Kane from Poltergeist 2!


You must be logged in to post a comment.