As we begin 2023 (and I am still bummed-out over Ohio State University losing a nail-bitter to Georgia in the Peach Bowl), we need to look at the condition of one of the most important sectors of the US economy.\, housing.
If we look at the US Housing Leading Growth index (courtesy of RecessionAlert.com) has slumped to its worst reading since the recessions of 1982 and 2008.
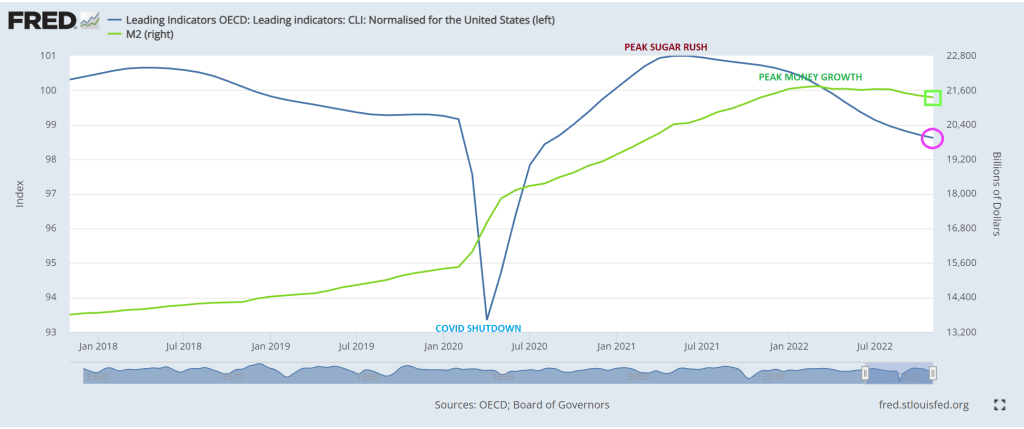
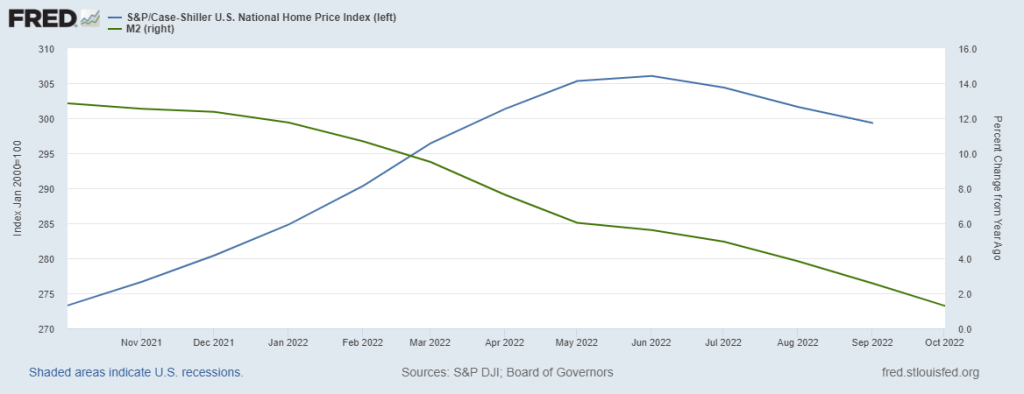
And then we have the OCED leading indicators for the US falling as M2 Money growth slows.
My favorite chart shows US home price growth falling faster than University of Michigan football team’s national championship home hopes.
Will this prompt The Federal Reserve to pivot? Only time will tell.
2022 is one of the record books and not in a Tiger Woods way. Call it a year of pain.
First, the US enacted policies that drove up energy prices (goin’ green) that reverberated through the entire economy in the form of higher prices. Second, The Federal Reserve, in attempt to combat runaway inflation, started removing the excessive monetary stimulus that had been around since Fed Chair Bernanke initiated QE, the seemingly unlimited purchase of Treasury and Agency MBS securities. Janet Yellen continued the massive asset purchases and zero interest rate policies or ZIRP. Now that inflation has struck the American middle class hard, we are seeing Fed Chair Powell doing what Bernanke and Yellen wouldn’t do — remove the monetary punchbowl.
Using Robert Shiller’s on line data, US stocks and bonds have had an awful year, the worst combined year since 1871.
US equity returns have been demolished under the NEW dual mandate (goin’ green = rising prices = Fed tightening).
Let’s see how two of the most famous investment gurus did in 2022, Warren Buffet and Cathie Wood. Buffet’s Bershire Hathaway Class A equity was UP 4% in 2022, while Cathie Wood’s ARK Innovation ETF collapsed by -67% in 2022.
Here is the clinker. The US economy (as well as the global economy) seem dependent on “cheap money” from Central Banks like The Federal Reserve. So the question is … will The Fed pivot? Fed talking heads are saying no, but Fed Funds investors are saying yes to a pivot after June 2023.
Ulysses S Grant was the President the last time the combined stock and bond market was this bad.
Here are the Lords of Darkness (Schumer and Pelosi) who concocted this witch’s brew of crony payoffs that will be ulitmately signed by El Stupido (Biden).
Do I detect a trend in the US Leading Economic Indicator data?
The Conference Board’s US Leading Economic Indicator was released this morning and it wasn’t pleasant. The US Leading Index was down -1% MoM in November.
On a year-over-year basis, it is down -4.5% YoY as The Fed withdraws its massive monetary stimulus.
The good news … for military contractors … is that Biden and Congress have given Ukraine’s Zelenskyy ANOTHER $47 BILLION.
On a year-over-year (YoY) basis, US real GDP rose to a measly 1.9%. US core PCE YoY fell slightly to 4.93%. M2 Money growth is at 2.6% YoY.
The Misery Index (U-3 inflation rate + inflation) remains elevated and above 10% (it currently clocks-in at 12%), far above the pre-Covid reading of around 5%.
Here is the rest of the story. On a quarter-over-quarter basis, real GDP rose to 3.2% QoQ. Personal consumption rose 2.3% QoQ. Core PCE (Personal Consumption Expenditures) rose to 4.7% QoQ. If we use core PCE as a measure of inflation, inflation is rising.
Here is a video of Fed Chair Jerome Powell (doubling as President Joe Biden) saying creating inflation and then raising interest rates to fight it “It’s for the best.”
The mortgage market is behaving like today’s bomb cyclone in terms of the weather. Bomb cyclone in that mortgage rates have dropped 7.16% on October 21, 2022 to 6.34% on December 16, 2022 (a drop of 82 basis points), but mortgage purchase and refinancing applications are not increasing like one would hope.
Mortgage applications increased 0.9 percent from one week earlier, according to data from the Mortgage Bankers Association’s (MBA) Weekly Mortgage Applications Survey for the week ending December 16, 2022.
The Refinance Index increased 6 percent from the previous week and was 85 percent lower than the same week one year ago. The seasonally adjusted Purchase Index decreased 0.1 percent from one week earlier. The unadjusted Purchase Index decreased 3 percent compared with the previous week and was 36 percent lower than the same week one year ago.
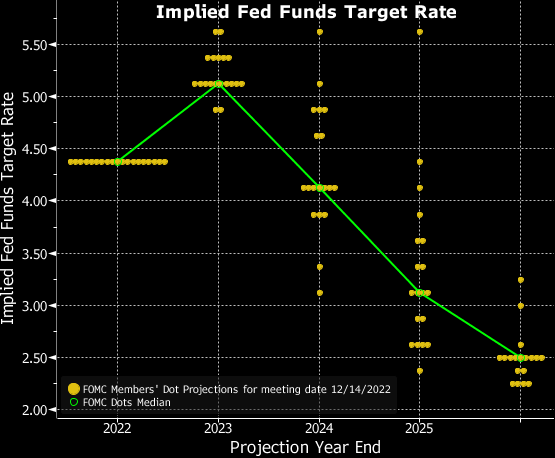
But remember, The Federal Reserve is going to be lowering their target rate after they keep raising it.
The Federal Reserve forecast for the US economy is a dismal 0.50% YoY. Do I detect a trend?
The FOMC forecast for 2023 and 2024. Core PCE YoY (inflation) is forecast to drop to 3.50%, still considerably higher than The Fed’s target rate of inflation of 2%. And unemployment is forecast to be 4.60%.
To cope with Bidenflation, US personal savings rate as of October is -67.9% YoY. The “good” news is that rents YoY are crashing. But food prices under Inflation Joe remain very high. But most everything is slowing down, not due to Biden’s policies, but a global and US economic slowdown.
With a big slowdown coming our way, you can understand why The Fed’s December Dot Plot is showing declining Fed Funds Target rate starts declining in 2024.
Even US mortgage rates are headed down.
Speaking of going down, cryptos are down across the board with Cardano leading the decline at -6.91%.
Years ago, Brent Ambrose, Michael Lacour-Little and I wrote a paper on the US 30-year jumbo mortgage spread over conforming 30-year mortgage rates entitled “The effect of conforming loan status on mortgage yield spreads: a loan level analysis.” But that paper was written before Covid and the dramatic distortion caused in mortgage markets by The Federal Reserve’s massive increase in money.
Here is the spread between Bankrate’s 30-year mortgage rate and their 30-year JUMBO mortgage. Notice that between 2007 and early 2020, the median “jumbo spread” was 49 basis points. But after Covid and The Fed’s counterattack (by printing M2 Money), the median Jumbo spread from 4/1/2020 to today is only 1 basis point.
In the following chart, you can see the jumbo mortgage rate (yellow) against the conforming mortgage rate (white) and there is almost always a spread between the two UNTIL 2020 where we saw M2 Money growth (green line) spike and The Fed increased their purchases of Agency MBS (purple line). Since Covid and The Fed’s massive reaction, the jumbo rate and conforming rate are virtually the same. In fact, the latest jumbo spread is 1 basis point over the conforming rate.
Why is this happening? One explanation is that demand from the investors who ultimately buy jumbo mortgages. The strong demand by investors appears to have driven down the yields on jumbos relative to conventional loans, especially as the use and accessibility to jumbos has grown.
A second explanation is that Loan Level Price Adjustments that were added to conforming loans post-financial crisis never went away (until just recently on selected loans). This makes jumbos and conforming loans very close in yield.
So, when will the mortgage market return to normal and jumbo mortgages go back to the normal 50 basis point spread? We may see normalization if The Fed speeds up its withdrawal from markets. Also, getting rid of Loan Level Price Adjustments would help normalized the mortgage market.
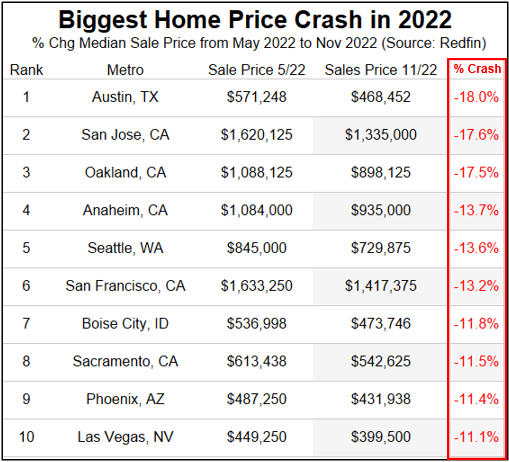
But things are getting stressed in jumboland (California) where home prices are crashing in 5 of the top 8 metro areas.
Harry Houdini couldn’t have created a more tantalizing mystery … and one I wish would go away.
As expected, The Federal Reserve raised their target rate by 50 basis points to 4.50%, the highest Fed target rate since November 2007.
The only thing interesting that happened was Powell’s hawkish statements about The Fed wanting to keep tightening to fight inflation caused under “Inflation Joe” Biden.
But the NEW Fed Dots plot looks like an Olympic Ski jump with expectations of DECLINING Fed target rates.
My take on the steeply downward sloping Dot Plot is a tacit acknowledgement that a recession is headed our way in 2023.
Here is the Lillehammer Olympic ski jump that resembles today’s Fed Dots Plot.


You must be logged in to post a comment.