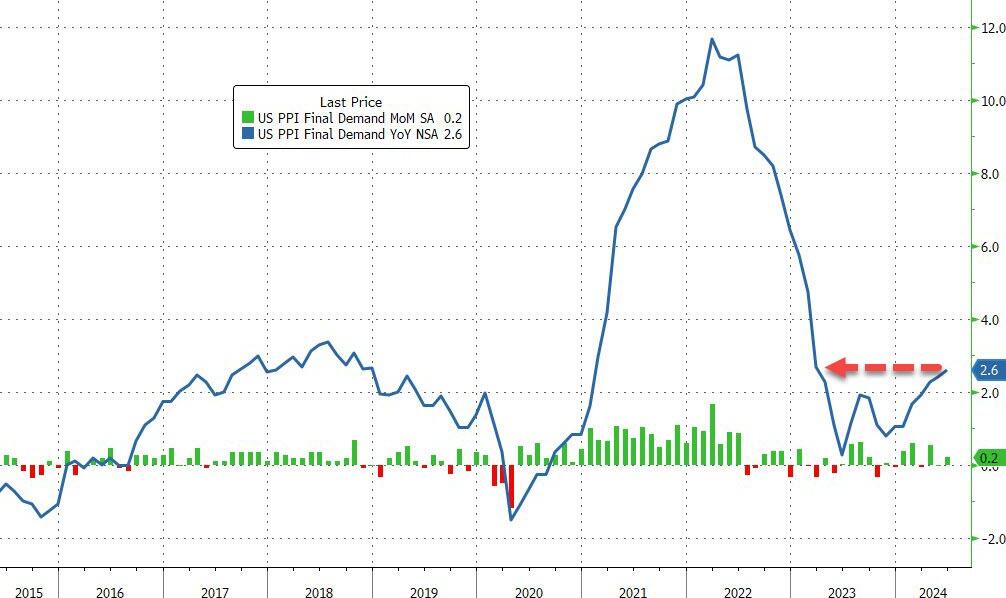
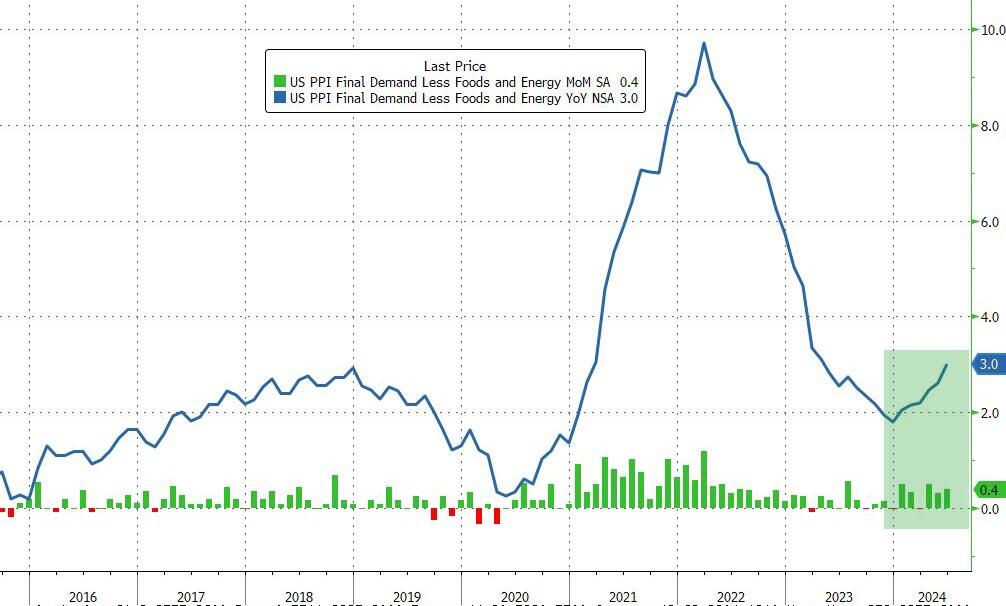
Core PPI rose by 0.4% MoM (double the 0.2% exp), sending the YoY price rise up by 3.0% (also the hottest since March 2023)…
Source: Bloomberg
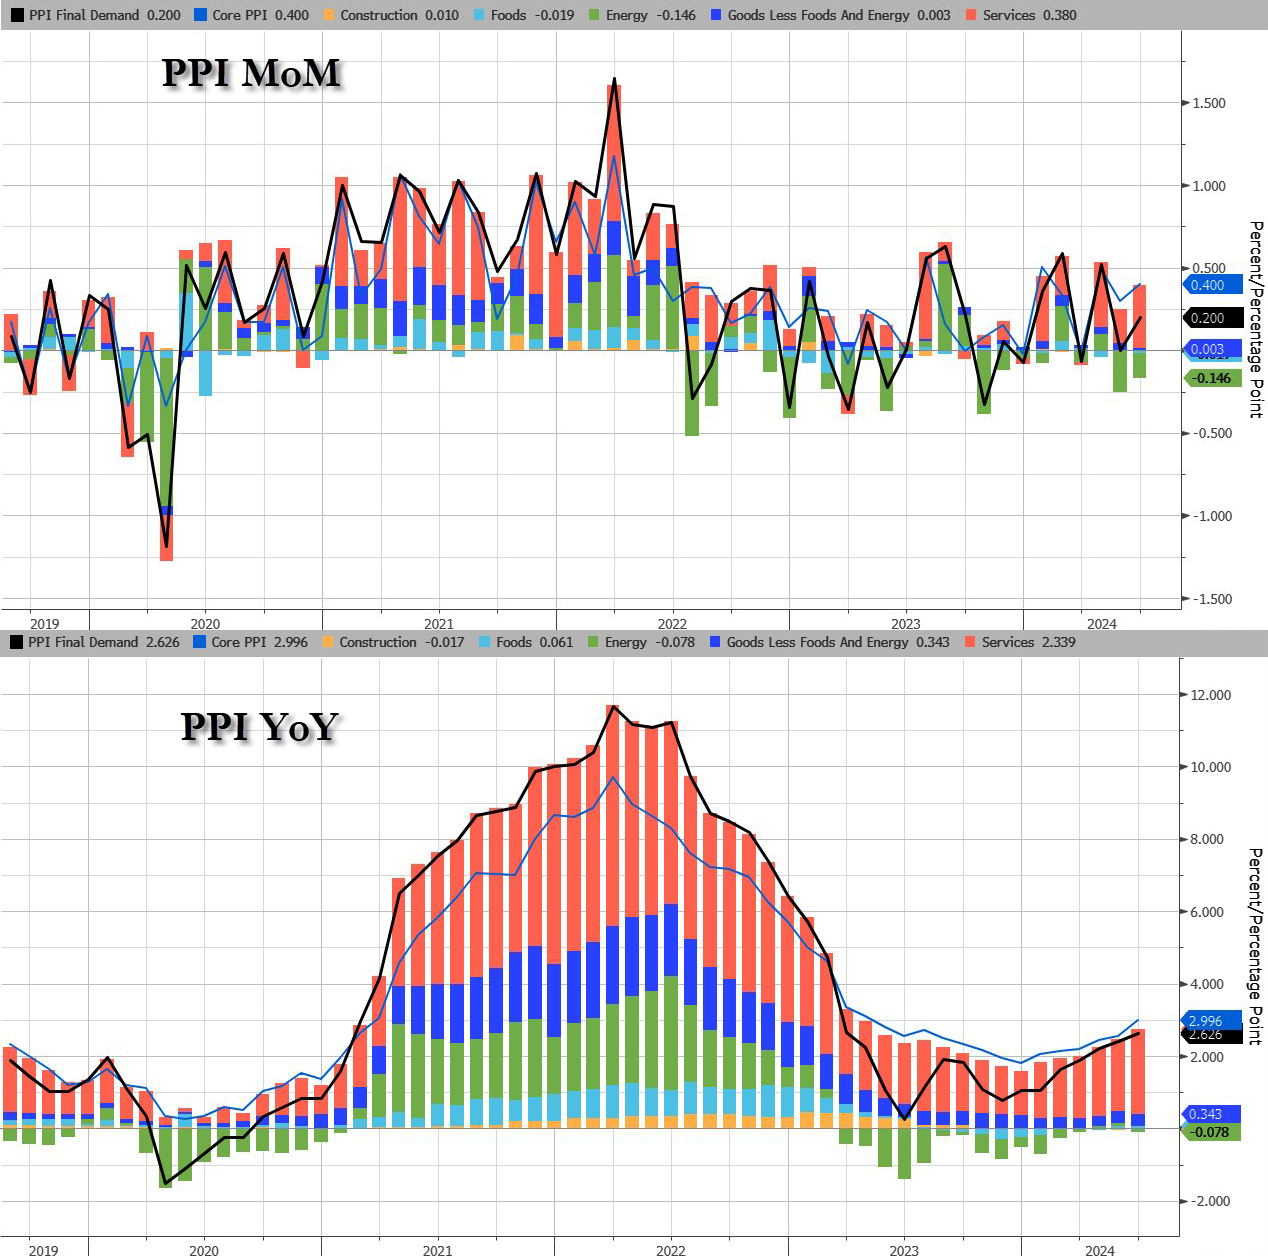
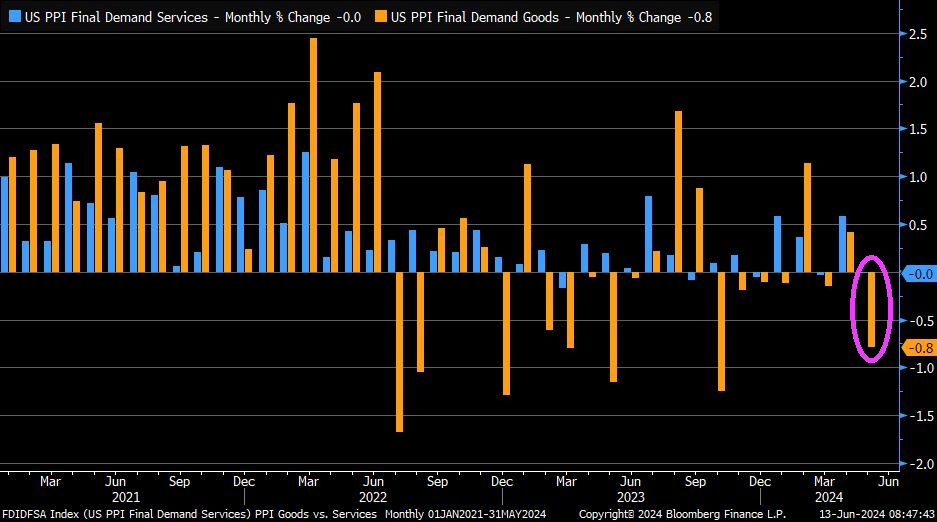
The jump in PPI was driven by a resurgence in Services costs as Energy remains deflationary (for now)…
Source: Bloomberg
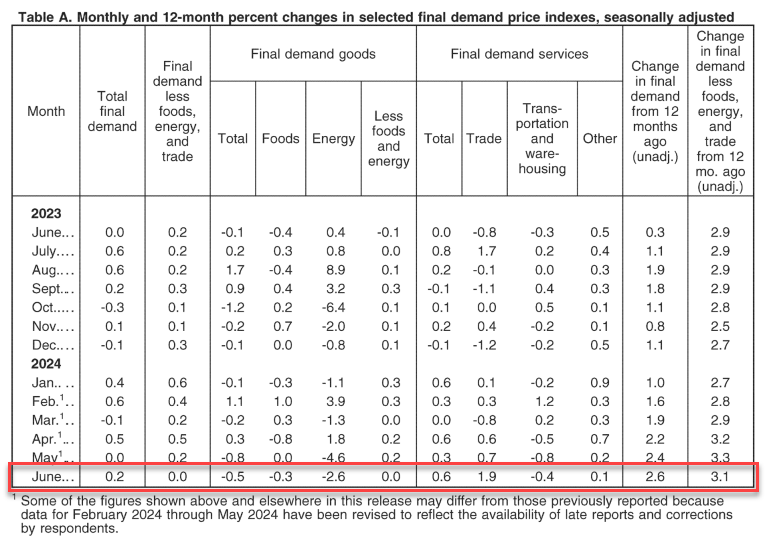
The June rise in the index for final demand can be traced to a 0.6-percent increase in prices for final demand services. In contrast, the index for final demand goods decreased 0.5 percent
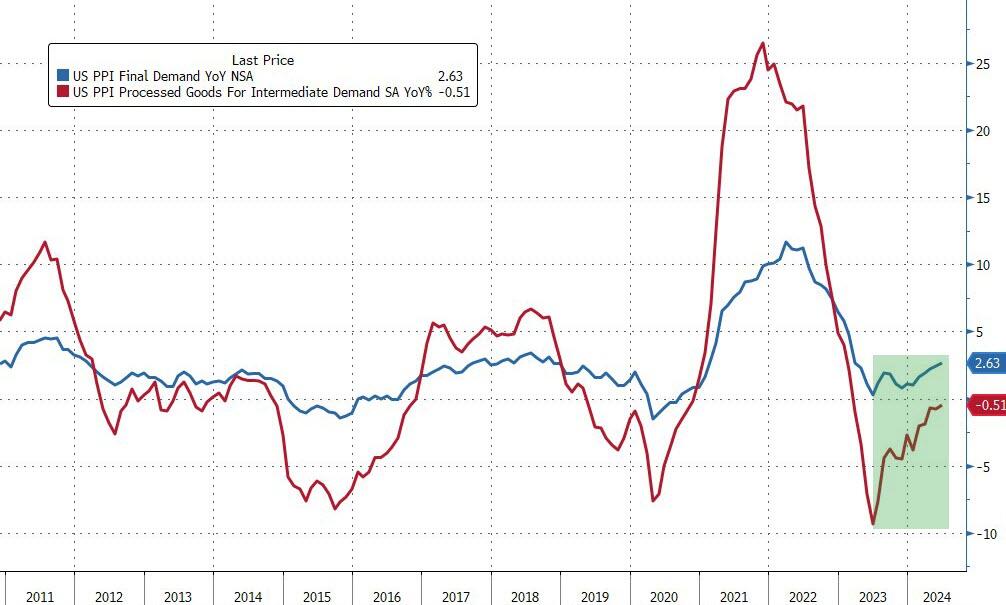
Perhaps worse still, the pipeline for PPI (intermediate demand) is accelerating…
Source: Bloomberg
On the housing side, buying conditions for housing tanks to all-time low.
Are you ready? You can tell an election is on the radar since inflation numbers are settling down for the most part. According to the BLS, overall inflation fell slightly in June to 3.0%.
Shelter CPI is up 5.14% YoY as M2 Money growth has been rising slowly … again.
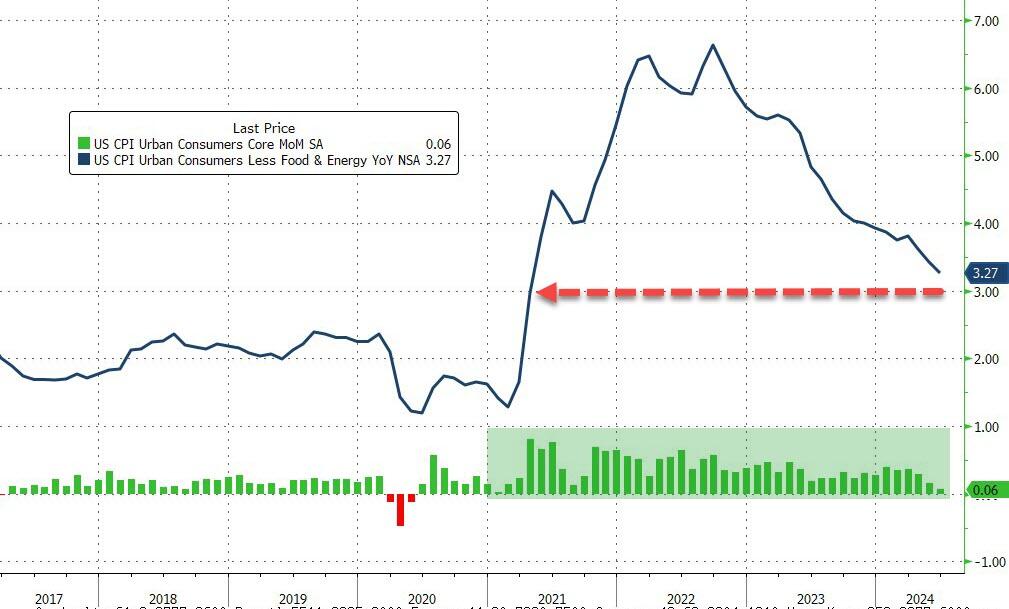
Core CPI also ‘missed’, rising just 0.1% MoM (vs +0.2% exp), dragging the YoY Core CPI down to +3.27% – its lowest since April 2021…
Source: Bloomberg
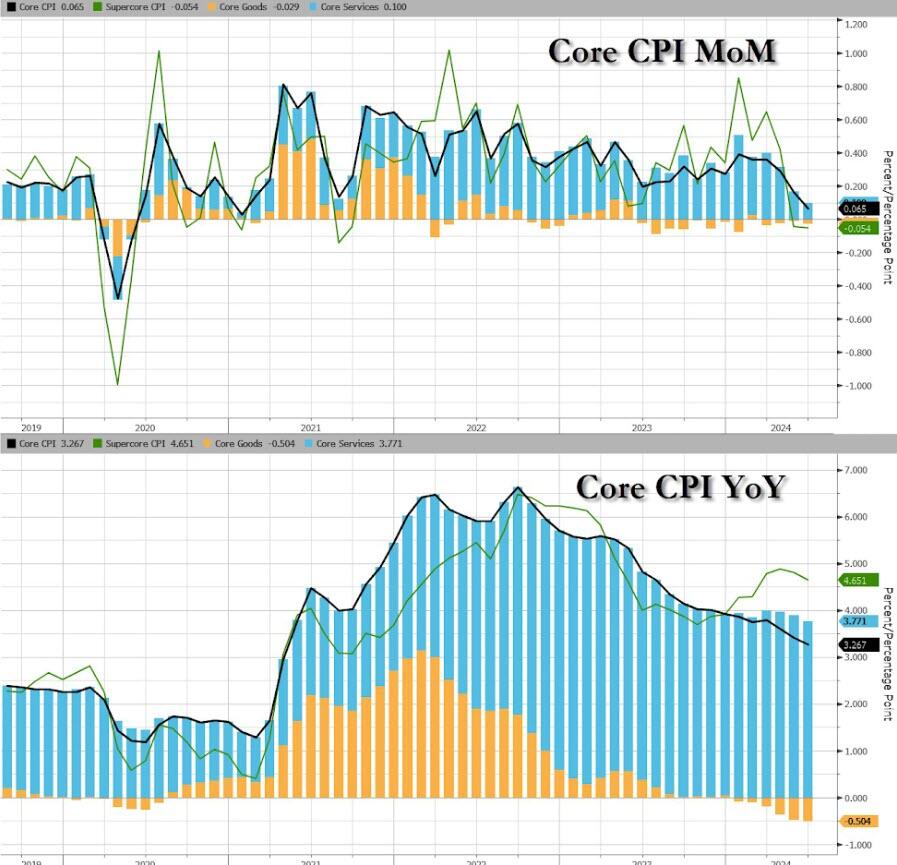
Goods deflation also dominates core prices disinflationary trend…
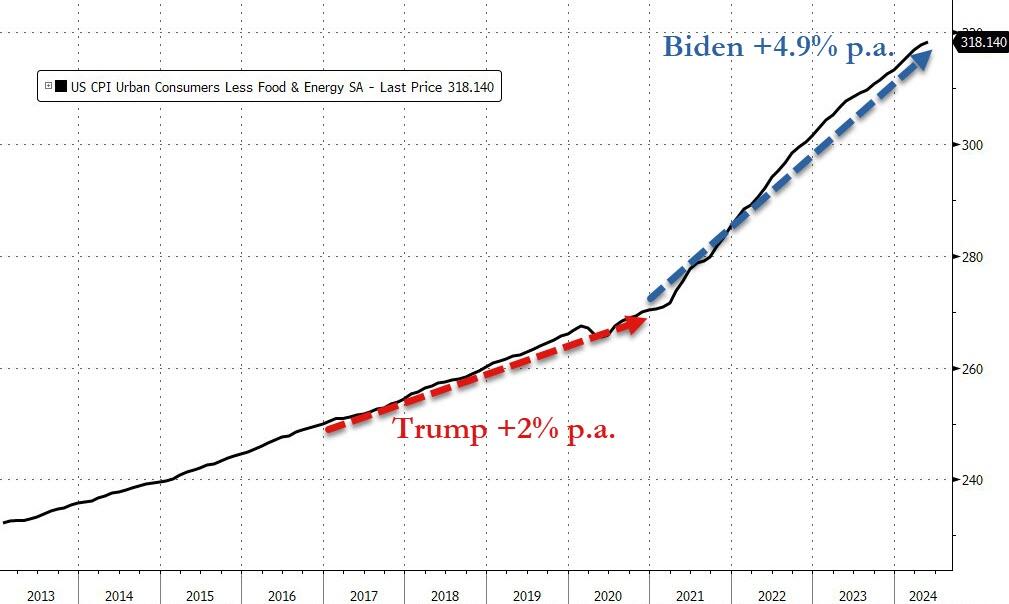
We do note that Core consumer prices have still not seen a single monthly decline since Bidenomics began.
Core consumer prices are up just under 18% since Bidenomics began (+4.9% per annum) – that is dramatically higher than the 2.0% per annum Americans experienced under Trump…
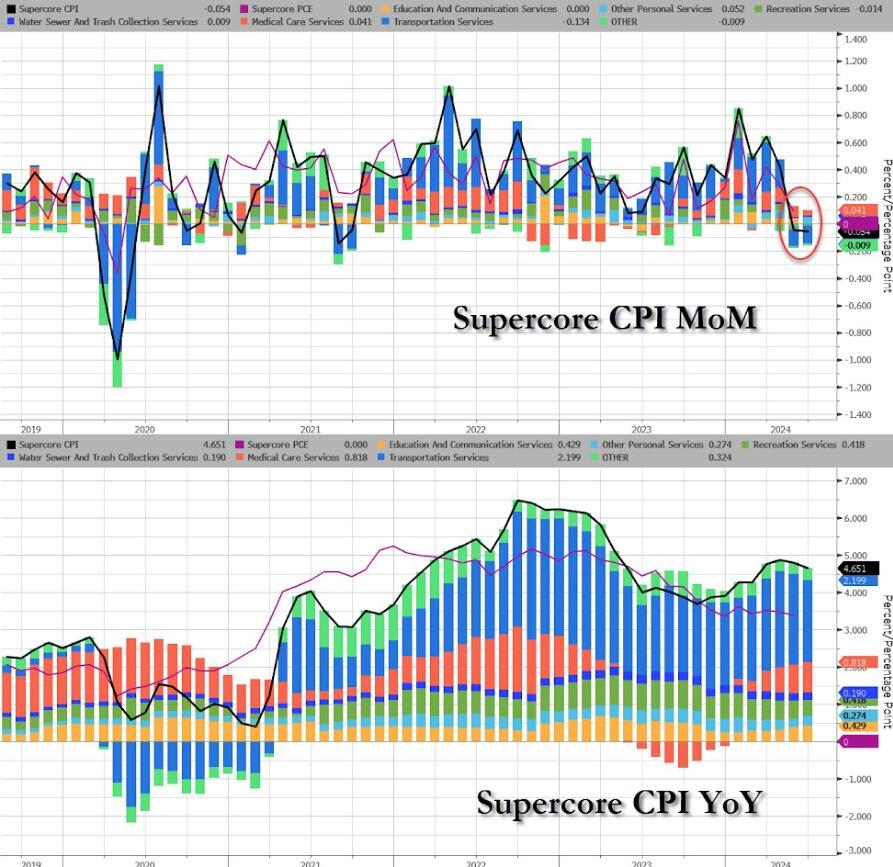
The much-watched SuperCore CPI rose on a MoM basis but declined (back below 5.0%) on a YoY basis (but obviously remains extremely elevated)…
Source: Bloomberg
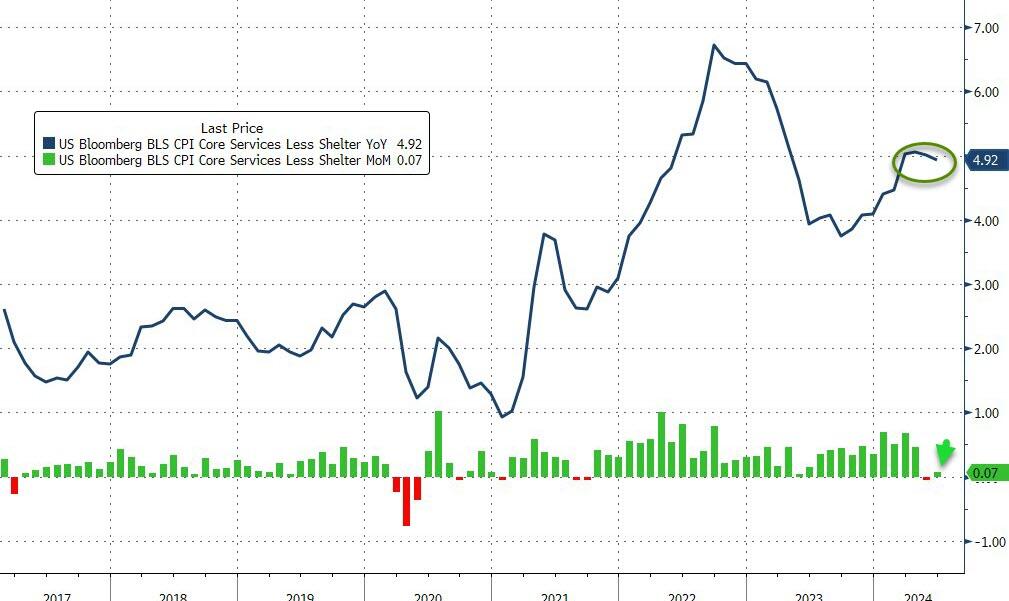
Transportation Services are seeing prices fall…
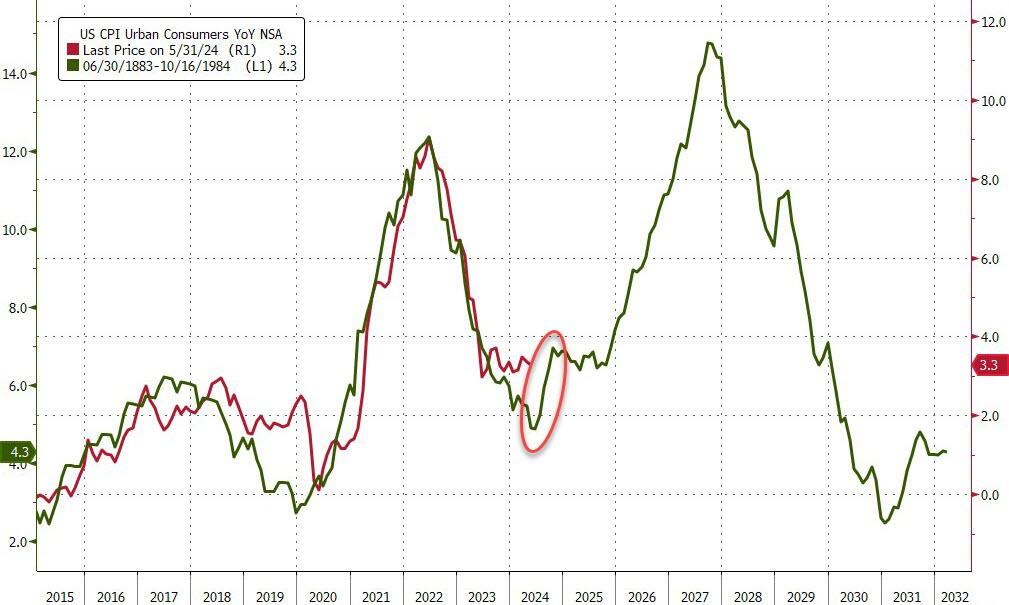
Finally, we can’t help but get a sense of deja vu all over again here. What if… The Fed cuts (because bad – recession – data), Biden loses (because dementia), and inflation re-accelerates (just like in the 80s)…
Source: Bloomberg
Challenger job cuts in construction we the highest since 2008 putting downward pressure on wages.
During the first three months of 2023, U.S. office vacancy topped 20 percent for the first time in decades. In San Francisco, Dallas, and Houston, vacancy rates are as high as 25 percent. These figures understate the severity of the crisis because they only cover spaces that are no longer leased. Most office leases were signed before the pandemic and have yet to come up for renewal. Actual office use points to a further decrease in demand. Attendance in the 10 largest business districts is still below 50 percent of its pre-COVID level, as white-collar employees spend an estimated 28 percent of their workdays at home.
A new report from Moody’s offers yet another grim outlook that the commercial real estate downturn is nowhere near the bottom. Elevated interest rates and persistent remote and hybrid working trends could result in around 24% of all office towers standing vacant within the next two years. The office tower apocalypse will result in more depressed values that will only pressure landlords.
“Combining these insights, with our more than 40 years of historic office performance data, as well as future employment projections, our model indicates that the impact on office demand from work from home will be around 14% on average across a 63- month period, resulting in vacancy rates that peak in early 2026 at approximately 24% nationally,” Moody’s analysts Todd Metcalfe, Anthony Spinelli, and Thomas LaSalvia wrote in the report.
In a separate report, Tom LaSalvia, Moody’s head of CRE economics, wrote that the office vacancy rate’s move from 19.8% in the first quarter of this year to the expected 24% by 2026 could reduce revenue for office landlords by between $8 billion and $10 billion. Factor in lower rents and higher costs, this may translate into “property value destruction” in the range of a quarter-trillion dollars.
In addition to remote working trends, Moody’s analysts pointed out that the amount of office space per worker has been in a “general downward trend for decades.”
At the peak of the Dot-Com boom, office workers used an average of 190 sq ft. The figure has since slid to 155 sq ft in 2023.
“The argument for maintaining or even increasing remote work practices remains compelling for many businesses,” the analysts said, adding, “If productivity remains stable and costs can be reduced by forgoing physical office spaces, the rationale for mandating in-office attendance diminishes.”
Related research from the McKinsey Global Institute forecasts that office property values will plummet by $800 billion to $1.3 trillion by the decade’s end.
Moody’s expects vacancy rates to top out as office towers are demolished or converted to residential ones in the coming years.
“Right-sizing will continue over the next decade as the market shakes out less efficient space for flexible floorplans that support our relatively new working habits,” they said.
Earlier this year, Goldman analyst Jan Hatzius pointed out that a further 50% price decline would make office tower conversions financially sensible.
The jointly signed letter, first reported by Axios, says the economic agenda of U.S. President Joe Biden, a Democrat, is “vastly superior” to Trump’s, the former Republican president seeking a second term.
Read the source article from Reuters for the rest of the Marxist clown show. What Joe Stiglitz and other Leftist economists are cheerleading in the excessive post Covid spending spree that Biden and Congress went on. There is a different between a free market system and government directed spending, usually on large donors.
One source of crippling inflation under Biden is (wasteful) government spending, up 37.7% under Biden. Federal debt is up a nauseating 50% under Biden. These levels of spending and debt are NOT sustainable!
Another souce of inflation under Biden has been The Federal Reserve. With Covid. The Fed entered like gangbusters dropping their target rate to 25 basis points and massively increasing their balance sheet. Call this BIDEN 1. Then to squelch inflation, The Fed raised their target rate and slowly started to unwind the balance sheet. We saw a slowing of inflation. Nothing to do with Biden, although I am sure he will take credit for it at Thursday’s debate with Trump.
Inflation was growing rapidly in Biden 1, but inflation started to slow (Biden 2) as The Fed rapidly raised their target rate.
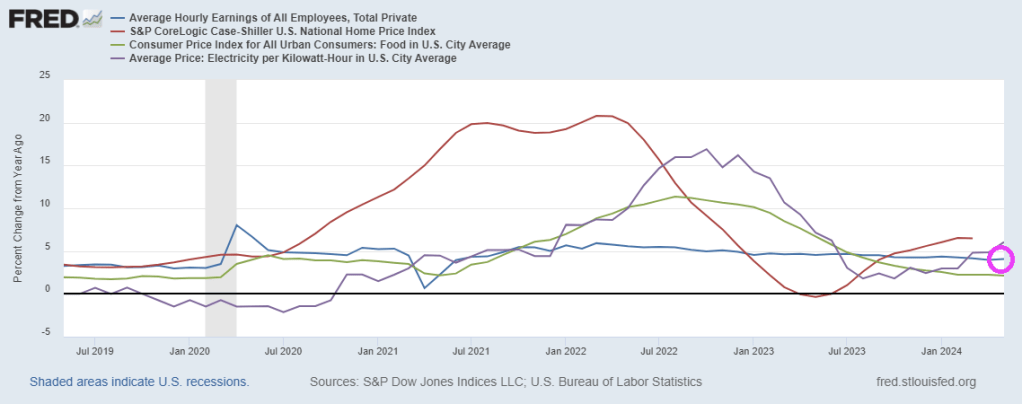
US Treasury Secretary (and former Fed Chair) Janet Yellen says the US economy is in excellent shape. Is she a genius and sees something that rest of us don’t? Or is she a partisan thug like Shap Shot’s Gilmore Tuttle?
Yellen brags about rising wages and declining inflation. Well, average hourly earnings YoY are now 4.1%. However, home prices are growing at 6.5% year-over-year (YoY) and electricity prices are up 6.1% YoY. Food CPI grew at 2.1% in May. Yellen ignores the string of 10%+ increases in 2022-2023 making eating unaffoprdable for millions.
I doubt if Yellen could run a lemonade stand in my neighborhood. But like Gilmore Tuttle, maybe she could run a donut shop!
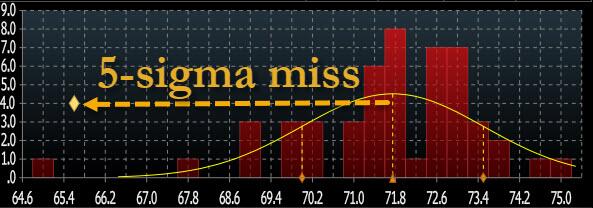
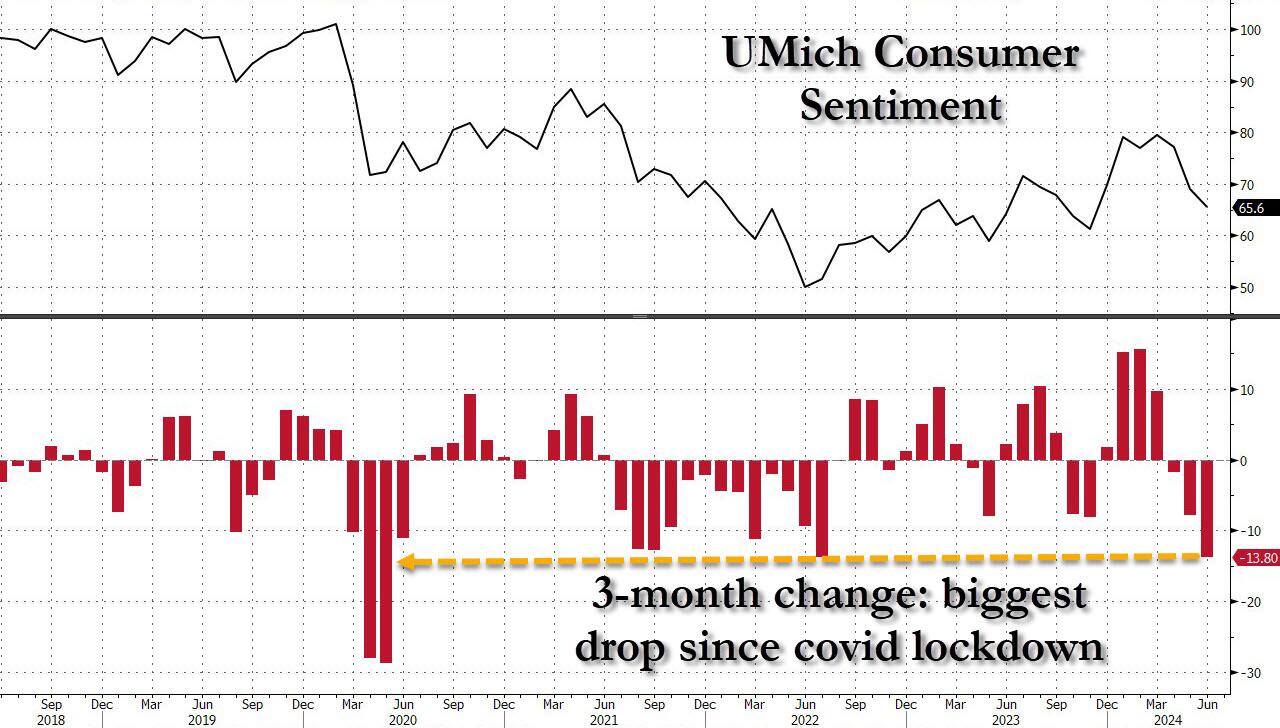
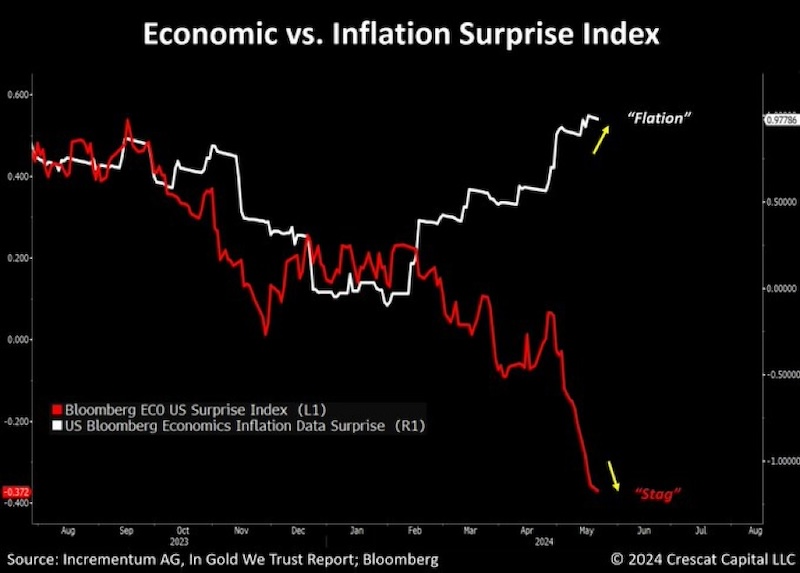
One month after the May Consumer Sentiment printed at a record 7-sigma miss to expectations, consumer sentiment once again “unexpectedly” slumped, this time from an upward revised 68.8 to 67.6, the lowest print since last November, and the biggest 3-month drop in sentiment (-13.8 points) going back to the covid lockdowns.
… which was not only a 5-sigma miss to the median estimate (an improvement from last month’s 7-sigma)…
… but also the biggest miss of 2024.
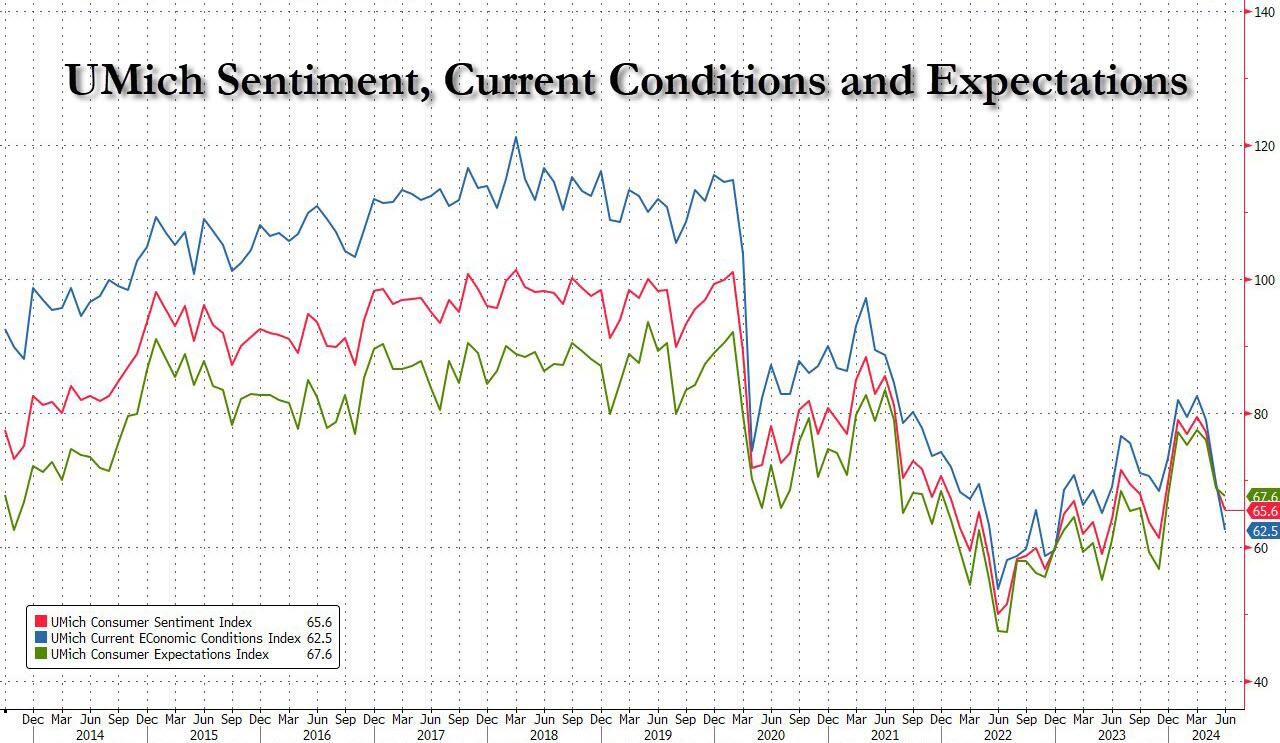
The collapse in sentiment was broad based, and hammered both current conditions – which plunged from 69.6 to 62.5, the lowest since 2022 and badly missing estimates of 72.2 – and also expectations, which dropped from 68.8 to 67.6 (and also far below the 72.0 estimate).
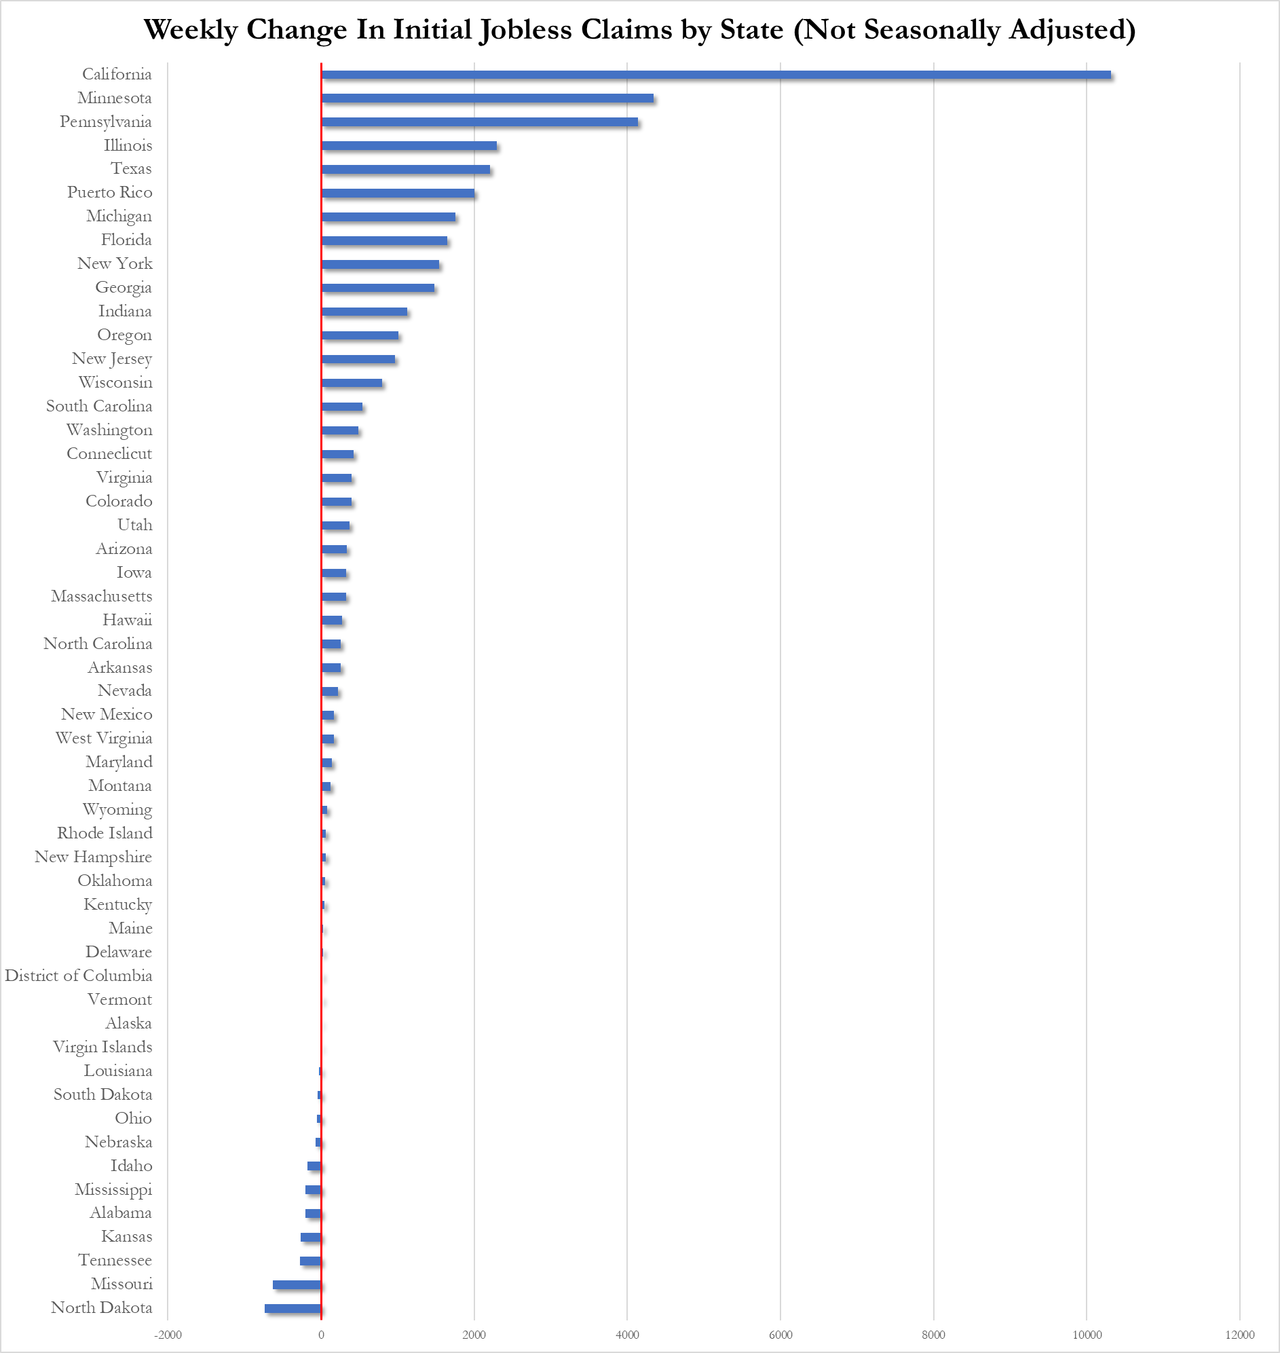
The decline in sentiment coincides with signs that the labor market, which has driven consumer spending over the last year, is also falling apart. The unemployment rate rose to 4% last month, the highest in more than two years, while jobless claims unexpectedly soared following a firing frenzy out of California.
“While lower-income families have, as a group, seen notable wage gains in a strong labor market, their budgets remain tight amid continued high prices even as inflation has slowed,” Joanne Hsu, director of the survey, said in a statement.
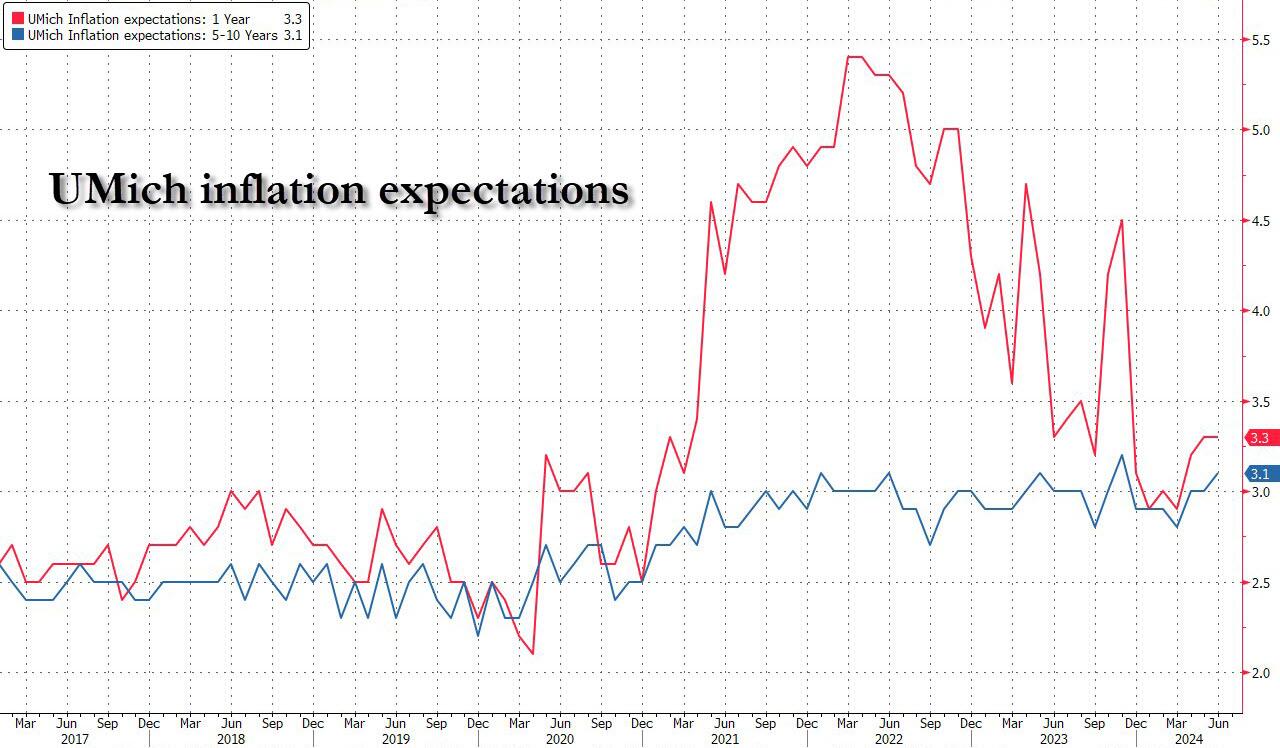
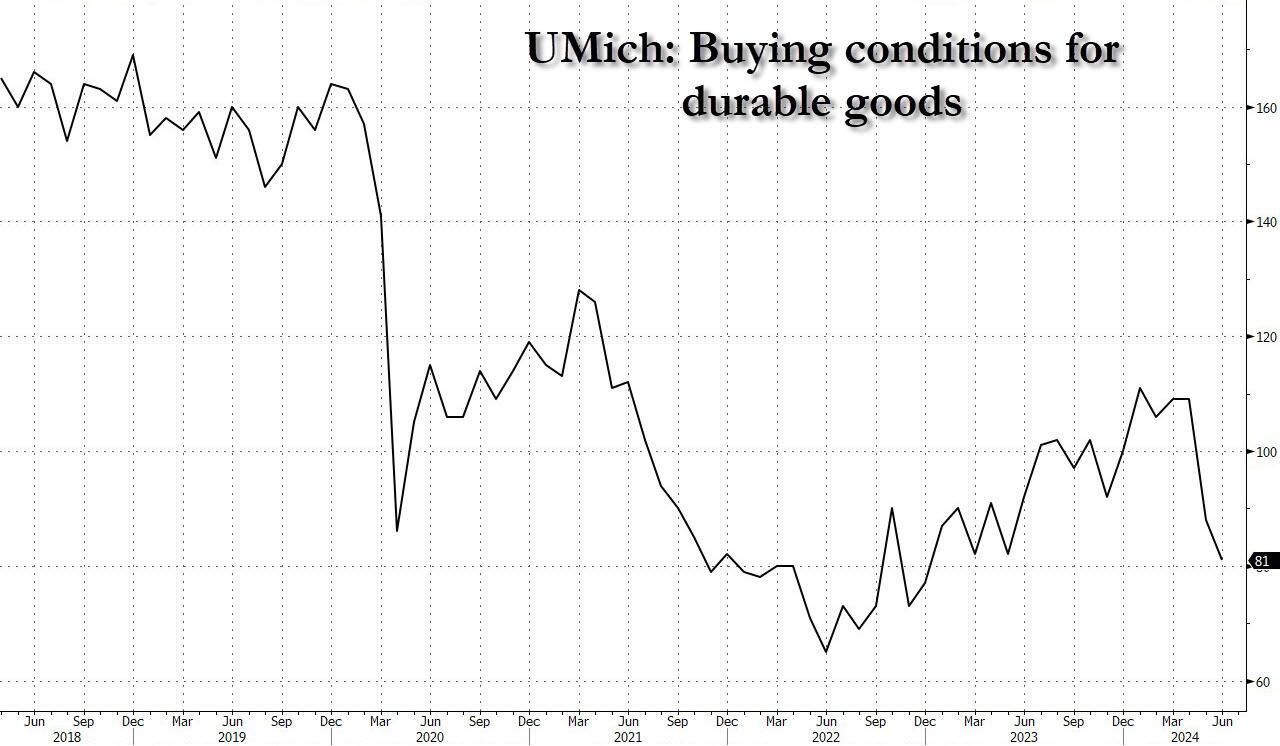
But wait there’s more, because if that was the “stag” part of the report, the UMich report also confirmed that the “flation” isn’t far behind, as the inflation outlook continued its recent deterioration, to wit: 1 Year inflation expectations remained unchanged at 3.3%, beating estimates of a drop back 3.2%, while 5-10 Year inflation expectations rose from 3.0% to 3.1%, the highest since November.
If that wasn’t enough, the slide in sentiment suggests restrained consumer demand in coming months. The university’s measure of buying conditions for durable goods decreased to the lowest level since December 2022, a glowing testament to just how tapped out the US consumer truly is.
In short: the verdict for Bidenomics is in, and it’s a complete disaster, as for Powell’s recent laughable comment that he can’t see the “stag” nor the “flation”… well, Fed chair, they just bit you on the ass.
On top of a poor consumer sentiment report, the PPI Final Demand index was down … again.
Joe Biden is a dishonest politician, so it is no wonder that he ignores actual data. Like claiming that crime is down under his leadership, when it is actually large cities like New York and Los Angeles not reporting their crime data to the FBI.
Take the May jobs numbers. The BLS reports that 272k jobs were added. However, the more accurate Household Survery reported a loss of -408k jobs in May.
While the Establishment Survey did indeed report that 272K “jobs” were added, this number also included multiple job holders; stripping those out, we get that the actual number of “employed” workers plunged by -408K.
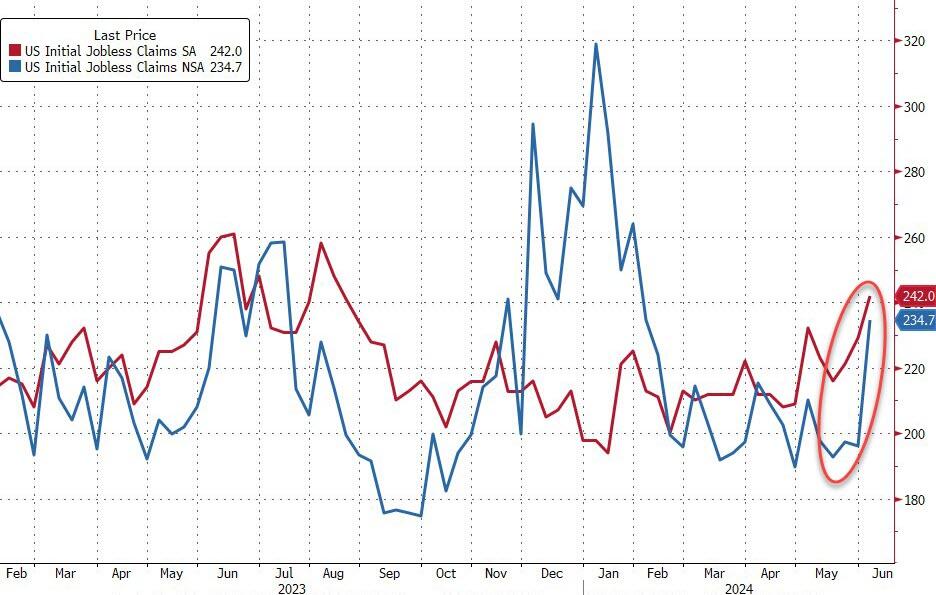
On the jobless claims side, the number of Americans applying for jobless benefits for the first time surged last week to 242k (up from 229k and well above the 225k exp). That is the highest since August 2023…
Source: Bloomberg
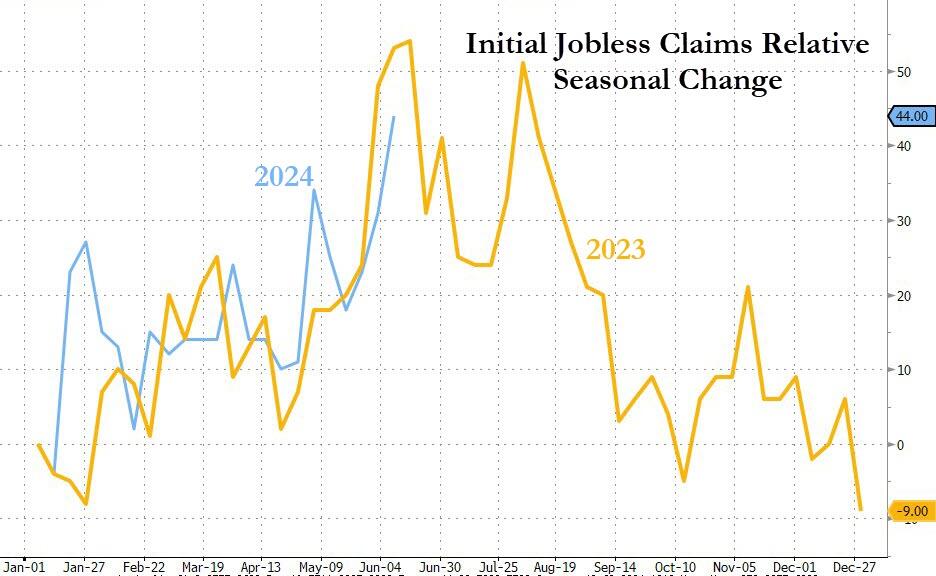
On an NSA basis, claims exploded higher.
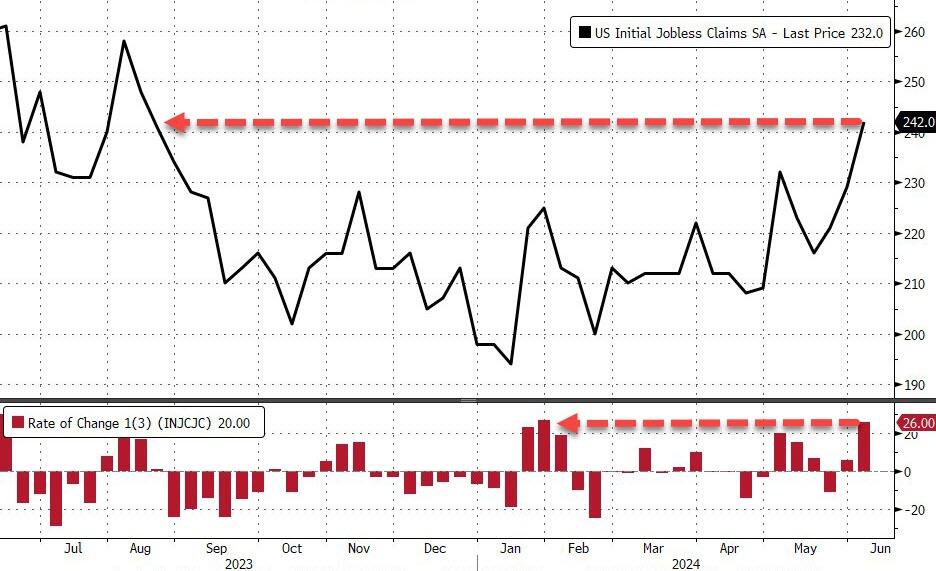
The last three weeks have seen the largest surge in claims since January…
Source: Bloomberg
Notably this surge is very VERY similar to what we saw last year (but not the prior few years, so not a ‘seasonal’ pattern per se)…
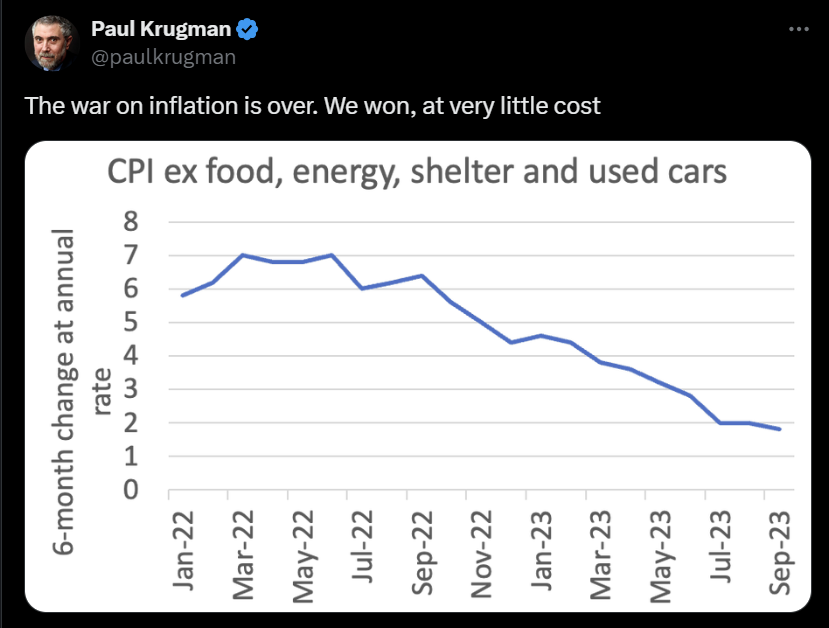
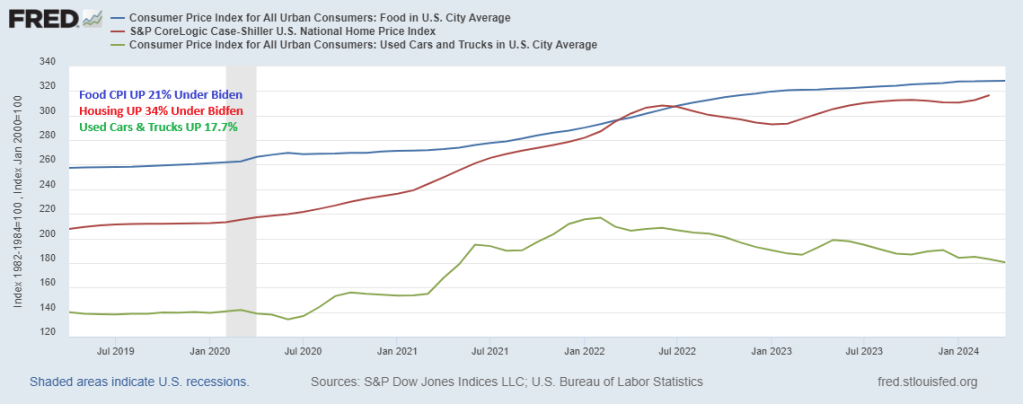
Back in 2023, Socialist Paul Krugman declared that “the war on inflation is over!!! “We” won, at very little cost.” I love when elitists claim “We won!” since clearly 99% of Americans lost since food, housing and car prices up are double digits under Biden.
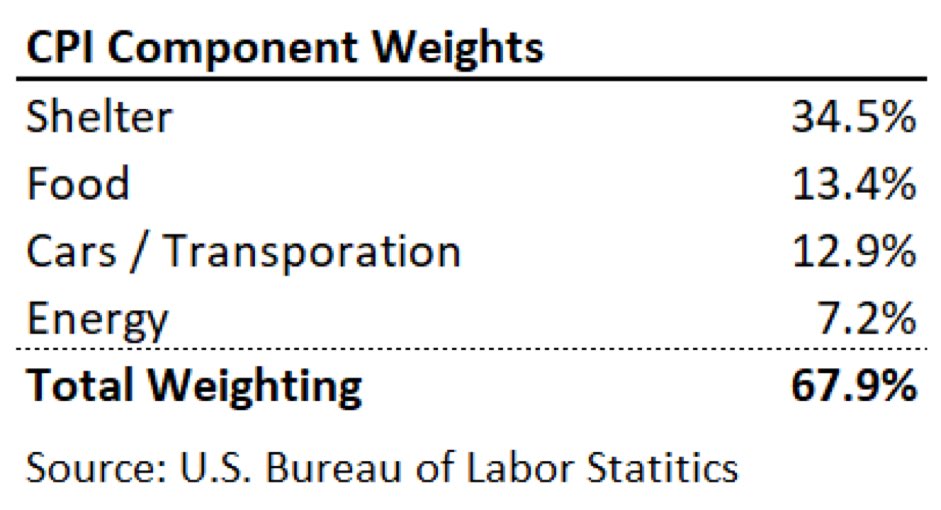
The problem is that food, energy, shelter, and used cars/trucks are a huge part of Americans consumption basket.
Under Biden, food CPI is up 23%. Home prices are up 34% and used cars/truck prices are up 17.7%.
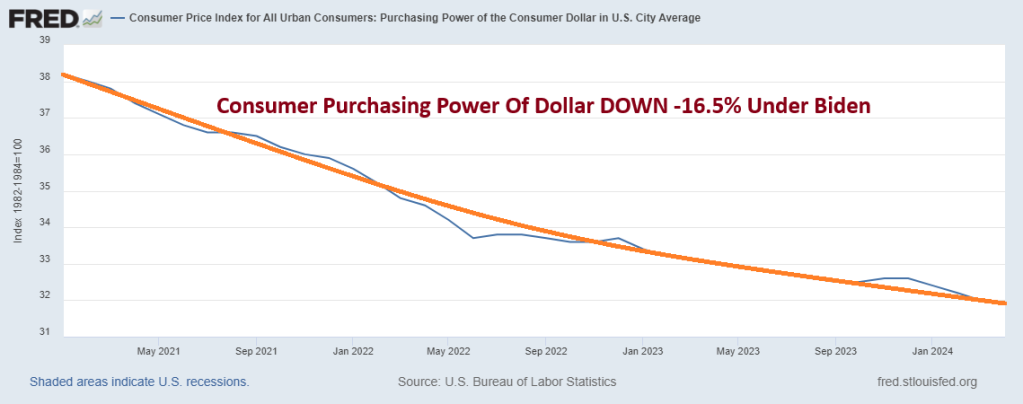
A note to Paul Krugman, YOU may have won, but the rest of Americans lost. Consumer purchasing power of the US Dollar is DOWN 16.5% Under Biden.
It turns out unionized employees extorting you on labor costs while the government mandates you produce a money-losing product isn’t a combination that leads to prosperity and profit. Go figure.
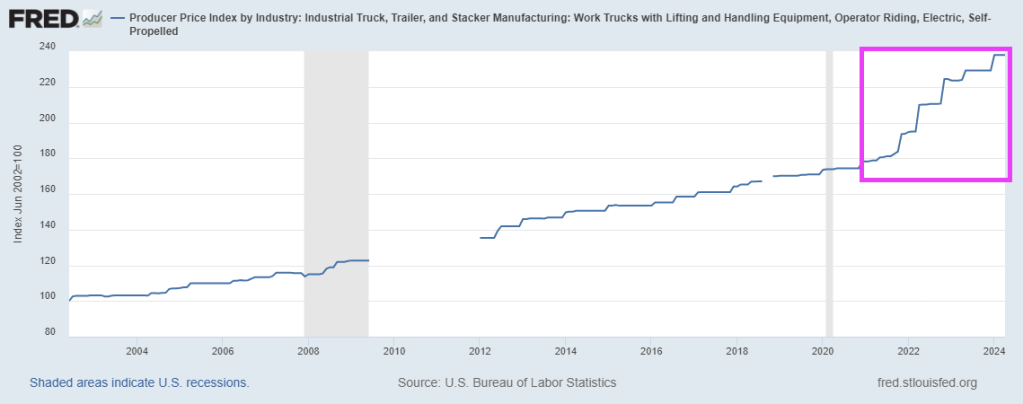
Now, it isn’t just car manufacturers that are balking from the idea of all electric vehicles: the trucking industry, once expected to eventually make the shift to all electric as well, is seeing tepid demand for new rigs, according to a new Wall Street Journal article.
Of course, the producer price index for electric trucks and equipment has soared under Biden (like everything else). PPI for electric trucks and equipment are up 33.6% under Biden and his disastrous green energy fiasco.
“The economics just don’t work for most companies,” Robert Sanchez, the chief executive of Ryder, said earlier this month.
Ryder’s experience highlights the difficulties state and federal governments encounter in encouraging truckers to transition from polluting diesel rigs to zero-emissions vehicles, the report says.
It also indicates that significant improvements in battery weight, range, and charging times are necessary for battery-electric trucks to effectively compete with diesel rigs in the cost-sensitive freight industry.
Rakesh Aneja, head of eMobility at Daimler Truck North America, told Wall Street Journal: “Quite frankly, demand has not been as strong as what we would like.”
Aneja said orders for its Freightliner eCascadia battery-electric semi truck are about the same this year as they were in 2023.
Battery-electric trucks are about three times more expensive than diesel rigs, the Journal notes. And while federal and state programs help offset purchase costs, significant hurdles remain due to high operating costs and setup challenges.
Truckers find these electric trucks difficult and costly to run, with installation of on-site charging facilities taking years. These trucks travel less than half the distance of diesel rigs per charge and require several hours to recharge.
Ryder launched a service a year ago to assist companies in setting up and maintaining battery-powered fleets. So far, it has sold only 60 vehicles, mostly light-duty trucks. Three companies use five battery-electric heavy-duty trucks, but only within yards for shuttling trailers.
Sanchez noted that unlike individual electric car buyers, companies will only switch to battery-electric trucks when they can compete with diesel on operational costs.
The cost of changing a fleet over is also expensive. Using data from 13,000 vehicles, Ryder analyzed the annual operating expenses of battery-electric commercial trucks and found they are significantly higher than those of diesel rigs. The analysis, assuming existing fast-charging infrastructure, considered costs like vehicle purchase, maintenance, labor, and fuel.
Ryder found that light-duty battery-electric vans increase annual operating costs by several percentage points, with the gap widening for heavier trucks. Operating battery-electric big rigs costs about twice as much annually as diesel trucks.
In California, converting a fleet of 25 commercial vehicles, including 10 heavy-duty trucks, from diesel to battery power would raise annual operating costs by 56%, or $3.4 million. In Georgia, the increase would be 67%, or $3.7 million. Ryder stated that these higher costs would add 0.5% to 1% to inflation.
The American Trucking Associations said of the U.S. EPA’s new rules mandating more BEV semi truck sales by the end of the decade: “Considering that 96% of U.S. trucking companies operate 10 or fewer trucks, these mandates are simply cost-prohibitive for most truckers.”


You must be logged in to post a comment.