The West Is A Mess! US Home Prices Decline From 2022 Peak Most In The Western US (SF Down -13%, Seattle Down -11.3%, Phoenix Down -10.5%)

Black Knight’s December Mortgage Report is out and the house price graphs show the west is a mess.

While much of the US is down from 2022 peaks in home price. but it is The West where home prices are down the most (just like 2008 where the Inland Empire of California, Phoenix and Las Vegas crashed in term of home prices).

At least Columbus Ohio is down only -2.1% from the 2022 peak. While Austin TX is down almost -10% from 2022 peak.

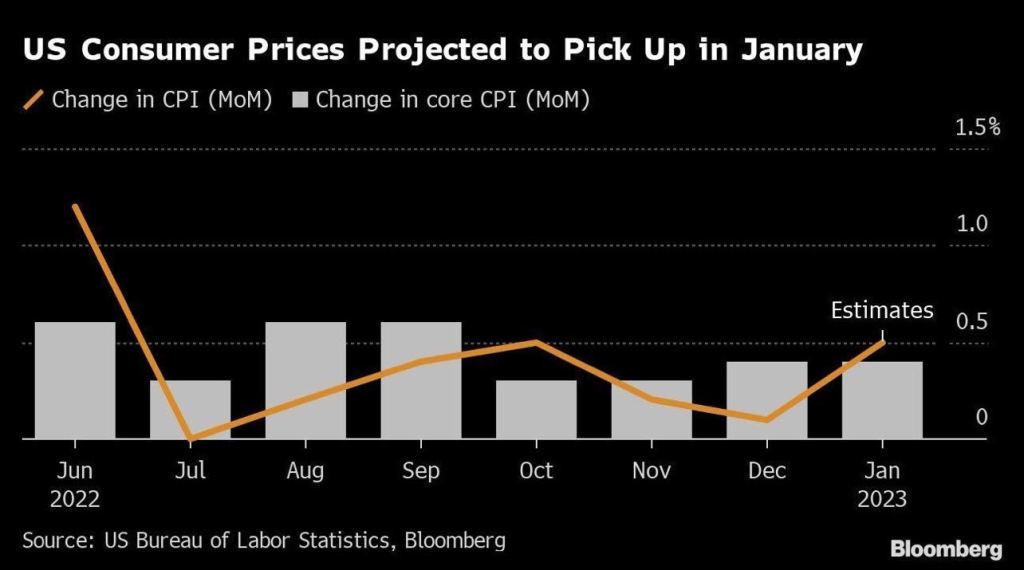
US inflation numbers are out tomorrow. Let’s check on home price and rent growth tomorrow. But the forecast for January inflation is a increase.
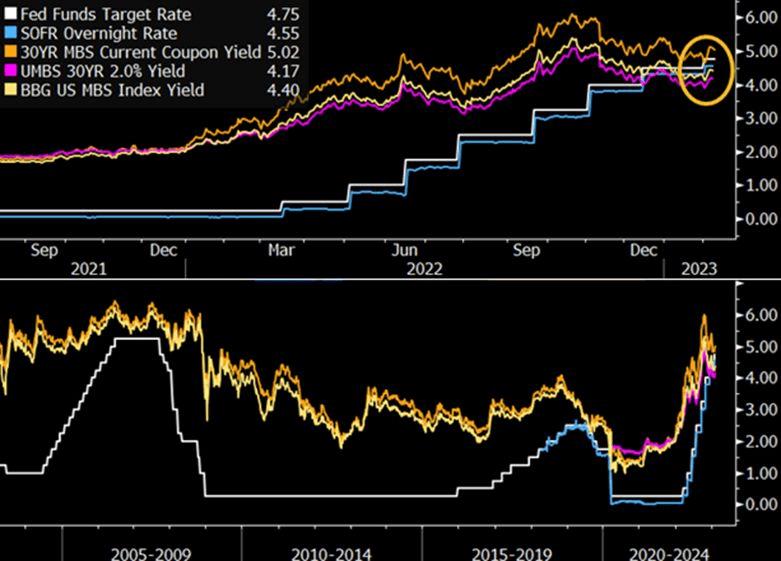
Fed Tightening Pushed Fed Funds Target Rate Above MBS Yields For First Time In History (Biden Administration Ready To Unleash A $27 Billion Green Slush Fund)

The most recent tightening by the Federal Reserve has pushed the federal funds target rate above mortgage-backed securities yields for the first time in history. Though this poses clear challenges of carry for MBS holders, selective investments in specified pool and collateralized mortgage obligations (CMOs) could provide incremental returns.

While Biden brags (redundant) about lowering inflation (that his energy policies and massive Federal spending caused), apparently he never learns. Now we learn from Mish that the Biden Administration is ready to unleash a $27 billion green slush fund on the US middle class.

Inflation started under Biden, but the massive expansion in money supply (M2) begin with Covid in 2020.

Once this latest spending splurge kicks in, we will see rising inflation again. After all, Biden and Congress have gotten the taste for massive spending bills (like vampires) and spending likely won’t slow down.

Don’t Be Misled By The Low US Unemployment Rate, It Goes Low Just Prior To A Recession (Treasury Curve Remains Deeply Inverted, Mortgage Rates Rise)

Biden’s State of the Union address saw him bragging about his record job creation (actually, it was the private sector, not Biden than created jobs) and historic unemployment rate. What Biden didn’t mention (along with not discussing the porous Mexican border with fentanyl pouring across or why he failed to shoot down a Chinese spy balloon until after it has passed over numerous military reservation) is that the unemployment rate always hit a low point just prior to a recession.

So, here we sit at 3.4% unemployment. But we also see the US Treasury yield curves (10Y-3M and 10Y-2Y) remaining deeply inverted.

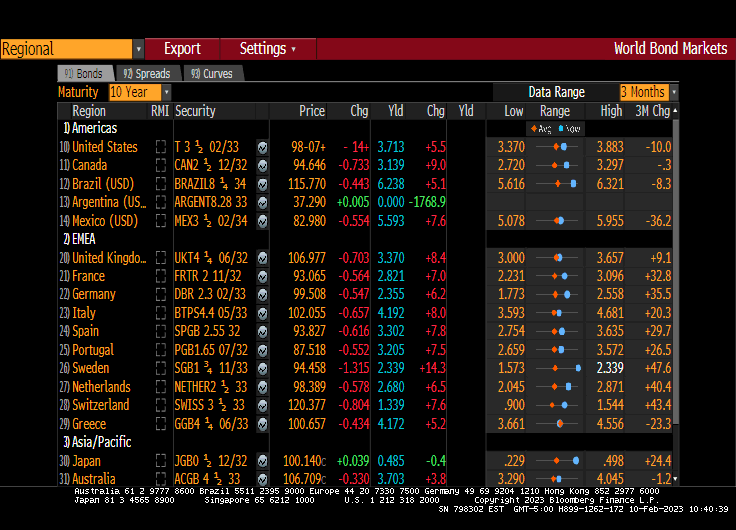
The US Treasury 10-year yield is up 5.5 basis points today.

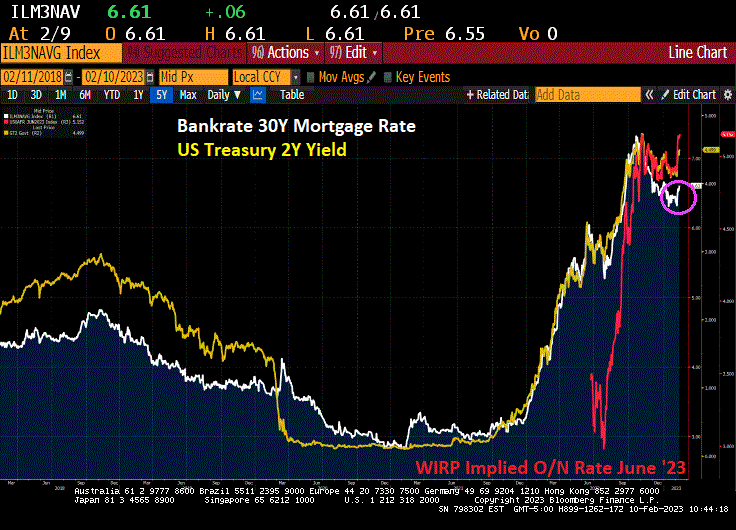
And Bankrate’s 30-year mortgage survey rate is up slightly today.

Help US, McCarthy! Price of Insuring Against US Debt Default Remains Elevated As No End In Sight (Effective Rate Of Interest On US Mortgage Rate Rises)

Everyone seems to have amnesia about Joe Biden’s hatred of Social Security and Medicare. He has tried to cut Social Security, Medicare and Veteran’s benefits as a US Senator. In addition, it was Biden that led the charge to TAX Social Security benefits for seniors. Now Biden has pivoted and is claiming that Republicans are the ones that want to cut Social Security. Wow. Biden simply goes where the political winds blow.

Here is where we set today. The cost of insuring for a US debt default remains elevated as the US has hit its statutory debt limit. This is happening at the effective rate of interest on US mortgage debt is rising.

Help us McCarthy! Because Biden and Schumer don’t want to cut ANY spending.

We need somebody like Mr. Garvey from Key and Peele to lead the debt ceiling debate.

But never fear! Congress LOVES to spend your money, so will eventually raise the debt ceiling.

Just Like The Fed! Despite Cooling Inflation, Forecasts Of Fed Rate Hikes Increase To Peaking In July 2023

It’s just like The Fed to ignore what is going on and do something else.

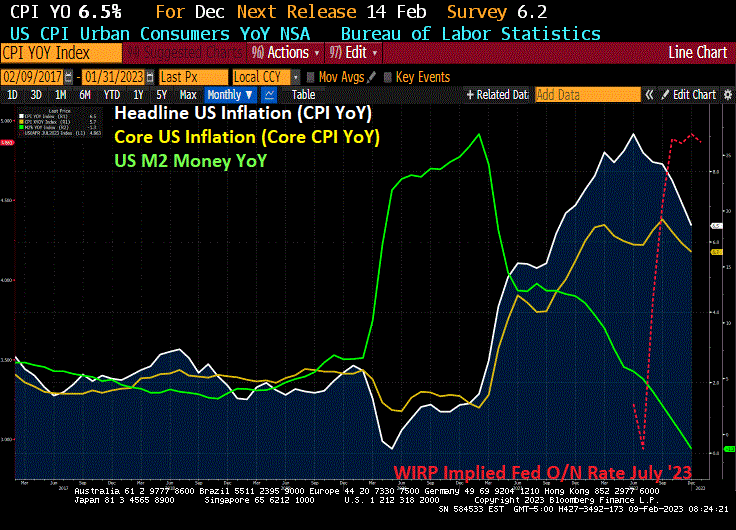
The one statement that Biden made in his State of the Union Address that was factually accurate was that inflation is coming down. Of course, he then blew it by saying he inherited inflation from Trump which was not true. Headline inflation (CPI YoY) was only 1.4% when Biden was sworn-in as President and rose to 9.1% YoY by June 2021 before finally starting to decline.

But despite the cooling of inflation (and M2 Money growth), The Fed seems hell bent on increasing their target rate, now forecast by Fed Funds Futures to peak in July 2023 at 5.123% before pivoting.

The Fed’s themesong. Drinking with my low-companions, dancing with a woman that’s not my wife, laughing at a joke I’ve heard before, welcome to a night in their life.

The Tighten Up! Banks Tightening Credit Boxes As Median Age Of US Homebuyers Rises From 31 To 47

The Federal Reserve is doing Archie Bell and The Drells “Do The Tighten Up!”

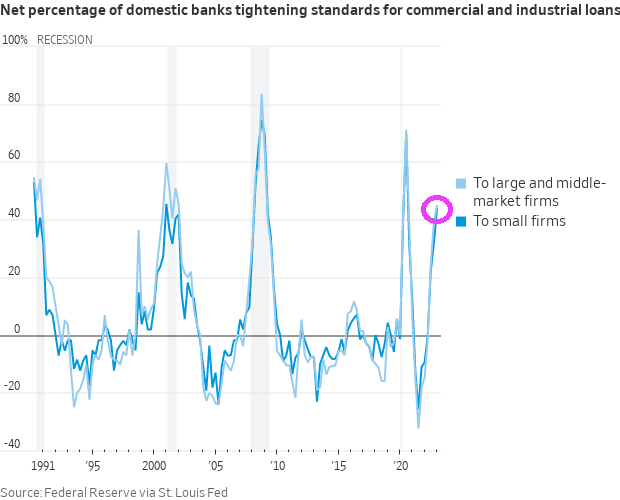
Over the fourth quarter, significant net shares of banks reported having tightened standards on C&I loans to firms of all sizes.

Banks also reported having tightened all queried terms on C&I loans to firms of all sizes.

Actually, banks are tightening standards across the various credit boxes.

And as banks tighten up their credit box, we are seeing the median age of US homebuyers rising from 31 to 47 years.

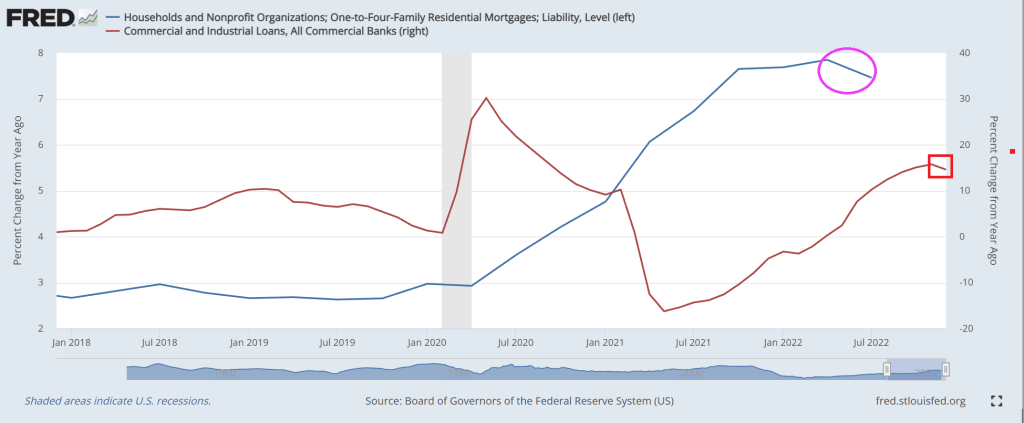
As banks tighten, we are seeing a slow down in the growth rate for C&I lending and 1-4 unit mortgage lending.

This is reminding me of Germany where you save for your entire life to buy a home.

Somehow, I don’t think Biden will mention any of this is his State of the Union address tonight.

Challenger Job Cuts Rise 440% In January As Fed Liquidity Shrinks (US Treasury 10Y Yield Down -3.5 BPS)

President Biden had better give his State of the Union Address before the economy worsens any more.

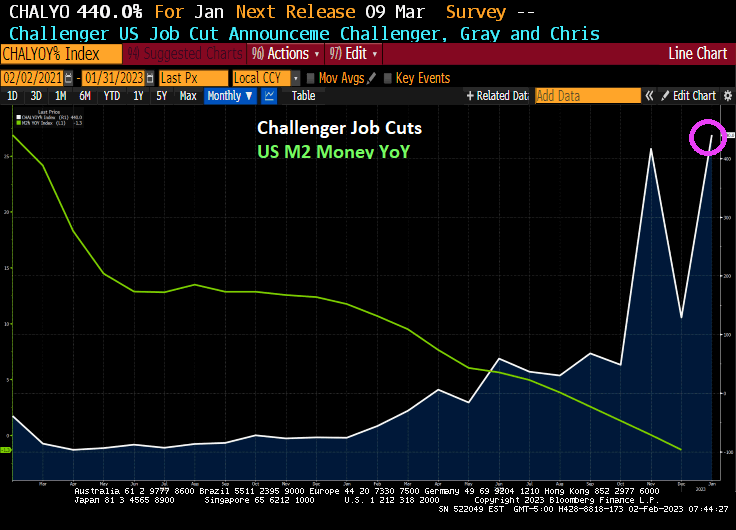
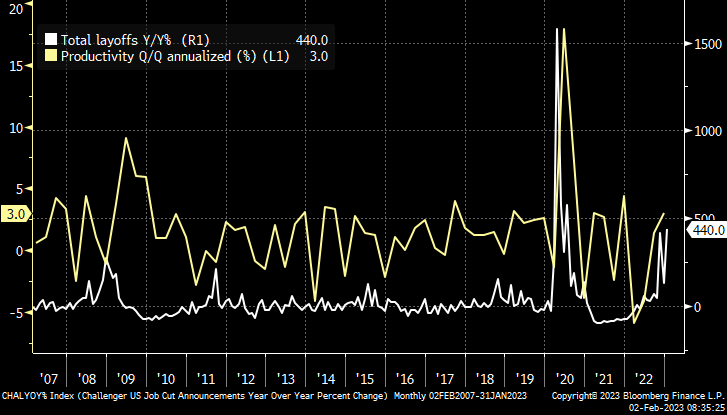
In January, the Challenger, Gray and Christmas jobs cuts index was a doozy. Jobs cuts rose 440%. This is happening as The Federal Reserve keeps its feet on the monetary brake pedal.

The Challenger report shows a big jump of 135.8 percent in layoff intentions to 102,943 in January, up from 43,651 in December and 440.0 percent higher than the 19,064 in January 2022. Many of the job cuts are in the tech sector, but job cuts are now spreading across the economy as a recession looms.

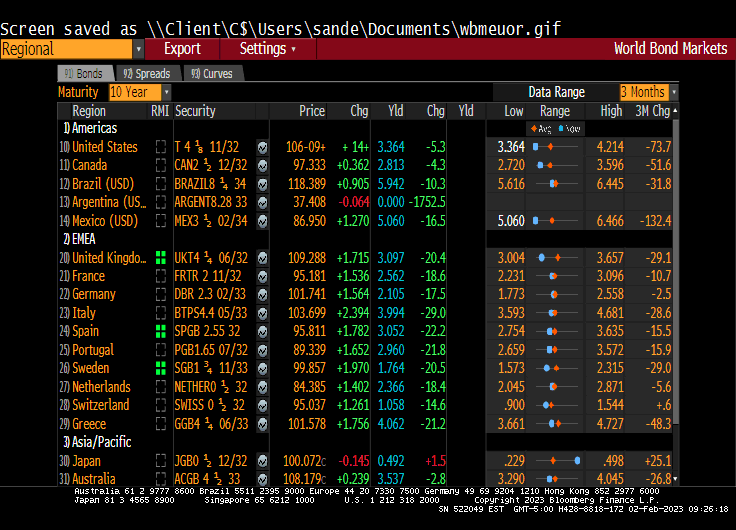
This morning, the US Treasury 10-year yield is down only -3.5 basis points, but it is Europe where the action is. UK is down -16.2 basis points and Italy is down -14.8 bps. UPDATE: US 10Y yield down -5.3 BPS, Italy 10Y down -29 bps.

US Mortgage Applications Drop 9% From One Week Earlier, Purchase Apps Up 7% From Previous Week But Down 41% From Same Week Last Year

The January mortgage applications book is closed. And we are off to another year of rising applications until May. Then the downhill slide.

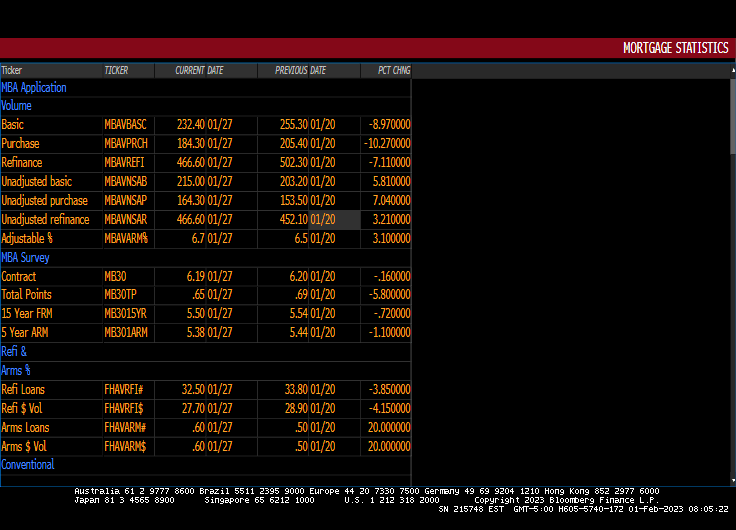
Mortgage applications decreased 9.0 percent from one week earlier, according to data from the Mortgage Bankers Association’s (MBA) Weekly Mortgage Applications Survey for the week ending January 27, 2023.

The Refinance Index decreased 7 percent from the previous week and was 80 percent lower than the same week one year ago. The seasonally adjusted Purchase Index decreased 10 percent from one week earlier. The unadjusted Purchase Index increased 7 percent compared with the previous week and was 41 percent lower than the same week one year ago.

US mortgage rates have been steadily declining since November 2022.

Happenings Two Months Time Ago! US Case-Shiller National Home Price Growth Slows To 6.77% YoY In November As Fed Retreats (Down -0.54% Since October, 5th Straight Month Of MoM Price Declines)

The Case-Shiller index is out for November 2022. Too bad it is January 31, 2023. Call it “Happenings 2 Months Time Ago.”

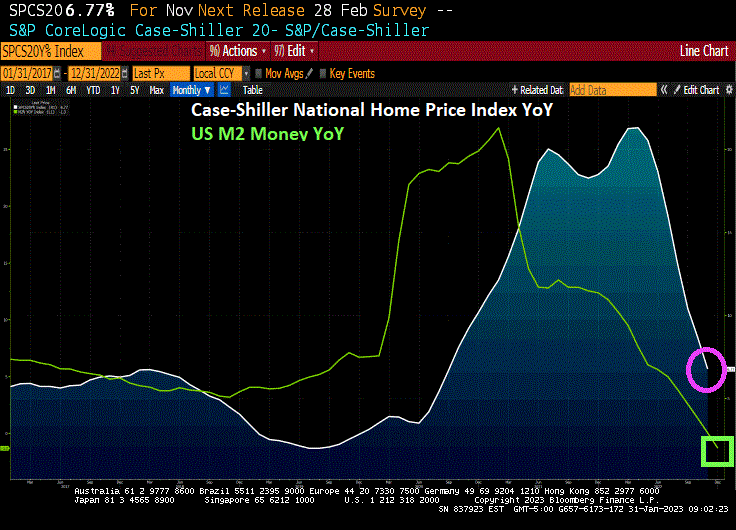
On a year-over-year (YoY) basis, the Case-Shiller National home price index slowed to 6.77%. On a month-over-month (MoM) basis, the CS National index fell -0.54%. That is the 5th straight month of home price declines.

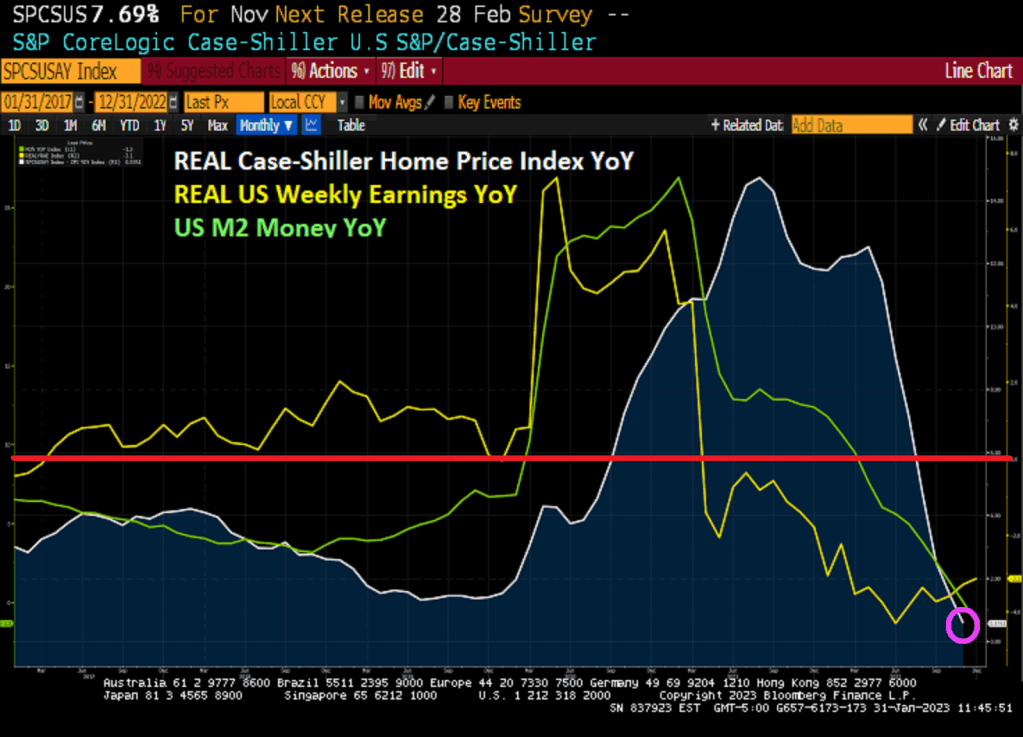
In REAL terms, the Case-Shiller National home price index is up only 0.58% YoY as REAL Weekly Earnings growth is negative at -3.1% YoY.

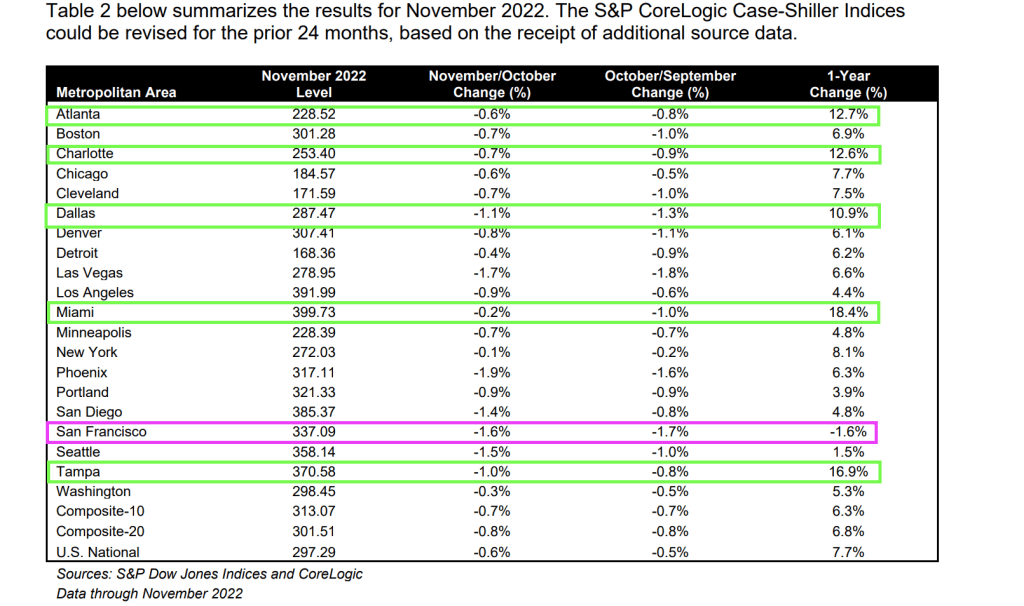
Only San Francisco fell on a YoY basis (down -1.6%). Five metro areas were above 10% and they are all in the South. Atlanta, Charlotte. Dallas, Miami and Tampa.

On MoM basis, every metro area in the Case-Shiller 20 index saw price declines from October to November.

Another sign of a crumbling market.

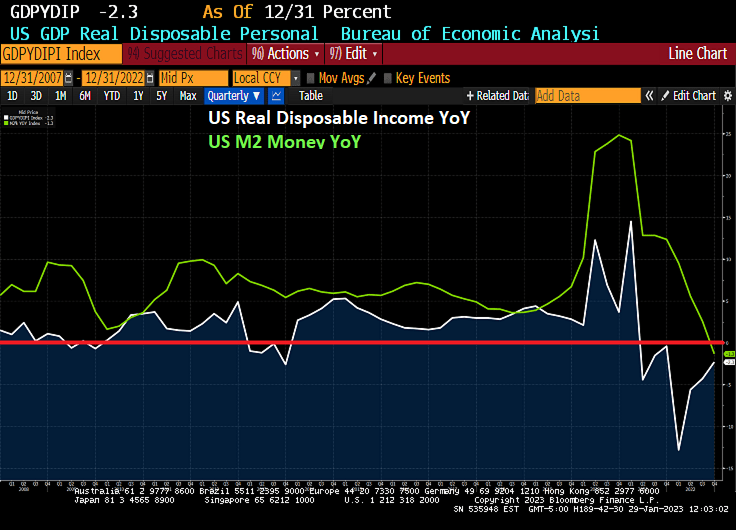
7 Months Of Night! US GDP Real Disposable Income Fell For 7 Straight Months As Fed Removes Punchbowl (Biden’s Economy Lost $4 TRILLION In Real Disposable Income Since March 2021, A -21% Loss)

Welcome to the wonderful world of Bidenomics, giving the US 40 year highs in inflation leading The Federal Reserve to remove its enormous monetary stimulus (known as “The Punch Bowl.”

I previously pointed out that US Real GDP was actually less than 1% year-over-year (YoY) in 2022, hardly a fantastic number given the trillions in Biden/Pelosi/Schumer spending (Omnibus, Infrastructure, etc) and Powell/Fed’s whopping monetary stimulus in 2020. But real disposable income, the amount households have left to spend after adjusting for inflation, had been falling for 7 straight months.

In fact, REAL disposable personal income peaked in March 2021, shortly after Biden was sworn-in as President in Janaury 2021 at $19,213.9 billion (or $19.214 TRILLION). As of December 2022, real personal disposable income had fallen to $15,213.0 or $15.213 TRILLION. That is a loss of $4 TRILLION since March 2021. Or a -21% Loss in Real Disposable Income.

Here is the campaign video for Joe Biden from 2020.

Biden’s campaign photo.