The Amazing, Pre-Downward Revision, Advanced GDP Report! Surprise GDP Driven By Cousin Eddies Fueled By Massive Debt

To quote Cousin Eddie from Christmas Vacation, “That there’s an RV.” Recreational goods and vehicles (aka, RVs) were second in Personal Consumption spending after America’s overpriced healthcare.

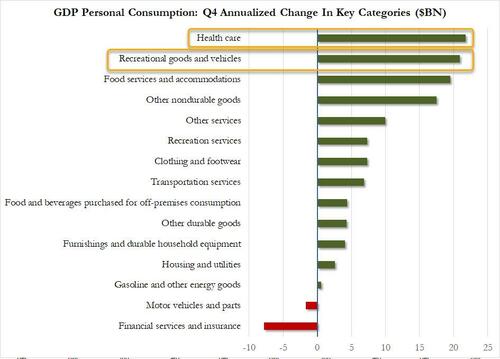
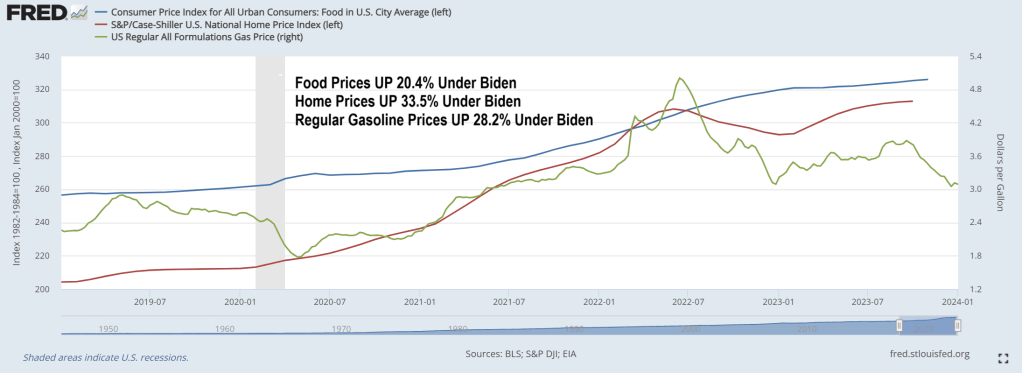
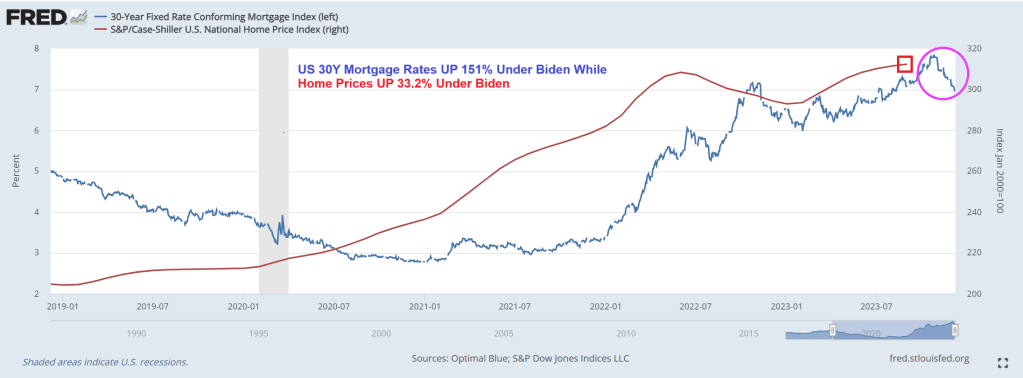
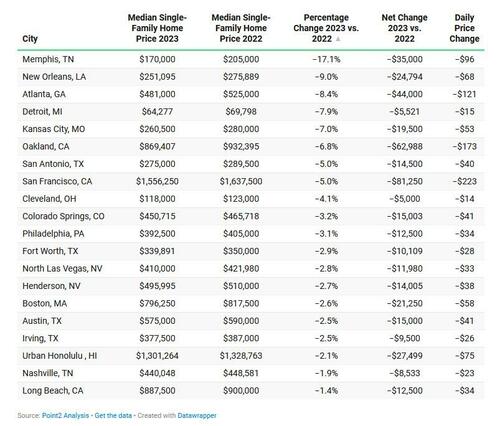
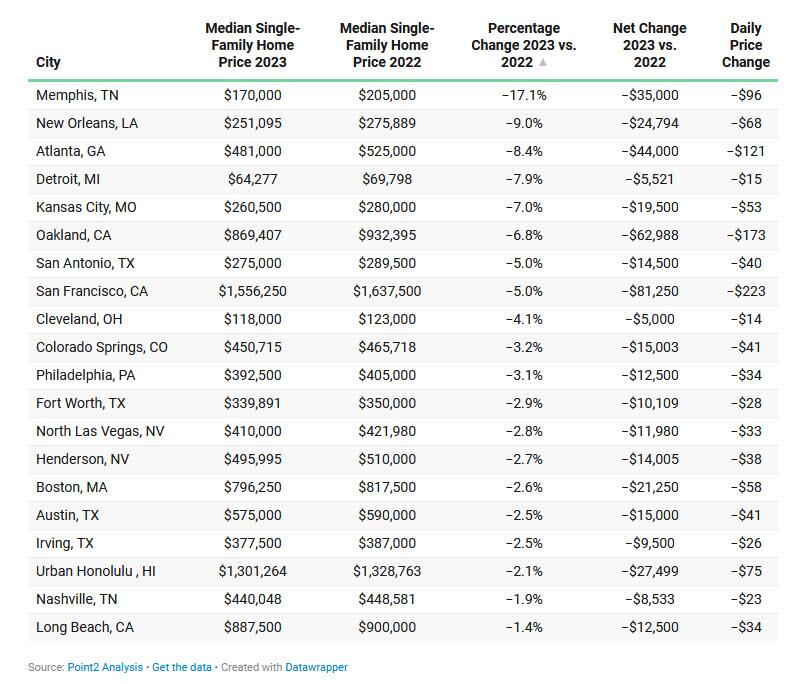
Spending on RVs makes sense since housing has become unaffordable for millions of households under Bidenomics.

The increase in real GDP reflected increases in consumer spending, exports, state and local government spending, nonresidential fixed investment, federal government spending, private inventory investment, and residential fixed investment (table 2). Imports, which are a subtraction in the calculation of GDP, increased.

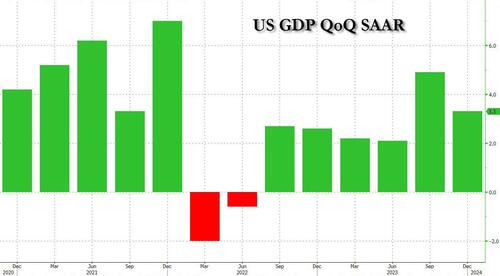
Note that GDP growth was better under Trump (pre-Covid).

The increase in consumer spending reflected increases in both services and goods. Within services, the leading contributors were food services and accommodations as well as health care. Within goods, the leading contributors to the increase were other nondurable goods (led by pharmaceutical products) and recreational goods and vehicles (led by computer software). Within exports, both goods (led by petroleum) and services (led by financial services) increased. The increase in state and local government spending primarily reflected increases in compensation of state and local government employees and investment in structures. The increase in nonresidential fixed investment reflected increases in intellectual property products, structures, and equipment. Within federal government spending, the increase was led by nondefense spending. The increase in inventory investment was led by wholesale trade industries. Within residential fixed investment, the increase reflected an increase in new residential structures that was partly offset by a decrease in brokers’ commissions. Within imports, the increase primarily reflected an increase in services (led by travel).

Compared to the third quarter of 2023, the deceleration in real GDP in the fourth quarter primarily reflected slowdowns in private inventory investment, federal government spending, residential fixed investment, and consumer spending. Imports decelerated.

Current‑dollar GDP increased 4.8 percent at an annual rate, or $328.7 billion, in the fourth quarter to a level of $27.94 trillion. In the third quarter, GDP increased 8.3 percent, or $547.1 billion (tables 1 and 3).

The price index for gross domestic purchases increased 1.9 percent in the fourth quarter, compared with an increase of 2.9 percent in the third quarter (table 4). The personal consumption expenditures (PCE) price index increased 1.7 percent, compared with an increase of 2.6 percent. Excluding food and energy prices, the PCE price index increased 2.0 percent, the same change as the third quarter.

Personal Income

Current-dollar personal income increased $224.8 billion in the fourth quarter, compared with an increase of $196.2 billion in the third quarter. The increase primarily reflected increases in compensation, personal income receipts on assets, and proprietors’ income that were partly offset by a decrease in personal current transfer receipts (table 8).

Disposable personal income increased $211.7 billion, or 4.2 percent, in the fourth quarter, compared with an increase of $143.5 billion, or 2.9 percent, in the third quarter. Real disposable personal income increased 2.5 percent, compared with an increase of 0.3 percent.

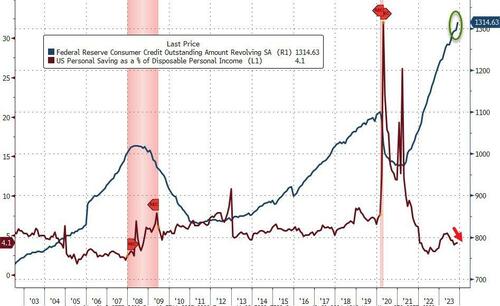
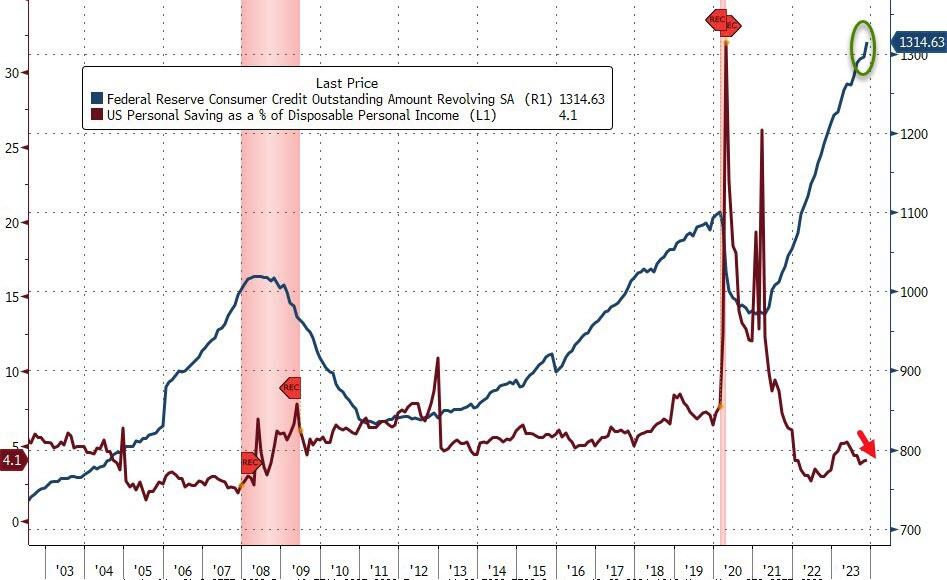
Personal saving was $818.9 billion in the fourth quarter, compared with $851.2 billion in the third quarter. The personal saving rate—personal saving as a percentage of disposable personal income—was 4.0 percent in the fourth quarter, compared with 4.2 percent in the third quarter.

GDP for 2023

Real GDP increased 2.5 percent in 2023 (from the 2022 annual level to the 2023 annual level), compared with an increase of 1.9 percent in 2022 (table 1). The increase in real GDP in 2023 primarily reflected increases in consumer spending, nonresidential fixed investment, state and local government spending, exports, and federal government spending that were partly offset by decreases in residential fixed investment and inventory investment. Imports decreased (table 2).

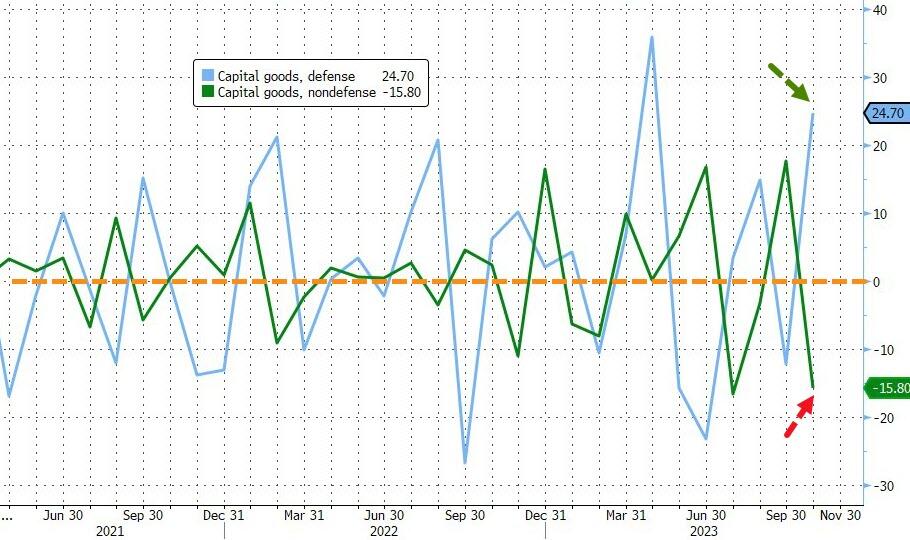
The increase in consumer spending reflected increases in services (led by health care) and goods (led by recreational goods and vehicles). The increase in nonresidential fixed investment reflected increases in structures and intellectual property products. The increase in state and local government spending reflected increases in gross investment in structures and in compensation of state and local government employees. The increase in exports reflected increases in both goods and services. The increase in federal government spending reflected increases in both nondefense and defense spending.

The decrease in residential fixed investment mainly reflected a decrease in new single-family construction as well as brokers’ commissions. The decrease in private inventory investment primarily reflected a decrease in wholesale trade industries. Within imports, the decrease primarily reflected a decrease in goods.

Current-dollar GDP increased 6.3 percent, or $1.61 trillion, in 2023 to a level of $27.36 trillion, compared with an increase of 9.1 percent, or $2.15 trillion, in 2022 (tables 1 and 3).

The price index for gross domestic purchases increased 3.4 percent in 2023, compared with an increase of 6.8 percent in 2022 (table 4). The PCE price index increased 3.7 percent, compared with an increase of 6.5 percent. Excluding food and energy prices, the PCE price index increased 4.1 percent, compared with an increase of 5.2 percent.

Measured from the fourth quarter of 2022 to the fourth quarter of 2023, real GDP increased 3.1 percent during the period (table 6), compared with an increase of 0.7 percent from the fourth quarter of 2021 to the fourth quarter of 2022.

The price index for gross domestic purchases, as measured from the fourth quarter of 2022 to the fourth quarter of 2023, increased 2.4 percent, compared with an increase of 6.2 percent from the fourth quarter of 2021 to the fourth quarter of 2022. The PCE price index increased 2.7 percent, compared with an increase of 5.9 percent. Excluding food and energy, the PCE price index increased 3.2 percent, compared with 5.1 percent. 

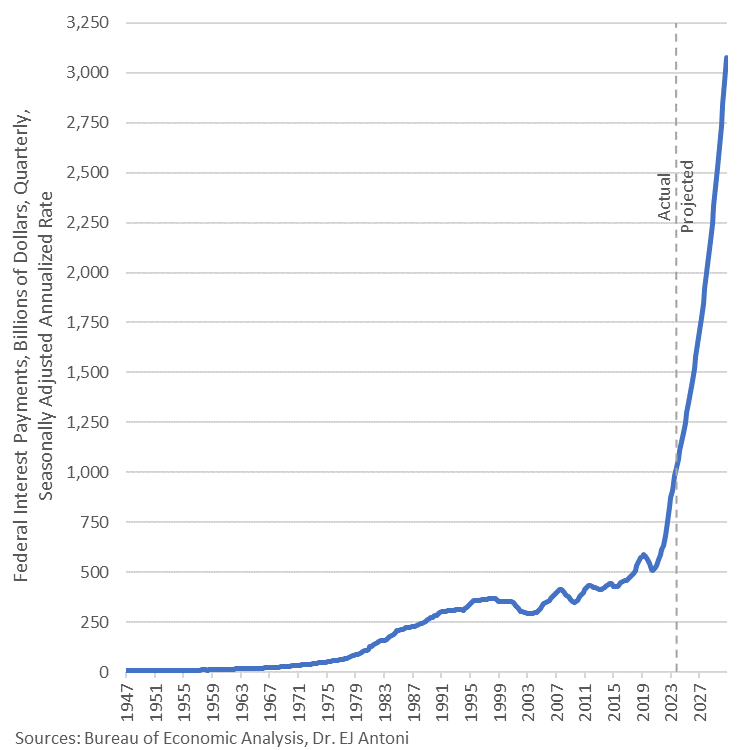
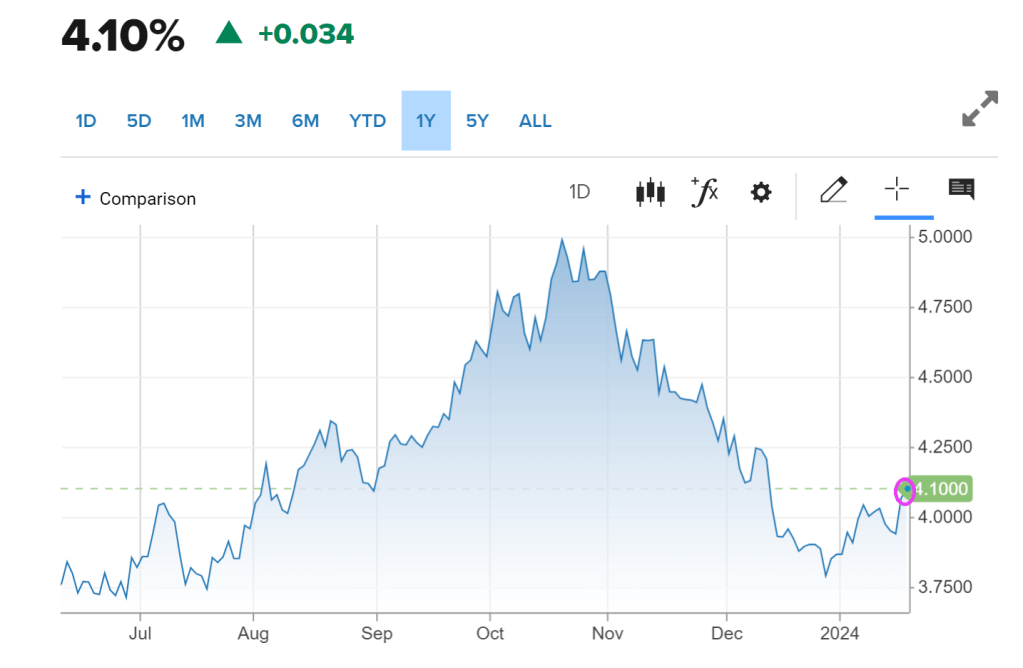
Annualized interest on the federal debt now exceeds $1 trillion and is projected to breach $3 trillion, annualized rate, by Q4 2030.

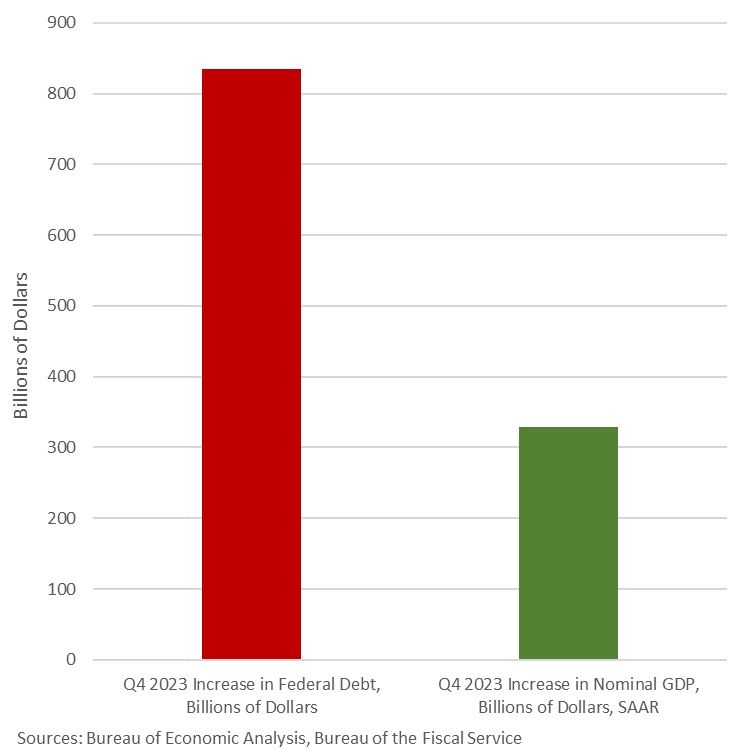
What can you get for an $834-billion increase in federal debt? Only a $328-billion increase in GDP. This economic “growth” in Q4 ’23 was fueled by gov’t expenditures and gov’t transfers, which in turn are fueled by deficits – sound sustainable?

This is Cousin Eddie’s RV. Cheaper than a house under Bidenomics!

Baby, It’s Cold Outside! Electricity Prices UP 24.25% Under Bidenomics (NASDAQ To Commodity Ratio Near Dot.com Bubble High)

Baby, it’s cold outside! Of course, government still wants to ban natural gas and coal.

The average price of electricity has risen a whopping 24.25% under Biden and Bidenomics. Brrr!!

No wonder Biden only wants to talk about unlimited abortion and NOT the immigration (Fentanyl, child trafficing, crime, etc) fiasco at the border and continually rising prices. Or Biden’s growing wars.

The NASDAQ commodity index RATIO is getting back to dot.com era bubble levels.

Not Always Sunny! Dis-Inflation & Disappointment For Philly Fed Survey In January (-10.6, Worse Than Expected)

It’s not always sunny in Philadelphia! And not because the Eagles got stomped by Baker Mayfield and the Tampa Bay Bucs.

Manufacturing activity in the Philadelphia region continued to decline in January (for the 18th month of the last 20). The headline Philly Fed survey printed -10.6 (worse than the -6.5 expected) and apart from the insane outlier spike in August, this indicator screams recession…

Source: Bloomberg

More worrying is the fact that hope appears to be dwindling fast as the six-month-forecast for the survey plunged back into contraction (from +12.6 to -4.00)…

Source: Bloomberg

Philly Fed’s demise is consistent with the collapse of hope as ‘soft’ survey data has slumped in the last month, back to its weakest since July (as ‘hard’ data improves relative to expectations)…

Source: Bloomberg

On the bright side for the doves, the dis-inflationary trend remains in tact as priced paid and prices received both plunged in January. However, we highlight the fact that Philly businesses expect price pressure to return in the next six months…

Source: Bloomberg

Overall, the ‘bad news’ in this report should buoy stocks and bonds (lower inflation and lower growth enables sooner and faster cuts)… But will it.

Green man (The Federal Reserve) will stike again!

WTF are dancing sandwiches??

Fed Better Think Twice About Rate Cuts! 10-year Treasury Yield Surges To 4.10% After Strong Dec Retail Sales (Consumers Win, Fed/Treasury Lose)

The Fed had better think twice about expected rate cuts. The market just isn’t feeling it.

Treasury yields rose Wednesday, with the 10-year yield touching almost 4.10% as investors focused on stronger-than-expected December retail sales and the latest remarks from Federal Reserve members.

The yield on the 10-year Treasury note was recently up 4 basis points at 4.108% after briefly getting to 4.117%, the highest since Dec. 13. The 2-year Treasury yield rose by around 11 basis points to trade at 4.335%.

December’s retail sales data indicated strong consumer demand at the holidays. Retail sales increased 0.6% for the month, above economists’ estimates of 0.4%, as compiled by Dow Jones. Excluding autos, sales rose 0.4%, which also topped a 0.2% estimate.

On Tuesday, yields jumped after comments from Federal Reserve Governor Christopher Waller, who suggested that while the central bank will likely cut rates this year, it may take its time.

At the World Economic Forum in Davos, more European Central Bank members indicated that markets were getting ahead of themselves on rate cut projections.

The president of the Dutch central bank, Klaas Knot, told CNBC Wednesday that the euro zone’s central bank looked at overall financial conditions, and that “the more easing the market has already done for us, the less likely we will cut rates.” Knot was referring to the fact that higher stock and bond prices in the fourth quarter of last year acted as the equivalent of easier interest rate policy, while lower prices act as the equivalent of tighter policy.

Rising interest rates are going to bite a big chunk out of The Fed’s massive ass (I mean balance sheet). Of course, The Fed sends the bill to Treasury. Gee, no wonder Biden/Yellen want so much money!

There is something wrong with letting aging politicians like Biden (81), Grassley (90), Pelosi (83), etc. borrow vast sums of money to spend when they will likely not be around for another 10 years.

Biden’s Economy Under A Bad Sign! 38% Of US Companies Anticipate That They Will Conduct Layoffs In 2024 (Office Vacancy Rate Hits 20%!)

The US economy is under a bad sign. And if it wasn’t for The Fed’s money printing, we would have no economy at all!

We experienced a tremendous amount of economic turbulence in 2023, but at least the employment market was relatively stable. 

Unfortunately, that period of relative stability appears to be ending. 

The pace of layoffs really seemed to pick up steam at the end of 2023, and the outlook for the coming year is not promising at all.  In fact, a survey that was just conducted by Resume Builder discovered that a whopping 38 percent of U.S. companies anticipate that they will conduct layoffs in 2024

  • 38% of companies say they are likely to have layoffs in 2024
  • 52% are likely to implement a hiring freeze in 2024
  • Half say anticipation of a recession is a reason for potential layoffs
  • 4 in 10 say layoffs are due to replacing workers with artificial intelligence (AI)
  • 3 in 10 companies reducing or eliminating holiday bonuses this year

If you currently have a job that you highly value, try to hold on to it as tightly as you can.

Because the employment market is starting to shift in a major way.

In recent weeks, so many large U.S. companies have been announcing layoffs…

Nike has announced a $2 billion cutback over the next three years, with an uncertain number of job cuts included. Toy giant Hasbro will cut nearly 20% of its workforce in 2024, according to reports from the Wall Street Journal. Music service Spotify announced a third round of layoffs. A recent email from CEO Daniel Ek says the company plans to cut its workforce by nearly 20%. Roku is going to be limiting new hires, and laying off about 10% of its workforce, while Amazon layoffs are effecting its new gaming division (all 180 jobs there are being eliminated). Citi CEO Jane Fraser announced layoffs in September, and sources have told CNBC that the bank could let go of at least 10% of its workforce, across several business lines. Flexport Logistics plans to cut up to 30% of its employees, and financial services company Charles Schwab is cutting back by 5-6% of its workforce, according to reports from Business Insider.

Unfortunately, this is just the tip of the iceberg.

Many more layoffs are on the way.

Meanwhile, retailers continue to close stores at an astounding pace

With the continued rise of online shopping, along with record inflation, it’s no wonder that retailers are suffering steep financial losses. Unfortunately, this means that companies all across the U.S. are downsizing brick-and-mortar storefronts to make ends meet. In 2023, we’ve seen closures from big-name retailers and local shops alike—and the shutdowns don’t appear to be easing up anytime soon.

More than 3,000 retail locations were shut down in 2023, but that is nothing compared to what is coming

According to UBS equity analyst Michael Lasser, the U.S. remains over-retailed. Lasser estimated that the U.S. will shed almost 50,000 retail stores by 2028. He cites rising operating costs and a higher proportion of e-commerce sales, causing retailers to look closely at store locations and performance.

Can you imagine what our communities will look like if that projection is even close to accurate?

As economic conditions deteriorate, people are going to get more desperate and the conditions in our streets will become even more chaotic.

You may not have heard about this yet, but earlier this week a giant mob of more than 100 young people savagely looted a bakery in Compton, California

A mob of over 100 looters purposefully crashed a Kia into a small bakery in Compton, Calif., before they flooded in and ransacked the store during a night of rampage on the streets earlier this week.

The thieves had gathered in the area for an illegal street takeover around 3 a.m. Tuesday before making the mile-long trek to Ruben’s Bakery & Mexican Food.

When they got to the locked store, a white Kia backed into the front doors, clearing an entryway for the crowd of pillagers to get to their loot.

And so it goes. Lawlessness is bad for retail businesses. Not to mention the morale of US citizens.

And then we have the office market. The office space vacancy rate in the US has reached its highest level since 1979. In the fourth quarter of 2023 19.6% of office space in major US cities was not leased according to data collected by Moody’s Analytics.

The increase in remote work since the COVID-19 pandemic has caused a large decline in demand for office space, despite increasing attempts to get Americans back in the office. What’s more, on the demand side the stock of office space in the US is the result of earlier booms in commercial real estate construction. The last boom took place between 2012 and 2017, when demand for commercial real estate loans strengthened. On the supply side, lending standards loosened between 2012 and 2015. This era coincides with a strong rise in the commercial real estate price index, which may have motivated banks to expand lending. Loan standards tightened during the pandemic, then loosened again when the economy rebounded, but have tightened since 2021.

Since the Great Recession, commercial real estate prices have more than doubled in nominal terms, but have moved sideways since 2021. This suggests that prices have reached a plateau. However, in recent years inflation has obscured the movement of commercial real estate prices in real terms, which shows a peak in 2021, but since then there has been a decline, almost to the level during the COVID-19 pandemic. In other words, commercial real estate prices are already failing to keep up with inflation. Is this an indication that the commercial real estate bubble is already deflating? With nominal commercial real estate prices remaining elevated, most of the nominal price correction is likely still to come. Since small banks are heavily exposed to commercial real estate, the enduring problems at small banks and the fragility of commercial real estate could provide a dangerous mix that could explode during a recession. For more details, we refer to The commercial real estate-small bank nexus.

I noticed that The Administration has handed propaganda duties off to John Kirby and relegated KJP to relief pitching away from Peter Doocey!

Hey, at least KJP can speak. Unlike Hillary Clinton, the worst public speaker in the world.

Bidenomics In The Underworld! Inflation Causing Consumer Credit Debt To Soar After Second Biggest Surge In Credit Card Debt On Record As Food And Gasoline Prices Soar > 20% Under Biden (Credit Card Rates At 22.75%)

Bidenomics has taken the US economy to the underworld. Where households have to run up credit cards to ridiculous levels to cope with inflation under Bidenomics. Under Bidenomics, food prices are up 20.4%, home prices are up 33.5% and regular gasoline prices are up 28.2%. Whip out those credit cards!!!!!

According to the latest monthly consumer credit report from the Fed, in November, consumer credit exploded higher by $24.75BN, blowing away expectations of a “modest” $9BN increase after the surprisingly subdued $5.8BN (upward revised from $.5.1BN) in October and the $4.3BN average of the past 6 months. This was the biggest monthly increase since last November, and was the first $20BN+ print since Jan 2023.

When looking into the details we find something remarkable: while non-revolving credit rose a modest $4.6BN…

… in keeping with the subdued increase in recent months as rates on auto loans make them prohibitive for most consumers while student loans are actually shrinking for the 2nd quarter in a row…

… what was the big shock in today’s data was the blowout surge in revolving credit, which in November exploded by a whopping $19.133BN, a record surge from the $2.9BN in October, and the second biggest monthly increase in credit card debt on record!

This, despite the average interest rate on credit card accounts in Q4 flat at a record high 22.75% for the second quarter in a row.

What is especially surprising about this conirmation that the bulk of holiday spending was on credit  is that it takes place after several months of relative return to normaly, when consumers appeared increasingly reluctant to max out their credit cards due to record high rates, and at a time when the personal savings rate in the US has collapsed back near multi-decade lows in recent months.

Well, it now appears that Americans have once again done what they do so well: follow in the footsteps of their government and throw all caution to the wind, charging everything they can (and whatever they can’t put on installment plans which also hit a record late last year) including groceries, on their credit card, and praying for the best… or not even bothering to worry about what comes next.

In addition to massive debt to cope with Bidenomics, we now have Soylent Green.

Running On Empty? US Bank Deposit Outflows Continue To Shrink As Regional ‘Stress’ Accelerates (Mortgage Rates UP 151% Under Biden)

The song “Running on Empty” by Jackson Browne comes to mind when analyzing the state of American banking, especially regional banks.

Yesterday we found out that inflows to money-market funds continue to be huge ($290BN in six weeks), and more importantly, regional banks’ usage of The Fed’s BTFP bailout facility surged to a new record high (even as regional banks surged

Source: Bloomberg

And so, with that shitshow in mind, we await the glorious manipulation of The Fed’s bank deposits data to reinforce that equity confidence.

On a seasonally-adjusted basis, banks saw a $53.7BN deposit outflow…

Source: Bloomberg

However, on a non-seasonally-adjusted basis, deposits rose by $27BN

Source: Bloomberg

And even with the outflows (SA), the divergence between soaring money-market funds and bank deposits continues to widen…

Source: Bloomberg

Excluding foreign bank deposits, domestic banks saw the third week of the last four of deposit outflows (-$40.6BN SA) with Large banks -$35BN (SA) and Small banks losing $5.7BN (SA). On an NSA basis, domestic banks saw inflows of $36.5BN last week with Large banks adding $32BN and Small banks adding $4BN…

Source: Bloomberg

That adds up to $88BN (SA) of deposit outflows in the last four weeks (bank to its lowest total since May…

Source: Bloomberg

And on the other side of the ledger, despite deposits declining SA, loan volumes increased (SA) for the third week in a row with Small banks adding $2.1BN and Large banks adding $3.8BN…

Source: Bloomberg

Finally, the key warning sign continues to trend ominously lower (Small Banks’ reserve constraint), supported above the critical level by The Fed’s emergency funds (for now)…

Source: Bloomberg

As the red line shows, without The Fed’s help, the crisis is back (and large bank cash needs a home – green line – like picking up a small bank from the FDIC).

Mortgage rates, despite coming down recently, are still up 151% under Biden. And home prices are up 33.2%. So much for affordable housing for those renting.

So, “Running on Empty” applies to middle class and their ability to afford housing.

Addicted To Gov! $350 Billion In Brand New Central Bank Behind Market Rally (On Top Of US Fiscal Inferno!)

You might as well face it, markets are “addicted to gov.” Government monetary interference, that is. Government money printing and massive Federal spending.

According to Goldman calculations, $350BN of liquidity (in USD terms) was added in November from the G4 central banks + the PBOC was nothing short of a fire hose.

In fact, this was the third largest monthly increase this year after January and March 2023.

The US addition of $60bn for a third consecutive week plus weaker dollar are the main drivers.

While the BoJ keeps adding liquidity via bond purchases, increases in the TGA balances in the past 20 days have net drained Yen liquidity.

Looking forward over the year end and at the start of 2024, Goldman thinks that the US can keep adding liquidity via high bill issuance and RRP withdrawal over the next couple of months (something we discussed last month in “How Treasury Averted A Bond Market “Earthquake” In The Last Second: What Everyone Missed In The TBAC’s Remarkable Refunding Presentation“)while the dollar contribution to benign liquidity conditions could face some headwinds due to the risk of pricing out of some of the March Fed cuts as a result of the strong positive FCI impulse in November.

Goldman’s one-factor model for risky assets based on the liquidity cycle suggests that US IG and EM hard currency debt are cheap and the bank’s STS FX carry and Brent Vol Carry indices have under-performed the benign liquidity environment and may catch up the next two months.

The US and Eurozone money supply and lending growth indicators remain weak, implying extended downside bias in domestic demand and inflation in H1-2024 (i.e., higher likelihood for easing absent a reflationary shock out of China or a supply-driven commodity price surge).

Finally, The US policy impulse (comprising of liquidity, fiscal stance, as well as nominal and real forward rates) has moved sideways in October and November after some renewed tightening in September. The GS FCI index eased nearly -100 basis points (-1.4z) in November.

Doctor, doctor (Yellen), we got a bad case of distortionomics (where the 1% wins and the 99% fall behind). After all, under Dr. Yellen as our Treasury Secretary, we are suffering from massive fiscal inferno with wild government spending. I would use “Government Gone Wild!” but the thought of Yellen … well, never mind.

Meanwhile, while John Kerry pushes for ending ALL coal powered plants (good luck charging the thousands of EV charging stations on wind/solar power!), China is building NUCLEAR plants. While US green wimps (Kerry comes to mind) whine whenever nuclear plants are mentioned for the US.

Back In Red! Factory Order Plunge -3.6% In October, Largest Drop Since COVID Lockdowns

US factory orders are back in red.

Factory orders tumbled even more than expected, down 3.6% MoM – the biggest drop since the COVID lockdowns (April 2020). September was also revised lower (making October’s decline even worse) from +2.8% MoM to +2.3% MoM…

Source: Bloomberg

The big monthly decline and revisions dragged orders down 2.1% YoY (the biggest drop since Sept 2020).

Core factory orders also dropped (-1.2% Mom), leaving them down 2.2% YoY – the eight month in a row of annual declines…

Source: Bloomberg

The final Durable Goods Orders data for October confirmed the preliminary print plunge down 5.4% MoM.

Finally, we note that it could have been a lot worse as Defense spending shot up 24.7% MoM (as non-defense dropped 15.8% MoM0…

On a year-over-year (YoY) basis, factory orders grew at a rate of … 0% in October as M2 Money growth remains negative. Apparently, the economy is addicted to gov money printing.

Not a great report with a year until the Presidential elections.

Goin’ Down! Recent Homeowners Lose Over $200 Per Day In Property Value (San Francisco Sellers Reported Biggest Losses, Memphis TN Leads In % Losses)

The US housing market is goin’ down!

While the Case-Shiller National home price index is rising again, it has been slowing since March 2022. This is happening as “the honey pot” (aka, M2 Money printing) growth is now negative. While real hourly compensation growth is slightly, the average rate of growth since April 1, 2021, is -2.1%. (Not exactly what Biden wants to broadcast as a feature of Bidenomics).

In the first couple of pandemic years, buyers swarmed the housing market to seize record-low mortgage rates with little regard to home prices. Many of them are now realizing that they may have bought a pig in a poke.

According to a recent report from Point2 Homes, many recently bought homes, particularly in the hottest regions, are deep in the red. On average, single-family homeowners have been shedding $223 in property value every day since they bought their homes last year.

Condo owners are faring even worse, losing up to $336 a day in San Francisco, or a stunning $122,500 a year.

“This double-blow market means that the most newly minted owners were first hit by the highest home prices in history, only to be cut off from building wealth by the current falling prices,” analysts wrote.

Some major markets are seeing massive net losses

Single-family homes in 16 cities examined in the analysis have faced price declines of over $10,000 over the past year.

Memphis saw the most significant single-family price plunge, as well as the second-largest decline in condo prices, which analysts say could be due to rising inventory in the city.

Condo prices in 37 cities are also weakening, including in New York and Oakland.

So, what does this mean for homeowners? Folks who shelled out plenty of cash last year to secure their deals are now grappling with depreciating property values, which means it’s harder to build equity.

And if they want to sell in today’s market, they risk reaping less for their homes than what they paid for them. Zillow reports new buyers won’t sell at a profit until they’ve spent over a decade in their homes.

In another report from Redfin, analysts estimated that more than 3% of homes sold at a loss between August to October this year. The median amount was recorded at around $40,000, although some properties lost up to six figures on the sale.

Again, San Francisco sellers reported the biggest losses, with 1 in 7 homeowners losing money on their sales. And Memphis TN leads in percentage loss at -17.1%!

There are a couple of factors that could be contributing to the Golden City’s housing woes, including the rise of remote work coupled with tech layoffs pushing residents to relocate to other areas.

“There are buyers out there, but they’re a lot more cautious and picky than they were when mortgage rates were low,” Redfin Premier real estate agent Andrea Chopp said in September.

“The Bay Area housing market was unsustainable before, so this correction is probably healthy, but the unfortunate thing is prices remain unaffordable for a lot of people—especially with rates now above 7%,” she said.

97% of sellers are in the money, though

It’s not all doom and gloom for sellers—at least not for those who’ve been residing in their homes for a long time and bought when prices were much lower than they are today.

In many markets, sellers have been reluctant to let go of their low mortgage rates and apply for a home loan at a much higher rate, and that’s keeping inventory tight and prices high.

In the three months ending July 31, 97% of sellers across the country sold for a profit, with the typical home selling 78.4%, or $203,232, more than the seller bought it for, says Redfin.

And while San Francisco has been reporting more losses than usual, the median homeowner is still reaping $625,500 more on their home sale compared to the original purchase price.

The Godfather of San Francisco property losses, California Governor Gavin Newsom.

Oh wait! That is Eddie Haskell from “Leave it to Beaver!”