The Federal Reserve (aka, The Keep) is back in the saddle again. The Fed has been unable to control inflation since Federal government spending was so fast and furious after Covid that little thought was given to the long-term ramifications of insane spending. Not to mention The Fed’s overreaction to Covid.
Example?
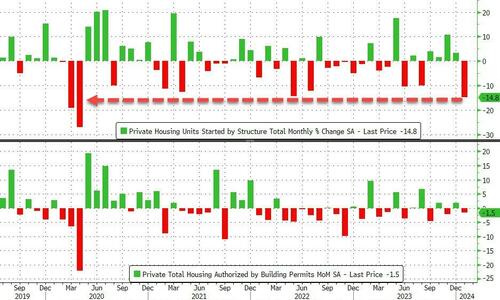
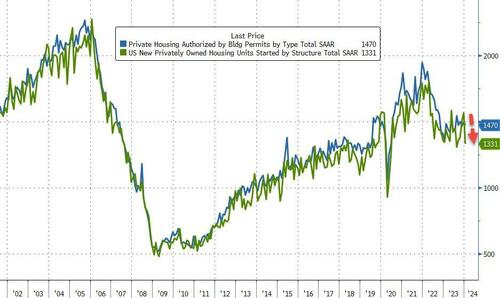
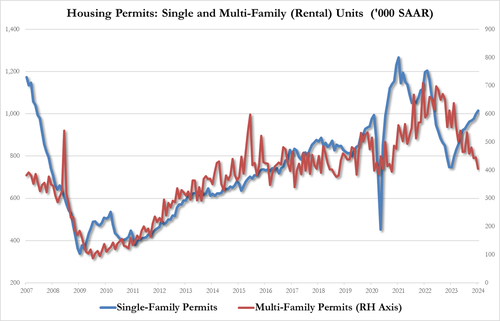
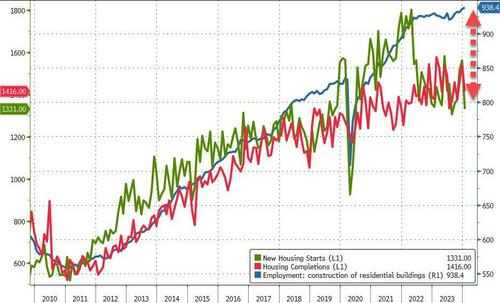
Home price growth is rising again. Home prices in traditional “bubble cities” out west were cooling, but are reaccelerating. Even Detroit and Cleveland are seeing rapid home price acceleration.
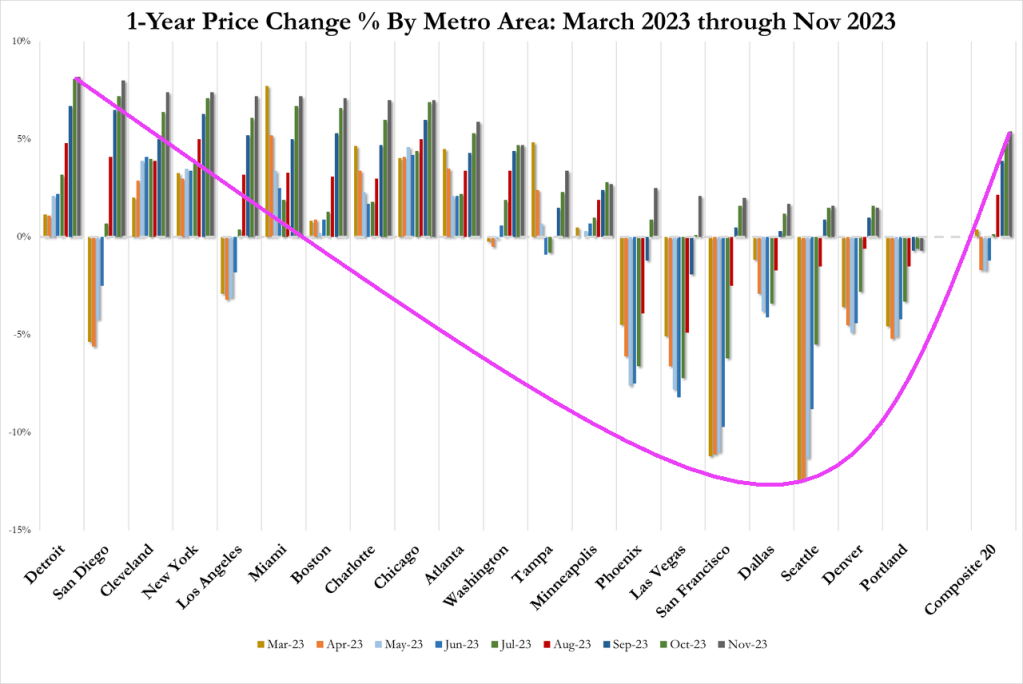
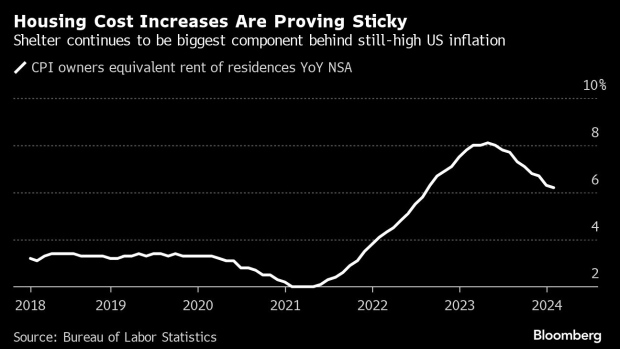
Yes, housing inflation is sticky.
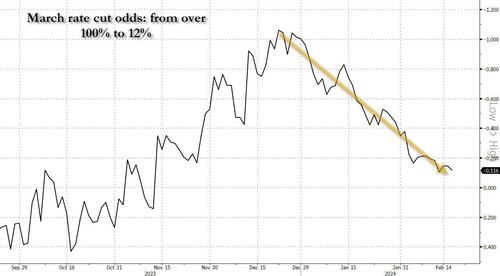
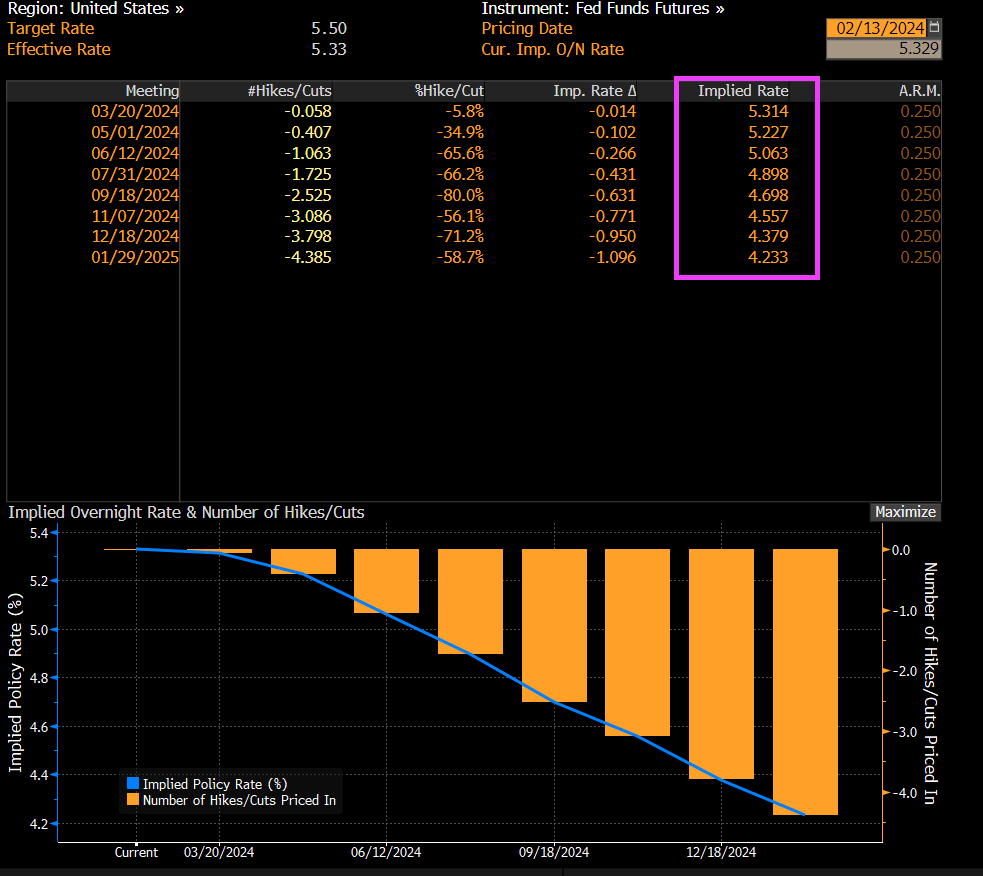
In retrospect, this wholesale dovish euphoria may have been rather short sighted, because after several strong economist reports hit the tape (with the Nov 2024 election growing closer by the day, that should hardly have been a surprise), March rate cut odds collapsed from over 100% in late December, to just 12% currently…
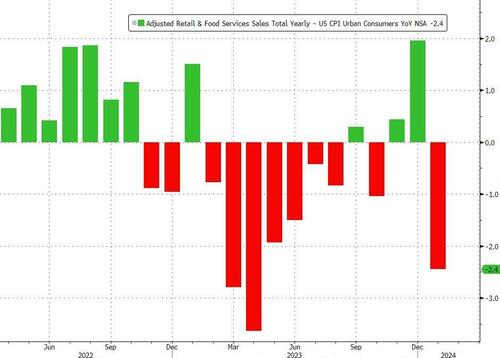
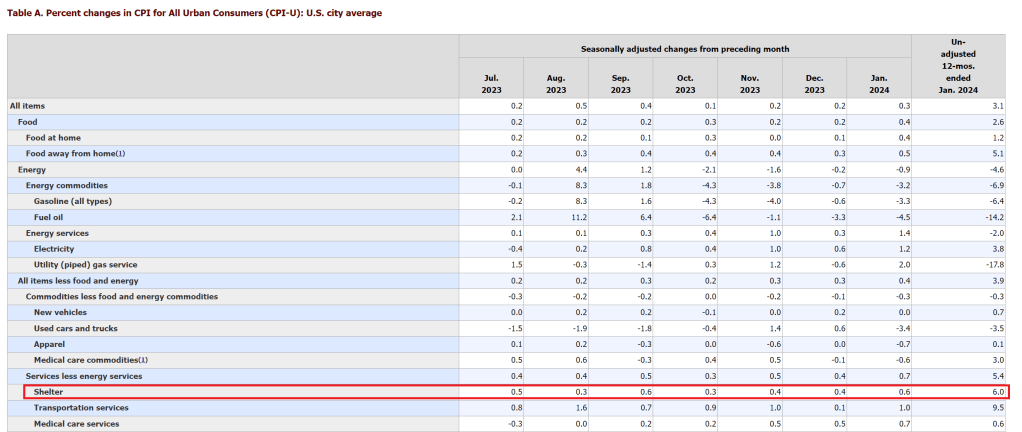
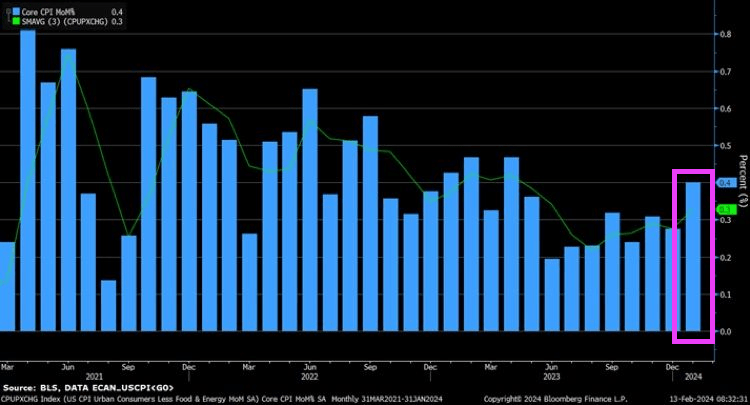
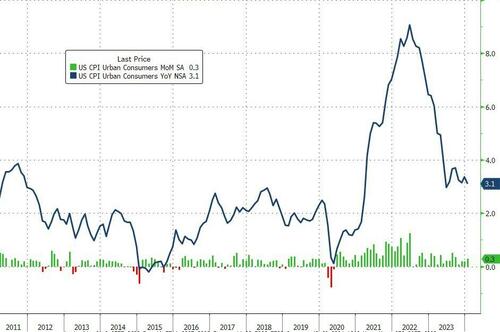
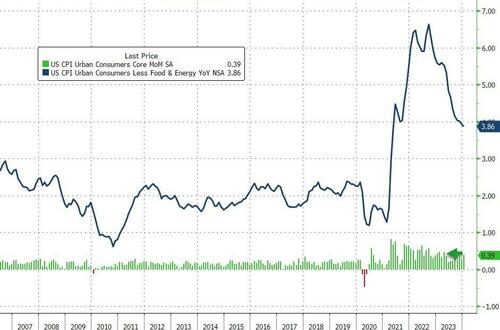
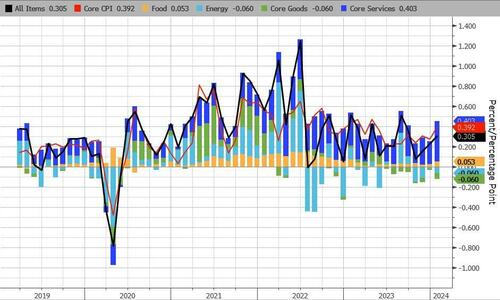
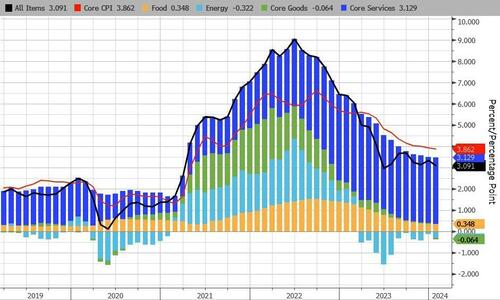
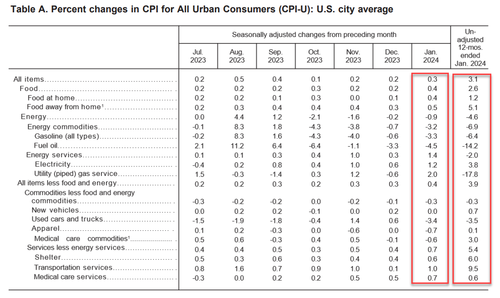
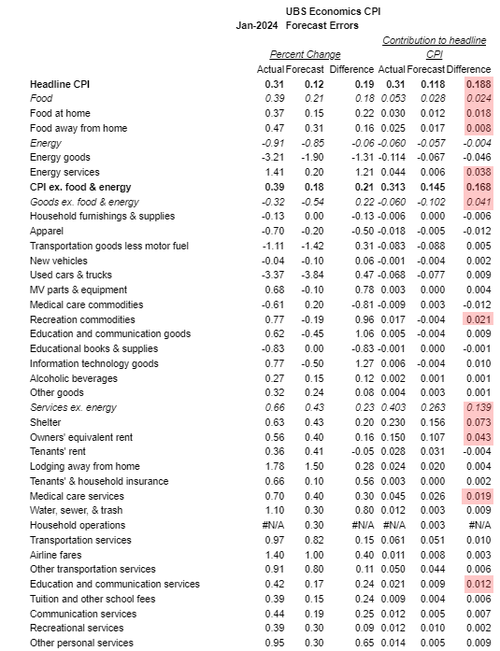
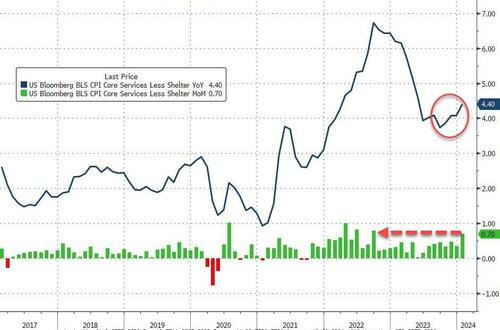
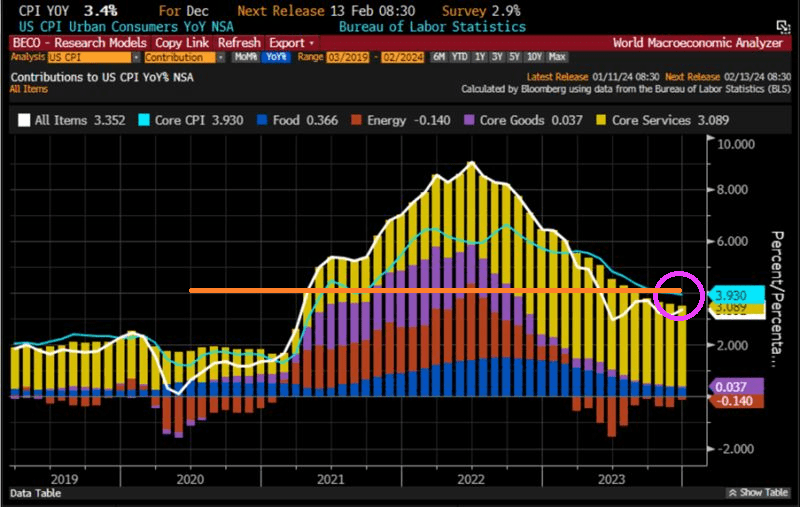
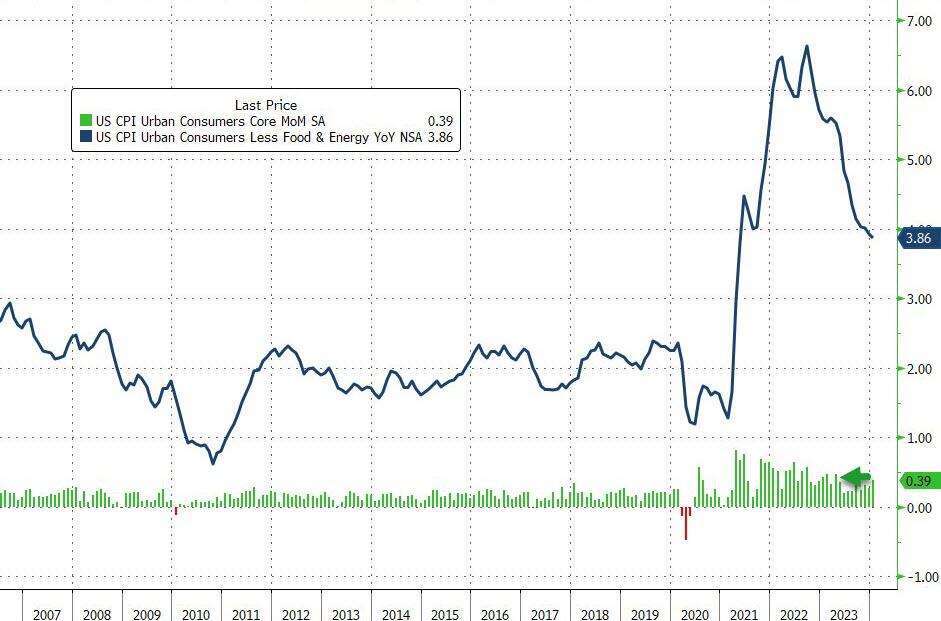
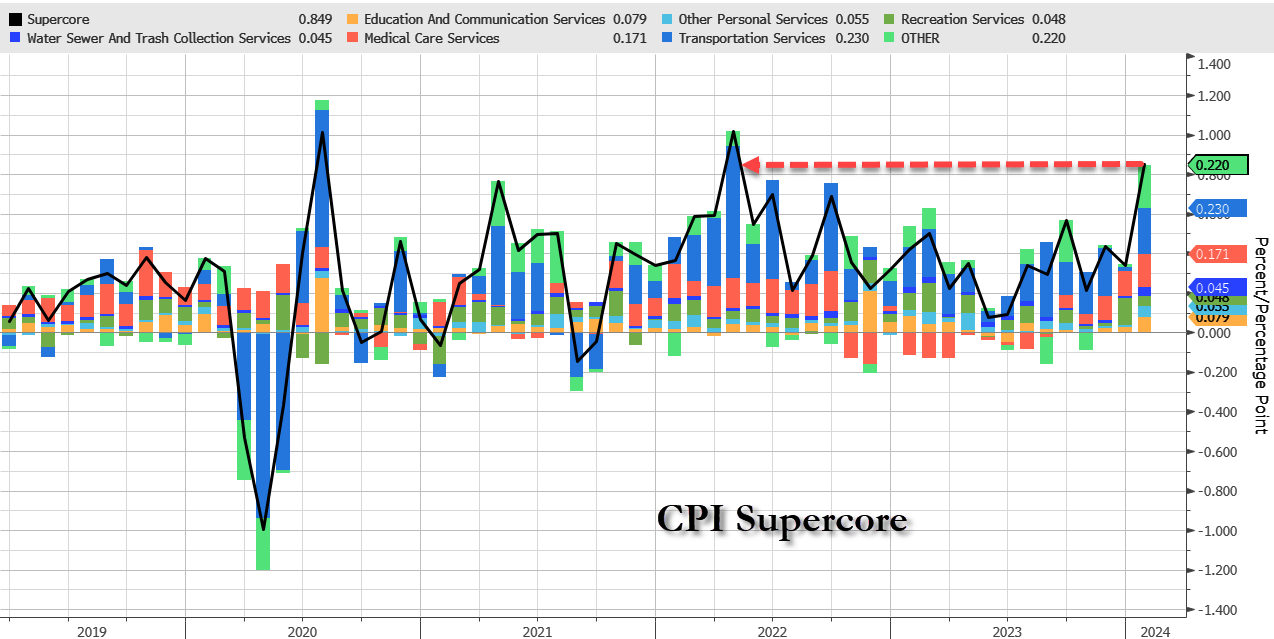
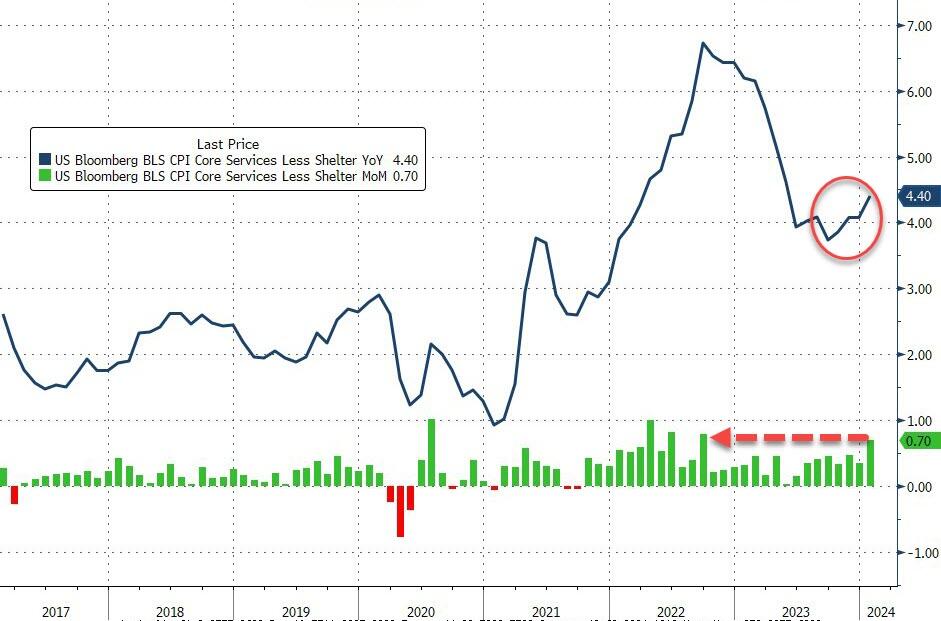
… as first the January CPI printed red blazing hot – with core coming in at 3.9% far higher than the 3.7% expected, with the 3-month annualized rate jumping to 4% from 3.3% and the 6-month annualized rate spiking to 3.7% vs 3.2%, but the biggest highlight was SuperCore CPI (i.e., core CPI services ex-Shelter) which soared 0.7% MoM, the biggest jump since Sept 2022…

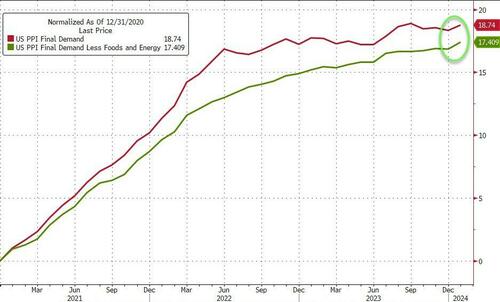
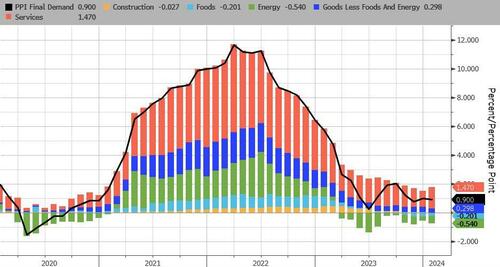
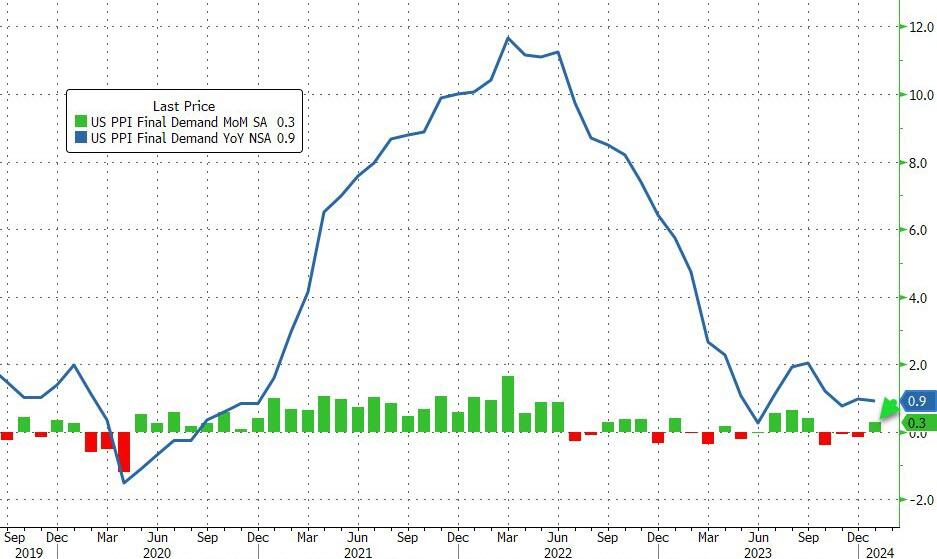
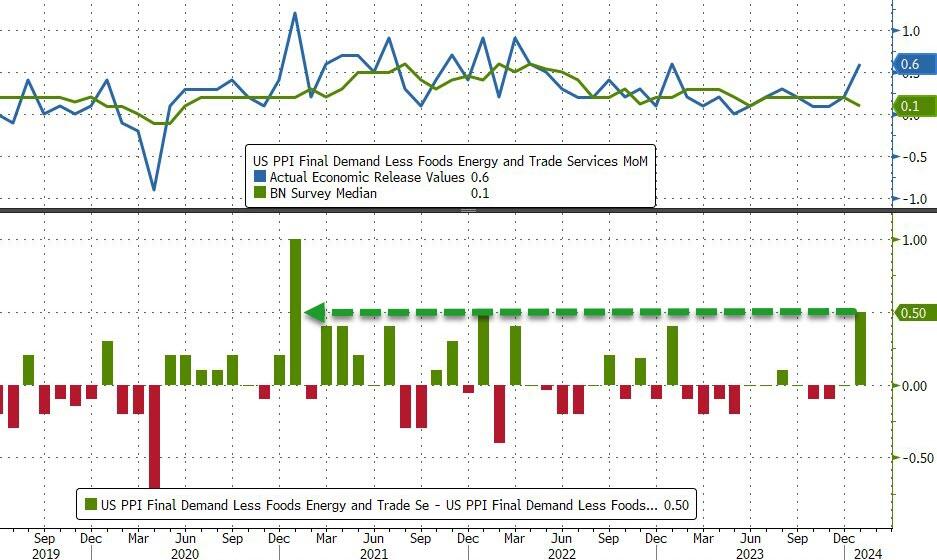
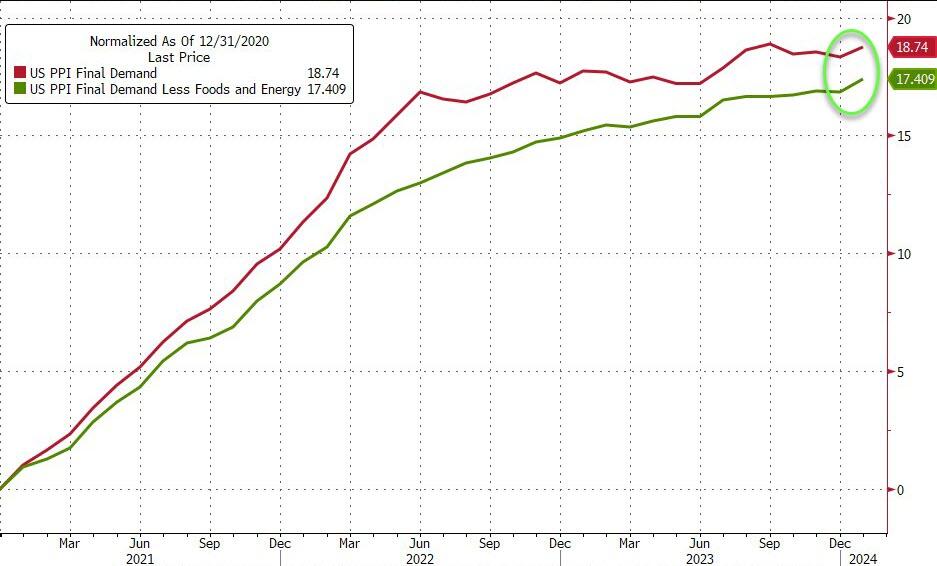
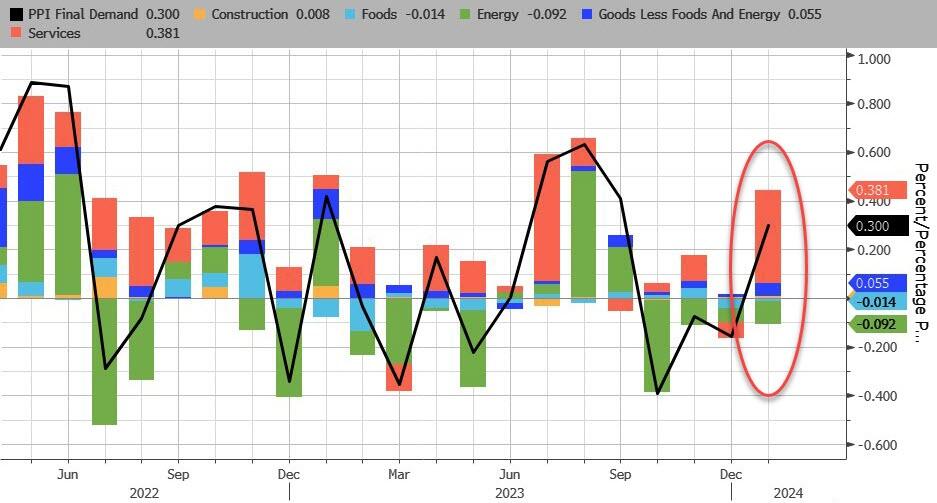
… and then the January PPI print come in even hotter, with a core component surging in January by 0.5%, smashing expectations and beating estimates by the most since Jan 2021.

The result: not only has the market rapidly priced out what if formerly saw as many as 6 rate cuts in 2024, but growing speculation that a rate cut may not come at all unless the Fed tightens some more first (and with the S&P500 now over 5000, it is pretty clear that the market has already priced in virtually all rate cuts and has cornered the Fed).
Of course, the mass migration across the Mexican border (who knows? could be up to 11 million under Biden’s Reign of Error). While Paul Krugman, the resident lunatic economist for the New York Times, extols the virtues of mass immigration for driving up GDP, fails to recognize that mass migration is helping drive up prices. This is inflation that The Fed can’t control. And Biden/Mayorkas want even MORE mass immigration.
Maybe Fed Chair Powell should watch the film “The Keep” for lessons on how to control inflation. in the face of government sanctioned mass ILLEGAL immigration from Latin America, China, Africa and The Middle East.


You must be logged in to post a comment.